Smart Adaptive Trend Flow MT4
- Indicateurs
- Version: 2.30
- Activations: 5

Professional adaptive trend, market structure, price levels and flow analysis indicator for MetaTrader 4.
Would you like to test it before purchasing? Request a fully functional trial version by sending us a private message through MQL5.com and evaluate the indicator directly on your own charts.
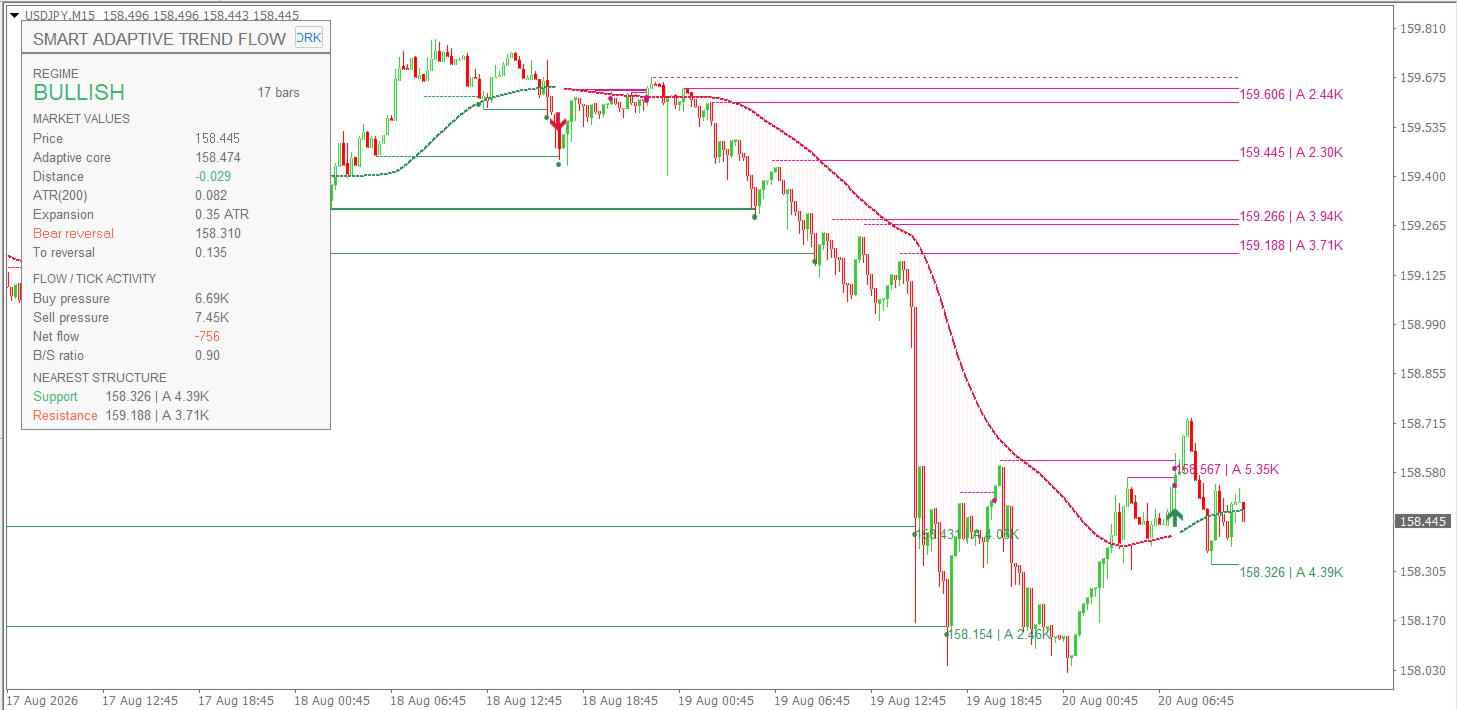
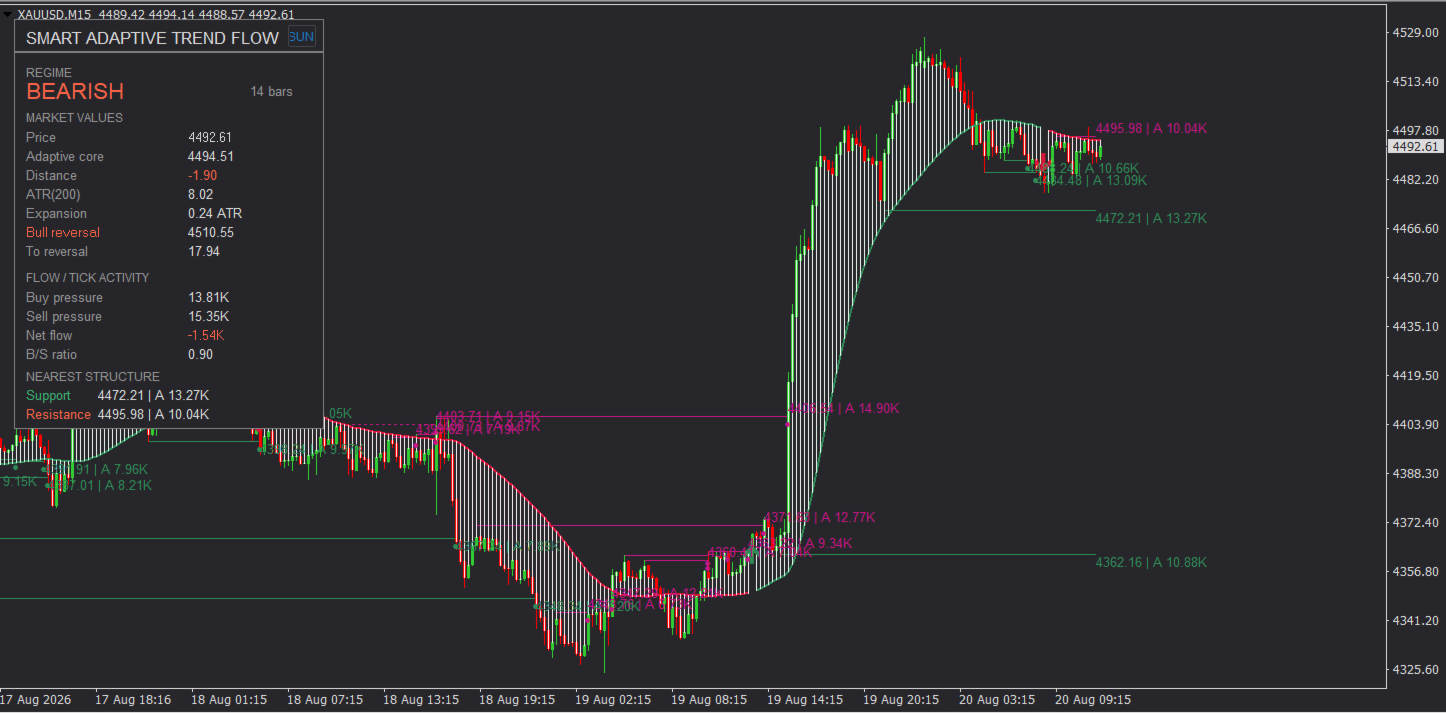
A Complete Market View
Smart Adaptive Trend Flow MT4 combines several analytical components in a single indicator:
- Adaptive trend analysis.
- BULLISH and BEARISH market regimes.
- Trend-change arrows.
- Automatic market structure.
- Dynamic support and resistance.
- Activity associated with structural levels.
- Buy/Sell Pressure and Net Flow.
- Volatility and price expansion.
- Potential reversal levels.
- Integrated analysis dashboard.
The objective is to display trend, structure, volatility and market activity within the same visual context, reducing the need to combine multiple separate indicators.
Adaptive Trend Engine
The indicator uses an adaptive trend engine that adjusts its response according to market conditions and price behavior.
Unlike a conventional moving average with a fixed response, the adaptive core evolves with the market. A volatility filter also helps prevent small fluctuations around the central line from being automatically interpreted as trend changes.
The chart clearly distinguishes:
Green: Bullish regime.
Red: Bearish regime.
The adaptive line and trend area provide an immediate visual representation of the prevailing market regime.
Trend-Change Arrows
When a transition between bullish and bearish regimes is confirmed, the indicator plots an arrow directly on the chart.
A bullish arrow identifies the confirmation of a new bullish regime, while a bearish arrow identifies the confirmation of a new bearish regime.
Regime changes are confirmed using closed candles. Once confirmed, historical transitions remain stable.
The arrows represent changes detected by the trend engine and should not be interpreted by themselves as automatic Buy or Sell orders.
Automatic Market Structure
Smart Adaptive Trend Flow also analyzes price structure and automatically identifies relevant confirmed pivots.
From these structures, the indicator generates horizontal levels that can highlight:
- Structural support.
- Structural resistance.
- Relevant highs and lows.
- Unresolved structures.
- Levels subsequently reached or swept by price.
There is no need to draw these areas manually. The indicator creates and manages structural levels automatically as the market evolves.
The user can also choose whether previously swept historical levels remain visible.
Price and Activity Values
Each structural level can display its exact price and the activity recorded around its formation.
For example:
158.420 | A 24.70K
The first value represents the structural price and A represents Activity.
Values are automatically displayed as:
K = thousands
M = millions
Activity is calculated using tick activity supplied by the broker around the formation of the structure.
Therefore, it does not represent pending orders or actual resting liquidity at that price.
Flow Analysis
The indicator includes a directional activity analysis module.
During each market regime, it analyzes tick activity together with price behavior to estimate:
Buy Pressure — activity associated with buying pressure.
Sell Pressure — activity associated with selling pressure.
Net Flow — difference between both values.
B/S Ratio — relationship between Buy Pressure and Sell Pressure.
For example, a B/S Ratio above 1 means that the activity estimated as buying pressure is greater than the estimated selling activity during the analyzed period.
Smart Adaptive Trend Flow displays these calculated values directly without converting them into artificial probability or confidence percentages.
Analysis Dashboard
The integrated dashboard concentrates the main information calculated by the indicator.
REGIME
Displays:
BULLISH / BEARISH
together with the number of bars for which the current regime has remained active.
This makes it easy to distinguish between a recent transition and a trend that has already been developing for a longer period.
MARKET VALUES
Price
Current market price.
Adaptive Core
Dynamic reference generated by the adaptive engine.
Distance
Actual distance between price and the Adaptive Core.
ATR
Current volatility value used by the system.
Expansion
Distance between price and the adaptive core expressed in ATR units.
For example:
Expansion: 1.35 ATR
means that price is approximately 1.35 ATR away from its adaptive reference. It is a measurement of distance and volatility, not a probability.
Reversal Level
The dashboard also displays:
Bear Reversal or Bull Reversal
depending on the active regime.
This provides a specific price level associated with a potential transition from the current market regime.
To Reversal displays the distance between the current market price and that level.
This allows the trader to see the current direction, the potential transition level and the distance remaining to reach it.
Nearest Structure
The dashboard automatically identifies the nearest unresolved structures:
Support
Resistance
together with their exact price and Activity.
Example:
Support: 158.420 | A 24.70K
This provides immediate access to nearby structural levels without having to manually locate them among all the horizontal lines on the chart.
Main Features
- Adaptive Trend Engine.
- Automatic BULLISH/BEARISH regimes.
- Trend-change arrows.
- Closed-candle confirmation.
- Dynamic trend line and visual trend area.
- Automatic market structure detection.
- Structural support and resistance.
- Unresolved and swept levels.
- Price + Activity for structural levels.
- Buy Pressure and Sell Pressure.
- Net Flow and B/S Ratio.
- ATR and Expansion.
- Bull/Bear Reversal Level.
- Distance to Reversal.
- Nearest Support/Resistance.
- Integrated dashboard.
- Light and dark themes.
- Customizable colors and visualization.
- Designed for MetaTrader 4.
Markets and Timeframes
Smart Adaptive Trend Flow MT4 can be used with different instruments available in MetaTrader 4, including:
Forex, Gold and other metals, indices, CFDs and other instruments supported by your broker.
It can be used on different timeframes according to the trader's preferred type of analysis.
Volatility and especially tick activity can vary between instruments and brokers. For this reason, Flow and Activity values should always be interpreted within the context of the symbol and data provider being used.
How to Use It
The indicator does not impose a specific trading strategy. Its different components can be combined, for example, as:
Trend → Expansion → Flow → Structure → Reversal
A trader can first identify the prevailing regime, analyze expansion relative to the Adaptive Core, evaluate directional activity and then locate relevant structural and reversal levels.
It can also be used as a trend filter, market structure tool, support/resistance reference or additional confirmation tool within an existing strategy.
Customization
The user can configure different aspects of the indicator, including:
- Trend sensitivity.
- Structure history.
- Maximum number of levels.
- Swept-level visualization.
- Price and Activity labels.
- Buy/Sell Ratio.
- Dashboard position.
- Trend and structure colors.
- Visual trend fill.
- Light/dark theme.
- Candle colors.
Fully Functional Trial
Would you like to test it on your own charts before purchasing?
Request a fully functional trial version of Smart Adaptive Trend Flow MT4 by sending us a private message through MQL5.com.
You can evaluate its behavior and analysis tools before making a purchase decision.
Important Information
Smart Adaptive Trend Flow MT4 is a technical analysis tool. It is not an Expert Advisor and does not automatically open, modify or close trades.
Trend-change arrows, market regimes, structural levels, reversal levels, Activity, Buy/Sell Pressure, Net Flow and other information displayed by the indicator do not constitute financial advice and do not guarantee future price movements.
Activity and Flow values use tick data supplied by the broker and do not represent centralized volume, institutional orders, actual resting liquidity or order-book information.
The indicator does not promise or guarantee profits, profitability, win rate or future results. Historical behavior does not guarantee future performance.
Trading involves risk, and all trading and risk-management decisions remain the sole responsibility of the user.