Peak AF Deep

Indicator Description

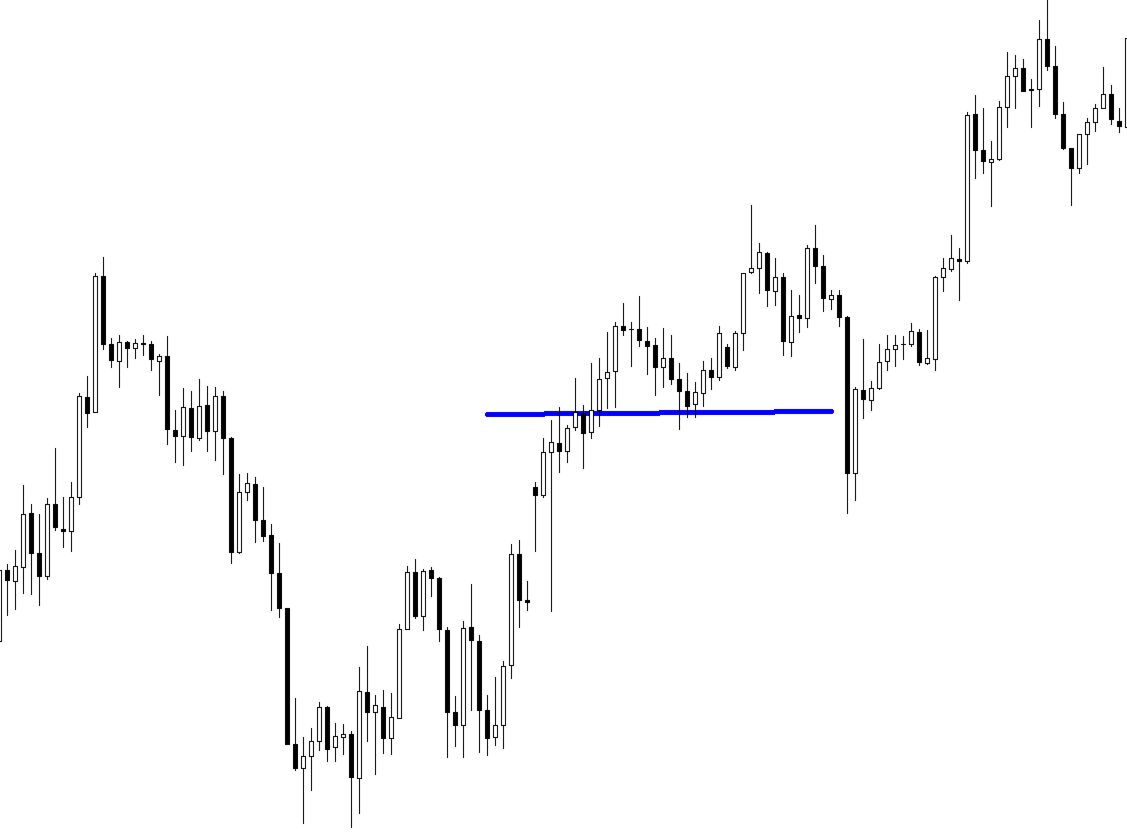
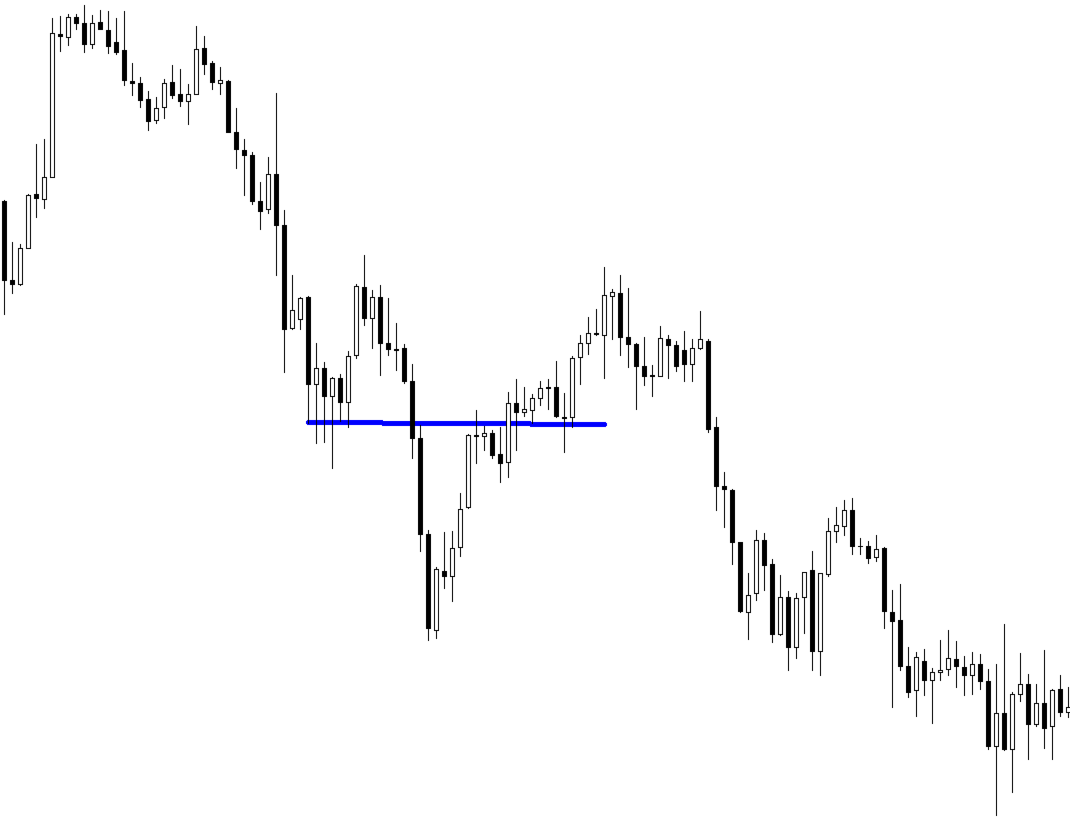
This indicator monitors overbought and oversold levels, combining technical indicator signals with financial volume analysis in the regions marked on the chart.

The system was primarily developed to support Swing Trading and Position Trading, using the H1 timeframe as its main reference. It is designed to help traders analyze areas where price may show changes in behavior, continuation, or loss of momentum.

The marked regions should be used as areas for study and monitoring, allowing users to evaluate the relationship between price, volume, overbought and oversold conditions, and other elements of their own trading methodology.

Users can also test the indicator on different timeframes, adapting its application to their own trading systems, strategies, and analytical preferences.

Important

The indicator should not be used independently as an automatic entry trigger. Its signals and marked regions are intended as an analytical tool, helping users improve their studies and seek confluences with their own trading strategies.

The purpose is to provide a robust analytical framework that can be combined with other technical studies, market structure, volume analysis, support and resistance levels, and other criteria selected by each trader.

The objective is not to determine an entry, but to help identify market regions that deserve greater attention and further analysis.
作者のその他のプロダクト
FAVERO RETURN SYSTEM Reversal Probability System The system was developed to identify market regions where price shows signs of potential exhaustion , combining overbought and oversold conditions with support and resistance levels from higher timeframes . The objective is not to claim that a reversal will necessarily occur, but rather to identify areas where the probability of a change in market direction may be increasing . How It Works The indicator primarily analyzes the following timefra
Indicator Description Opportunity Identification Indicator — Smart Money This indicator was developed to assist in identifying moments when prices may be reaching areas of greater interest , seeking possible signals in market behavior associated with the concept of “smart money” (Smart Money) , widely discussed in financial literature and market studies. The proposal is to create a bridge between technical analysis and fundamental analysis . The indicator uses technical analysis and price behavi
CONFLUENCE AND PROBABILITY INDICATOR Volume • Fibonacci • Pullback • Technical Analysis This indicator was developed with an approach focused on identifying areas of interest in the market , combining different concepts widely used in technical analysis and trading studies. Its purpose is to assist traders in interpreting price behavior through the confluence of information , allowing each user to integrate the indicator into their own analysis system and personal strategies. KEY CONCEPTS ANALYZ
Horizontal lines on the chart alternate between solid and dashed styles, representing areas of interest based on significant highs and lows from different timeframes, creating potential confluence between market structures. The indicator is designed to assist each participant in their own market studies, giving users the flexibility to combine the indicator with their personal trading system and analysis methods . The lines should not be used as standalone entry triggers . Instead, they are inte
Indicator Description This indicator was developed with the purpose of combining the structure of highs and lows from higher timeframes with confluences generated by different technical indicators . Through the use of multiple horizontal lines , the system highlights relevant market regions that can be used for study, monitoring, and analysis of price behavior . The lines are designed to assist in identifying: Market areas of interest; High and low structures from higher timeframes; Areas where
Price Compression Indicator Based on Financial Volume Levels This indicator was developed to identify price compression regions associated with relevant financial volume levels , using horizontal lines on the chart to highlight areas that may present greater market interest. The system monitors price behavior within these regions, considering different possibilities such as continuation, breakouts, rejections, and potential false breakouts . Therefore, the horizontal lines represent areas for st
フィルタ:
レビューなし
レビューに返信