Universal trading system AF

  • インディケータ
  • Alexandre Favero
    Alexandre Favero
    My Journey in the Financial Market
    I began my journey in the financial market in 2006, at a time when access to complete and well-structured educational materials on the subject was scarce. Faced with this gap, my learning came largely through self-directed study and hands-on experience.
  • バージョン: 4.40
  • アクティベーション: 5

TECHNICAL SPECIFICATION — PRICE CONTEXT, VOLUME AND MARKET INTEREST REGIONS INDICATOR

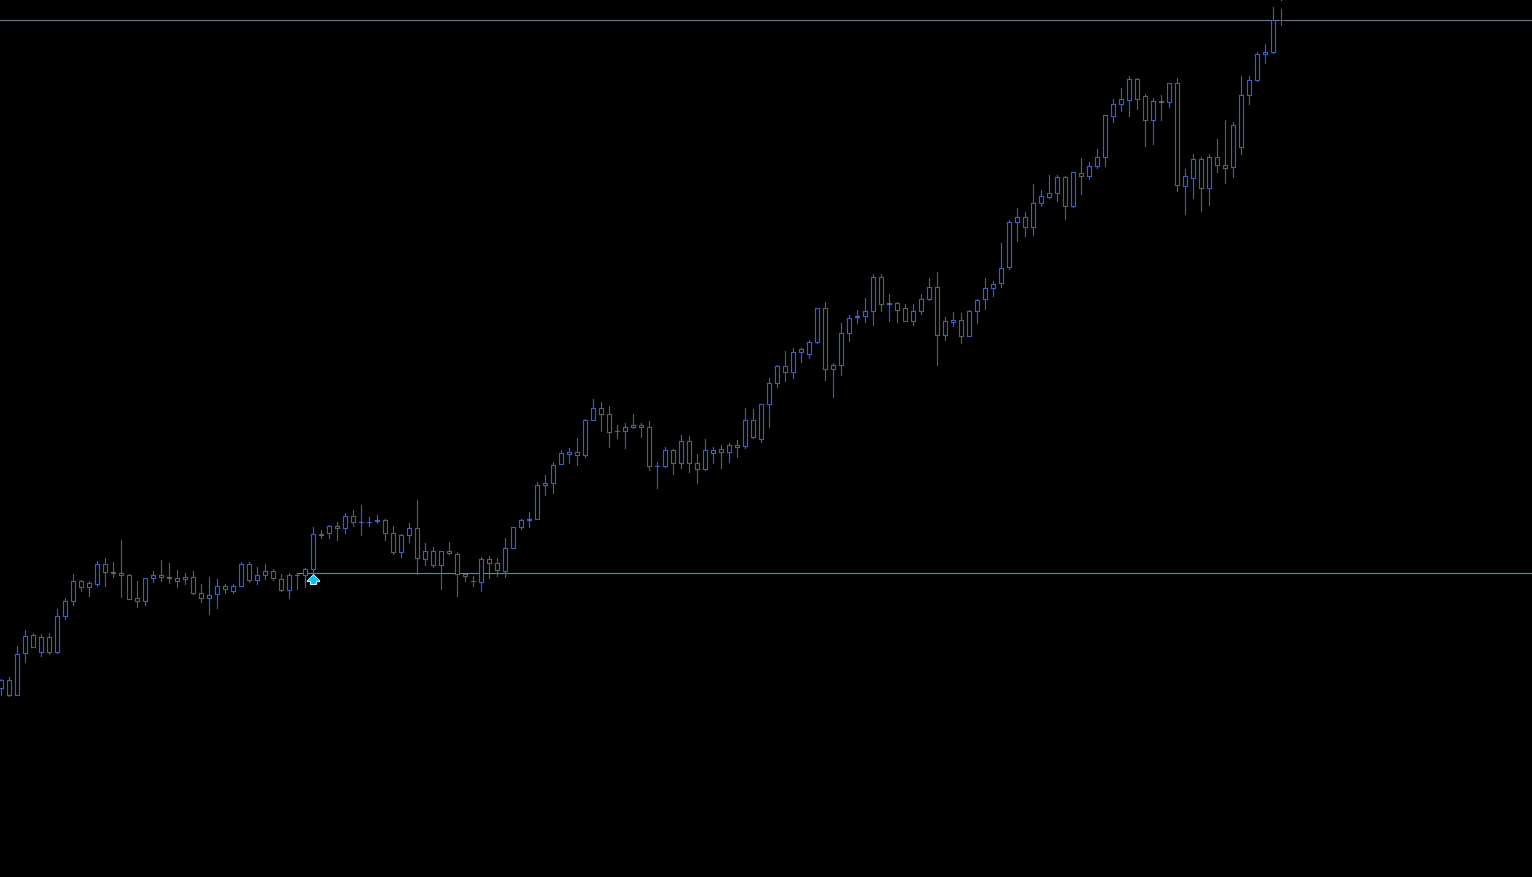
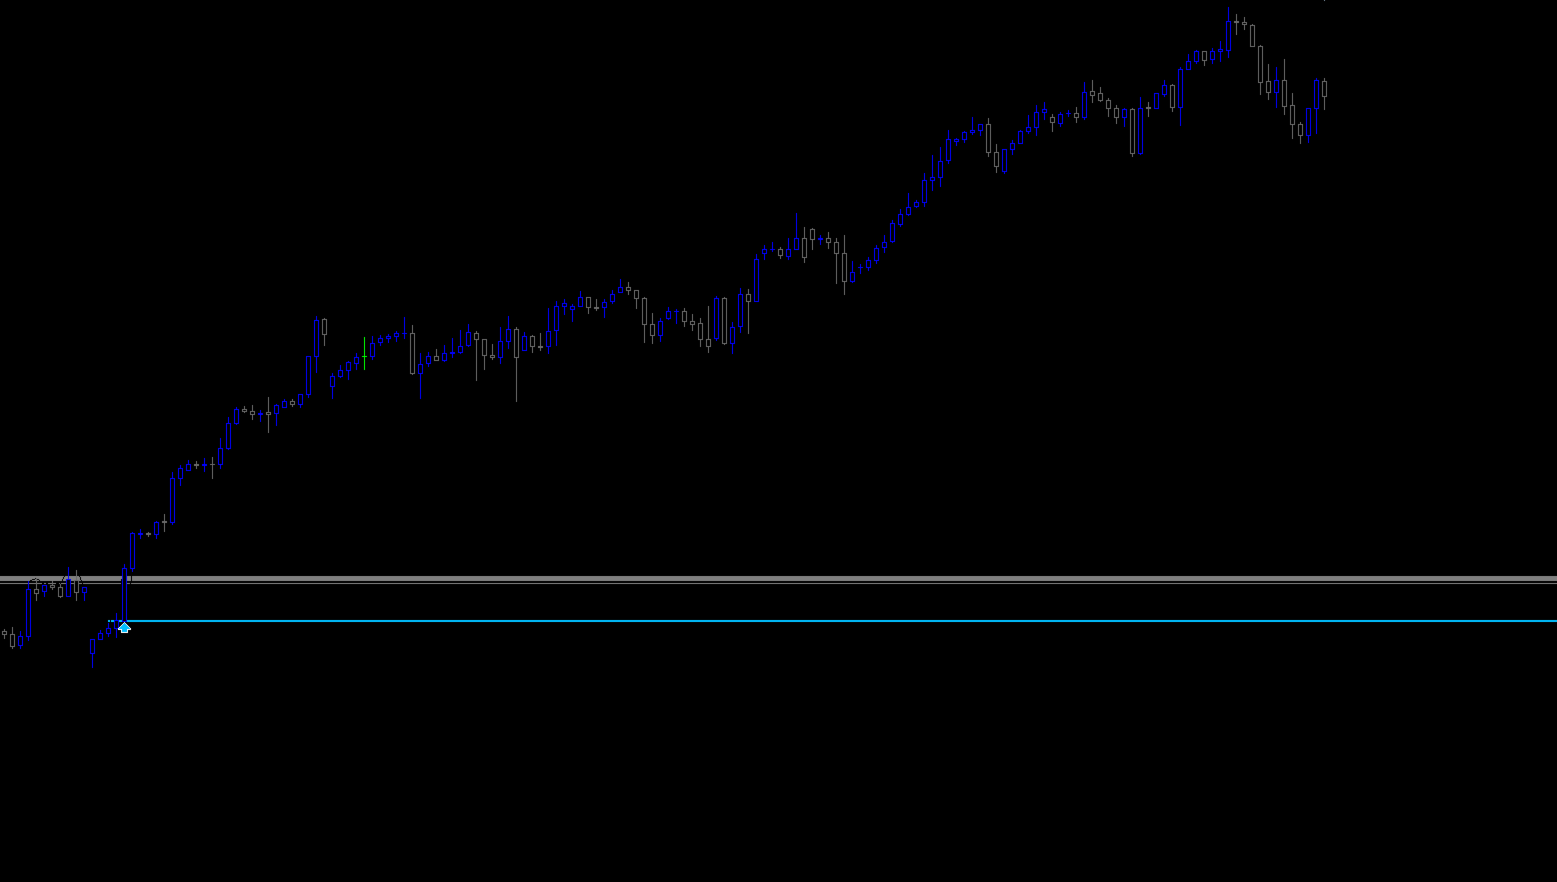
Develop an indicator based on the analysis of price context, volume, and market structure, with the purpose of identifying and visually representing areas of market interest on the chart.

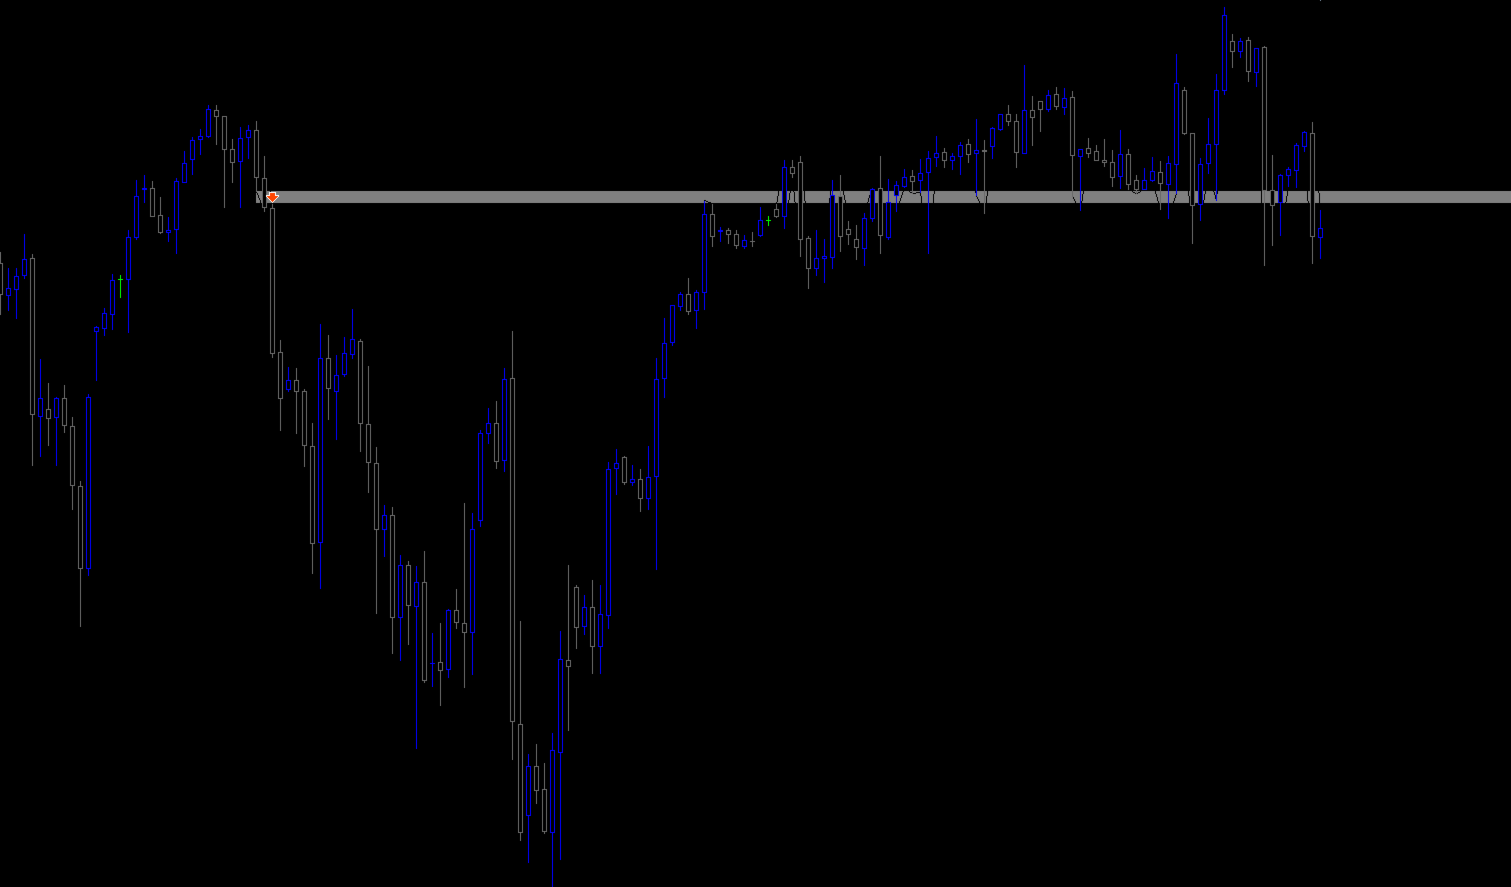
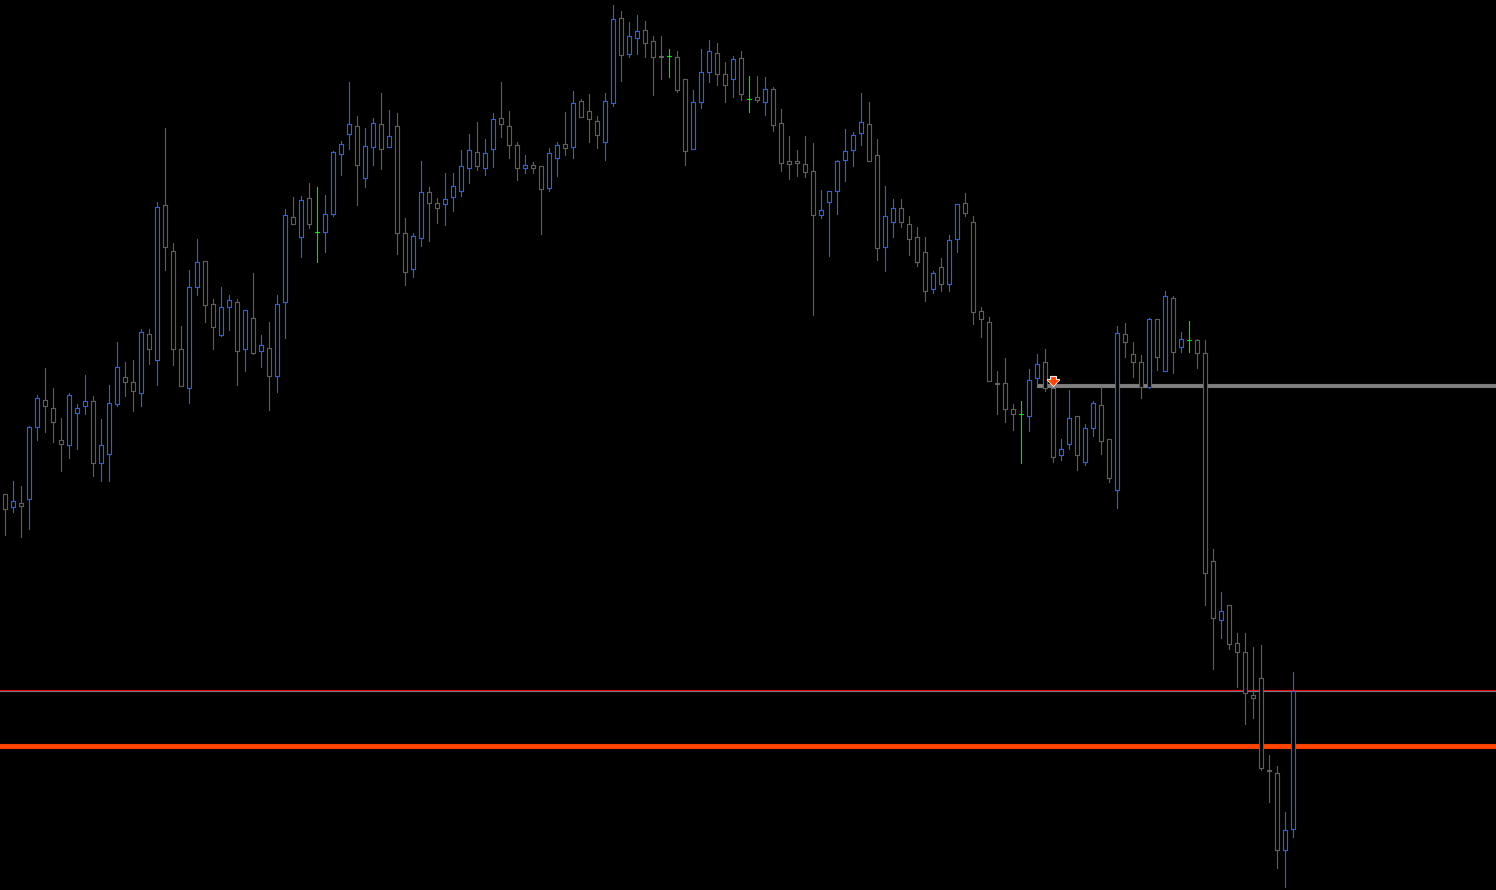
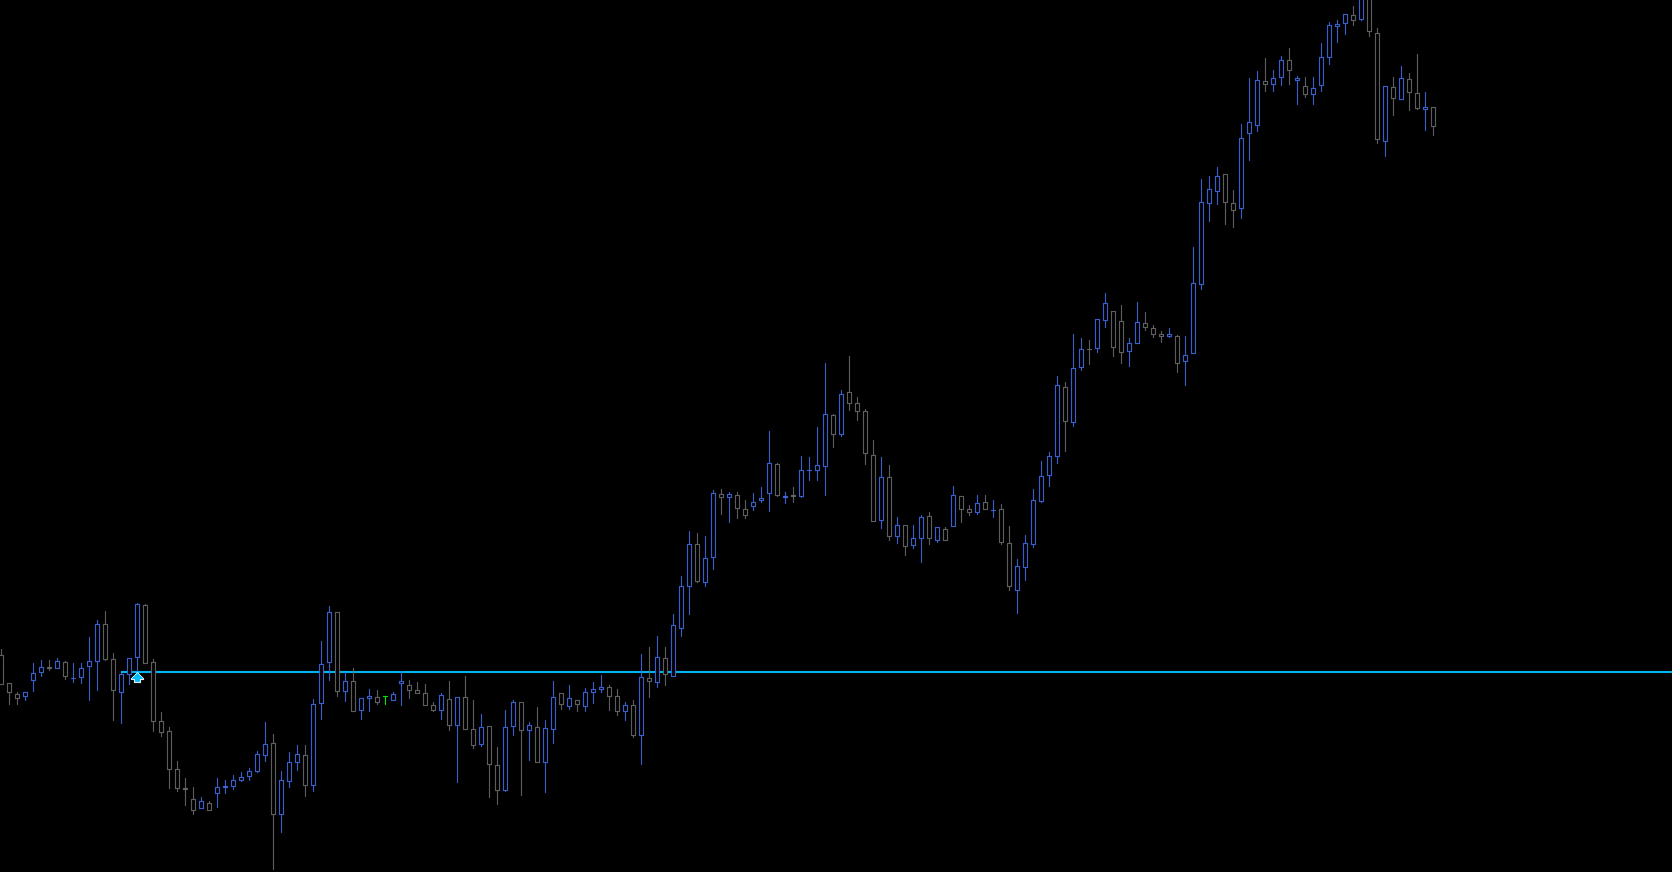
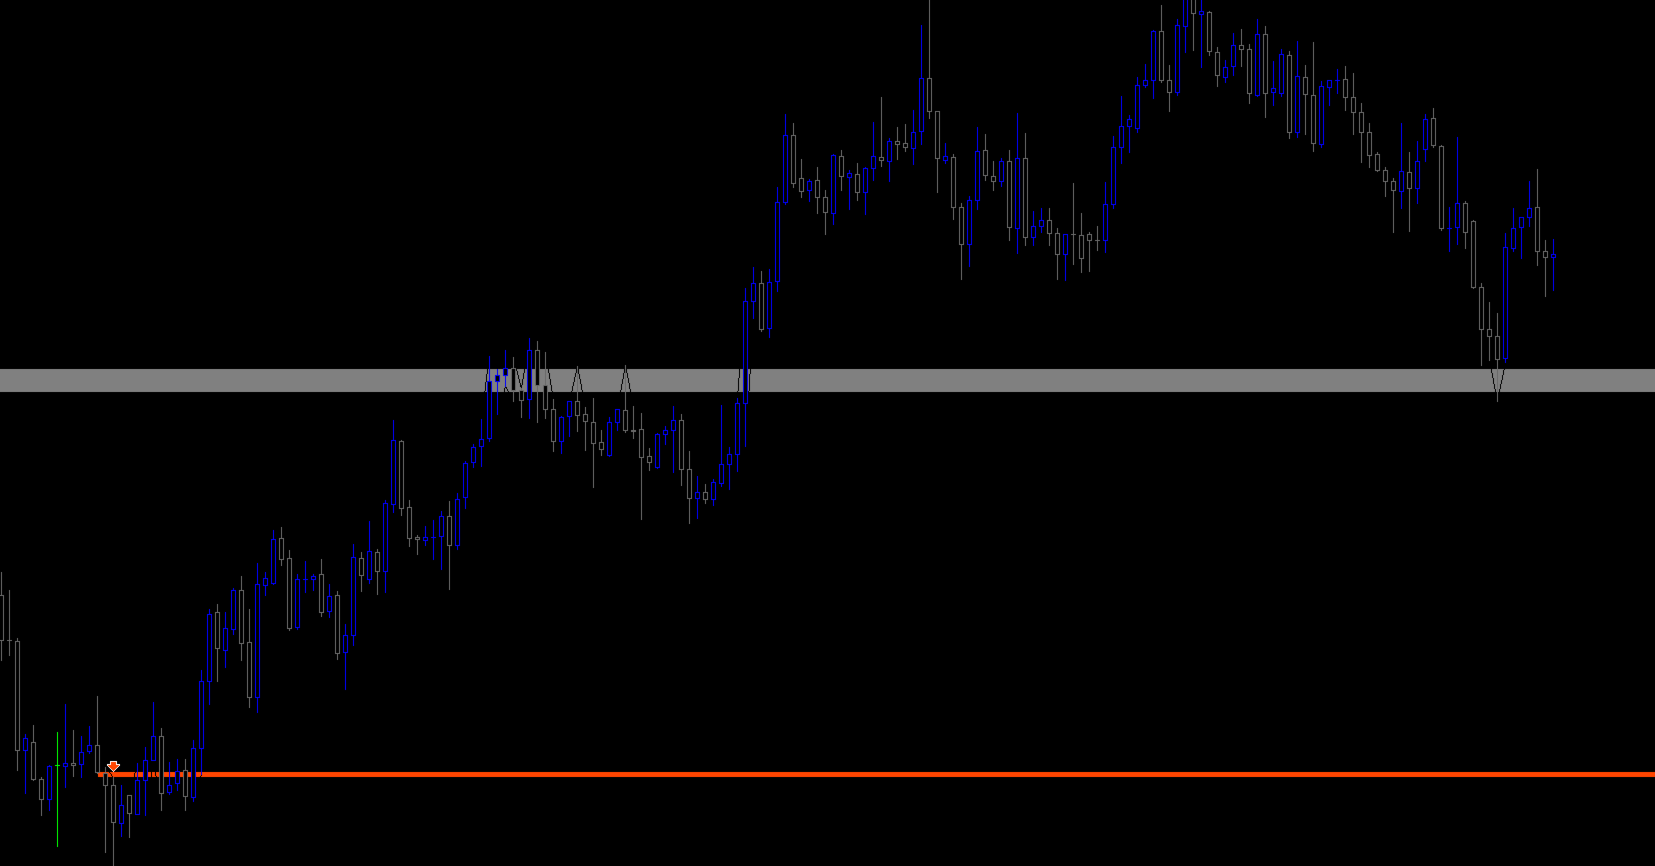
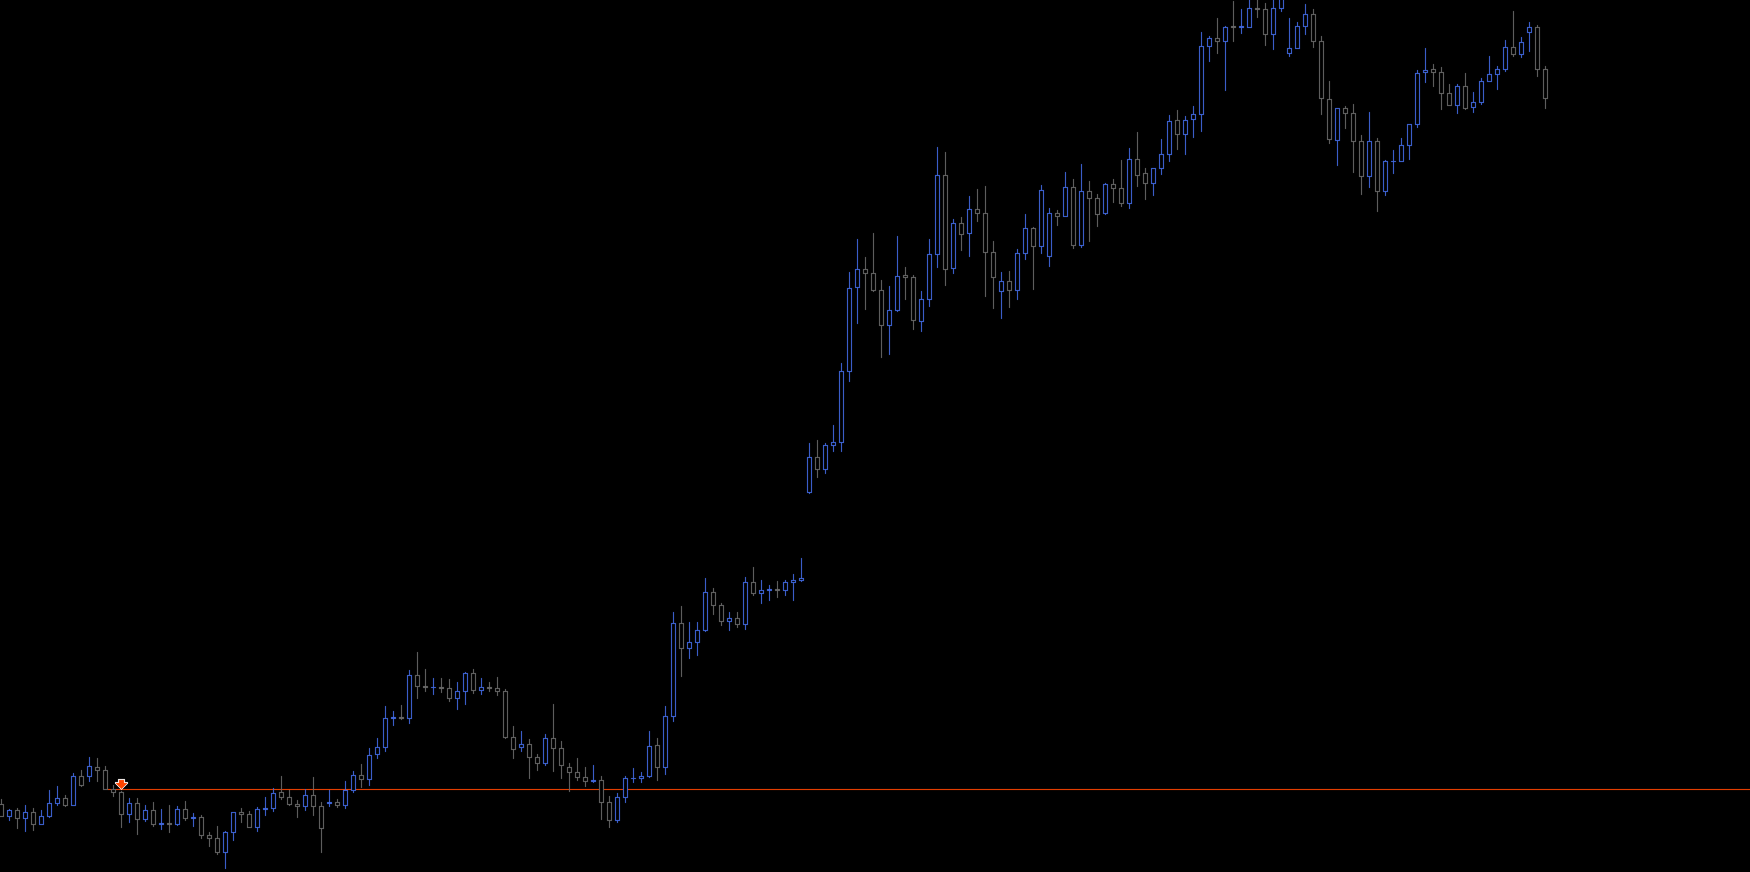
The system should use lines, zones, and arrow markers to highlight relevant areas of the market, including situations where a significant buying or selling effort has occurred, providing the user with a clear visual representation of these regions.

The indicator should use gray, blue, and orange colors. However, it is essential to establish that the colors do not represent market direction, buying, or selling. They should be used exclusively to differentiate and highlight regions and levels of interest identified by the indicator.

The system should incorporate concepts of SMC — Smart Money Concepts, combined with the analysis of price behavior, volume, and market structure, with the objective of providing a contextual view of regions that may be relevant for further analysis.

The arrows should represent points or regions where the indicator has identified characteristics associated with significant buying or selling effort. They should serve exclusively as visual information and analytical elements and must not automatically determine a trading operation.

It is extremely important that the regions identified by the indicator be individually validated by the user through other studies and analytical tools, taking the overall market context into consideration before making any trading decision.

The indicator must not function as an automatic buy or sell trigger. Its purpose is solely to provide visual information, areas of interest, and market context, allowing the user to conduct their own analysis and make their own decisions.

Any practical use of the indicator must strictly follow proper risk management principles, considering that no region identified by the system should be interpreted independently as a guarantee of continuation, reversal, or positive results.

The ultimate goal is to create a professional, visually organized, and technically consistent indicator capable of assisting the user in identifying relevant market regions while maintaining a clear separation between market analysis, contextual identification, and trading decision-making.

おすすめのプロダクト
WAPV Weis Wave Chart Forex
Eduardo Da Costa Custodio Santos
The Weis Wave Chart Forex for MT5 is a Price and Volume indicator. The Price and Volume reading was widely disseminated through Richard Demille Wyckoff based on the three laws created by him: Supply and Demand, Cause and Effect and Effort vs. Result. In 1900 R.Wyckoff already used the wave chart in his analyses. Many years later, around 1990, David Weis Automated R. Wyckoff's wave chart and today we bring you the evolution of David Weis' wave chart. It shows the amount of Volume and the amount o
Based on the trading model/strategy/system of gold double-position hedging and arbitrage launched by Goodtrade Brokers, problems encountered in daily operations: 1. Account B immediately places an order immediately following account A. 2: After account A places an order, account B will automatically copy the stop loss and take profit. 3: Account A closes the position of Account B and closes the position at the same time. 4: When account B closes the position, account A also closes the position.
VWAP Z-Score (Rolling) Positive values indicate price trading above VWAP, while negative values indicate price trading below VWAP. Typical Use Cases Mean-reversion strategies Overbought / oversold detection VWAP-based statistical analysis Confirmation tool for discretionary or algorithmic trading Risk-aware trade entries and exits Notes Uses tick volume for VWAP weighting (standard for Forex symbols). The indicator does not repaint. Designed for analytical and decision-support purposes only.
Weis Wave Double Side
Eduardo Da Costa Custodio Santos
The Weis Wave Bouble Side Indicator for MT5 is part of the toolkit (Wyckoff Academy Wave Market) The Weis Wave Bouble side Indicator for MT5 was created based on the already established Weis Wave created by David Weis. The Weis Wave Double Side indicator reads the market in waves as it was done by R. Wyckoff in 1900. It helps in the identification of effort x result, cause and effect, and Supply and demand Its differential is that it can be used below the zero axis, further improving plus operat
Gold M3 Doji Breakout H1 Gold M3 Doji Breakout H1 is an automated MetaTrader 5 Expert Advisor designed to identify a fixed M3 compression structure inside a closed H1 candle and evaluate a breakout during the following H1 trading window. This product is designed for Gold symbols. Its default absolute-price distances are not intended for Forex pairs, cryptocurrencies or stock indices. Position management The EA divides the position into three stages: - Stage 1 closes at the configured first
Do you use volume in your reading of the market? Certainly many traders use it, and do not imagine operating without it. The Color Histogram Volume Set indicator allows the user to choose the value that he considers interesting to monitor. When you pass this you will have visual confirmation and if you want you will also have the audible alert that is given by the indicator. Of course, there are other ways to try to find a high volume, such as assessing whether the volume is above av
Daily & Composite Volume Profile   This is a professional-grade market profile tool designed for MetaTrader 5. It utilizes a   Dual-Profile System   to visualize supply, demand, and liquidity concentrations. Key Features Left Side: Daily Session Profiles Automatically identifies the start and end of every trading day. Generates a unique Volume Profile for each individual day. Allows you to see how value migrated from yesterday to today (e.g., Is today's volume higher or lower than yesterday?).
DELTA MSNR FLEX Intelligent MSNR Structure Analysis & Key Level Detection — MetaTrader 5 DELTA MSNR FLEX is a professional indicator designed to analyze price structure and identify important MSNR levels directly on the MetaTrader 5 chart. Its objective is simple: transform significant market reactions into clearly identifiable levels, helping traders improve their market analysis and decision-making process. AUTOMATIC & MANUAL DETECTION DELTA MSNR FLEX provides a flexible approach to market
The   Visual Volatility Clustering   indicator clusters the market based on volatility. The indicator does not redraw and gives accurate data, does not use closing prices. Uses the opening prices or the highs or lows of the previous completed bar. Therefore, all information will be clear and unambiguous. The essence of the indicator is to divide the price market into certain areas according to a similar type of volatility. This can be done in any way. In this example, the indicator is configure
MTF VWAP Indicator - Quick Overview   This indicator shows you where institutional money is flowing across multiple timeframes using Volume Weighted Average Price (VWAP) to identify high-probability trading zones. New version has VWAP bands plotting capability if user enabled and display panel (whose background changes colour on confluence) can be toggled on/off.      What It Actually Does:     1. Tracks Smart Money Levels: - Shows Daily, Weekly, and Monthly VWAP lines where big players (banks,
Poc volume honeyflow
Ali Abdalrasool Ai-sayyd Sobai
POC Highlighter - Volume Profile Indicator This indicator displays the Volume Profile and clearly marks the Point of Control (POC) with a prominent yellow horizontal line. The POC represents the price level with the highest traded volume within the visible chart range or selected period. Key Features: - Automatic calculation and display of Volume Profile histogram at the right side of the chart. - Highlights the POC level with a customizable yellow line (default: solid yellow). - Adjustable p
FX-AIEA Smart Supply and Demand Zone Identification Indicator (Supply and Demand Indicators MT5) Version: 2.51 | Compatible Platform: MetaTrader 5   Why do trades need supply and demand zones? Supply and demand zones are the core manifestation of institutional order flow, reflecting real buying and selling power more accurately than traditional support and resistance. However, manual drawing is not only time-consuming but also highly subjective and prone to missing key areas. FX-AIEA Supply-De
ボリュームプロファイルマルチモード:インジケーターのやり方ではなく、あなた自身のやり方でボリュームを分析しましょう。 ほとんどのボリュームプロファイル指標は、トレーダーをあらかじめ定義された分析範囲に限定します。しかし、市場は固定されたテンプレート内で動くわけではありません。なぜあなたの分析もそうあるべきなのでしょうか? ボリュームプロファイルマルチモードを 使えば、ボリューム分析の場所、タイミング、方法を自由に決定できます。市場構造の分析、取引セッションのプロファイリング、上位時間軸のアクティビティの監視、あるいは進行中のオークションの追跡など、どのような目的であれ、このインジケーターはあなたの取引スタイルに合わせて調整されるため、あなたがインジケーターに合わせる必要はありません。 直感的なワークフローを求める初心者から、柔軟性を重視するプロフェッショナルまで、あらゆるユーザー向けに設計されたボリュームプロファイルマルチモードは、4つの強力なプロファイリング手法を1つの高度にインタラクティブでカスタマイズ可能なトレーディングツールに統合しています。 4つの強力なプロファイリングモード
Weis Wave Double Side Alert
Eduardo Da Costa Custodio Santos
The Weis Wave Bouble Side Indicator for MT5 is part of the toolkit (Wyckoff Academy Wave Market) The Weis Wave Bouble side Indicator for MT5 was created based on the already established Weis Wave created by David Weis. The Weis Wave Double Side indicator reads the market in waves as R. Wyckoff did in 1900. It helps in the identification of effort x result, cause and effect, and Supply and demand Its differential is that it can be used below the zero axis and has a breakout alert showing Who is s
Master HMA
Leonel Alberto Jose Quintana
MetaTrader 5 用 Master HMA Master HMA は、MetaTrader 5 向けに開発されたテクニカルインジケーターで、複数の Hull Moving Average の計算を1つのビジュアル構造に統合し、価格の方向性、傾き、値動きの状態を分析するために設計されています。 このインジケーターは Fast、Main、Slow の3つの HMA 期間を使用します。これらのラインの関係を見ることで、値動きの構造変化を確認し、市場のさまざまな局面を追跡できます。 Main HMA は、システムが判定した状態に応じて異なる色で表示されます。また、Fast HMA と Slow HMA の関係によって形成されるクラウドを表示することもできます。 構造分析 Master HMA は、移動平均線の挙動に関するさまざまな特徴を分析します。これには、傾き、HMA 間の距離、収縮、拡大、加速、勢いの低下、クラウド幅の変化などが含まれます。 これらの情報を組み合わせることで、現在の値動きの構造を視覚的に把握できます。 Master Score このインジケーターには Master
Theory VWAP is a volume-weighted moving average, bringing greater relevance to prices. The VWAP base calculation follows the classic formula described in Investopedia ( https://www.investopedia.com/terms/v/vwap.asp ). VWAP = sum(typical price[i]*volume[i]) / sum(volume[i]) Functionalities Orion Intraday VWAP innovates by allowing the user to choose between the conventional Daily, Weekly and Monthly periods, also having the option of calculating the Intraday indicator, as used in other platform
New York AM Session Profile NY AM Session Profiling Framework | Non-Repainting | Real-Time | FX & Index Presets | MT4 Version Available Full Setup Guide & Strategy Playbook: https://www.mql5.com/en/blogs/post/771380 MT4 Version: https://www.mql5.com/en/market/product/180946 Indicator Overview The New York AM Session Profile Framework is a professional market-structure visualization tool designed for traders who study liquidity, session behaviour, and institutional price delivery. Instead of
LuoMo Volume & Price Structure 8.98 A multi-function chart indicator for   MetaTrader 4 and MetaTrader 5 , designed to display key volume, volatility, sentiment, and price-structure information directly on the main chart. Main Features Volume and price-based Support & Resistance Volume spike and exhaustion signals ATR volatility expansion alerts Volume Profile with HVN and LVN Bullish and bearish sentiment distribution Developing or fixed POC VAH and VAL levels Supply and Demand zones Volume-wei
White Weis Volume This indicator shows the sum of the volume in each wave, bulish or bearish, as idealized by David Weis , but it brings an important addition , which is the marking of the bar with the highest volume of the wave (White Bar)! In coding the indicator, it was sought to optimize the code to require minimal processing during use and not to overload mt5. The indicator can be used for pre-trading analysis and study, where the trader analyzes possible points of support and resistance
Volume Footprint & Heatmap Indicator This indicator combines Volume Footprint and Heatmap visualization, inspired by the Order Flow and Heatmap concepts found in Bookmap. Unlike futures markets, the Forex market does not provide real exchange-traded volume data. Instead, it only offers Tick Volume . This indicator is designed to simulate Bookmap-style market visualization as closely as possible using the available Tick Volume data. Because the indicator relies on Tick Volume, the quality and acc
Heiken Ashi Stacked Pro is a chart overlay indicator that combines smooth Heiken Ashi visual trend candles, a real-time bar completion timer, and an on-hover crosshair HUD for instant price and wick-to-body ratio diagnostics. Marketplace Description Overview Heiken Ashi Stacked Pro upgrades standard Heiken Ashi candle visuals with an interactive HUD. Designed for trend followers and price action traders, it filters out market noise using colored candles while supplying precise candle metric read
How it works –   Base-departure detection — algorithmically finds consolidation bases (overlapping range with compressed volatility) followed by displacement departures. Patterns: Drop-Base-Rally, Rally-Base-Drop, Rally-Base-Rally, Drop-Base-Drop — detected structurally, not by candle names. –   Strength score (0–100) — from departure velocity, time-at-base, freshness (each revisit decays the score), higher-timeframe confluence and origin volume. –   Lifecycle — Fresh, Tested (decaying), Broken
FREE
Each VolumeProfile holds: The price range for a given period Buy/sell volume for each price level Calculated POC, VAH, VAL, Delta, and Imbalance Indicator Logic Summary Divide data by timeframe (e.g., one H1 profile per hour). Aggregate volumes for each price level. Separate buy and sell volumes using tick or trade direction. Compute Delta (Buy − Sell) and Imbalance (dominance ≥70%). Detect POC, VAH, VAL to outline the Value Area. Draw graphical profiles beside price candles using color-co
PropGuardian Risk Manager is a utility that watches your account in real time and enforces the hard risk rules that disqualify traders from prop-firm challenges and funded accounts. It does not open trades of its own. It sits on one chart and guards the entire account, whatever you or your other Expert Advisors are doing. One bad day, one oversized lot, or one forgotten position is enough to fail an objective. PropGuardian acts the instant a limit is reached: it closes every position, deletes p

TPO Profile MT5
Kyra Nickaline Watson-gordon
Definition : TPO is a Time Price Opportunity. Instead of using bars or candles with an Open, High, Low, and Close price, each "bar" in a Market Profile is represented by horizontal bars against the price It is called Market Profile terminology. In other words time-price-opportunity (TPO) profiles are histograms of how much time was spent at each price within the span of the profile. By using a TPO chart, you are able to analyze the amount of trading activity, based on time, for each price level
EA CAICAI 2MV FLOW FREQUENCY PRO Turn market reading into AUTOMATIC PROFIT EXECUTION Forex · Futures · Stocks · Cryptocurrencies Platform: MetaTrader 5 DOMINATE THE MARKET WITH SURGICAL PRECISION Stop guessing. Stop hesitating. The EA Caicai 2MV Flow Frequency Pro executes exactly what most traders fail to do: act at the right moment — without emotion, without delay, and without human error. Based on the powerful 2MV methodology, this robot identifies in real-time: ️ Direction

Percent Levels
Cinthia Regina De Moraes
Indicador tipo 2mv frequência mostra os níveis percentuais no mercado financeiro que tendem a ser zonas realmente importantes para os traders. Observem que o preço segue um fluxo e uma frequência que se enquadram em canais percentuais de movimento,  tradicionalmente traçados por níveis Fibonacci. O indicador LevelsPercent traça linhas em pontos específicos de percentual configurados pelo usuário e "pode" anteceder possíveis níveis de SUPORTE e RESISTÊNCIA. A leitura do mercado e a identificação
Adaptive Supply Demand Volume Profile Adaptive Supply Demand Volume Profile is a MetaTrader 5 indicator that combines pivot-based dynamic lookback, volume-by-price analysis and automatic supply and demand zone detection. Instead of using a fixed historical window only, the indicator can automatically adjust its analysis range according to the latest major pivot. Volume is then distributed across price levels to identify low-volume areas that may act as potential support, resistance, supply or
Supply and Demand Indicator + FREE Currency Strength Meter ADD-ON Looking for a powerful tool that can help you identify the most reactive zones in the forex market? Our supply and demand indicator for MetaTrader 4 and 5 is exactly what you need. With its advanced algorithms and real-time analysis, this indicator helps traders of all experience levels make informed trading decisions. The supply and demand indicator is a cutting-edge tool that helps traders identify areas where buyers and sellers
VWAP + Volume Profile Combined Indicator FREE Launch Offer OVERVIEW Professional combination of VWAP (Volume Weighted Average Price)  and Volume Profile in a single MT5 indicator. This powerful tool  combines two of the most respected institutional trading tools  into one seamless display. KEY FEATURES 1. VWAP with 6 calculation modes 2. Volume Profile with Value Area analysis 3. Point of Control identification 4. Standard deviation bands 5. Dynamic color changing 6. Separate buy/sell vol
FREE
このプロダクトを購入した人は以下も購入しています
Классификатор силы тренда. Показания на истории не меняет. Изменяется классификация только незакрытого бара. По идее подобен полной системе ASCTrend, сигнальный модуль которой, точнее его аппроксимация в несколько "урезанном" виде, есть в свободном доступе, а также в терминале как сигнальный индикатор SilverTrend . Точной копией системы ASCTrend не является. Работает на всех инструментах и всех временных диапазонах. Индикатор использует несколько некоррелируемых между собой алгоритмов для класси
This indicator is based on the crossing of two Moving Average with the RSI It is intended for scalpers Specially designed for Boom and Crash syhtetic indices from Binary.com/Deriv.com It is easy to use and intuitive. We recommend its use on M1 and is equipped with three types of notification Email alert Sound notification Push notification these parameters can be activated and deactivated.
This strategy focuses on identifying and following clear market trends by filtering out noise and short-term fluctuations. Using advanced algorithms, it highlights significant upward and downward movements, enabling traders to make data-driven decisions. The indicator is designed for simplicity and precision, ideal for traders who prefer a systematic approach to trend trading. Whether you're a beginner or an experienced trader, this tool helps you stay aligned with the dominant market direction
مؤشر Smart Trend Candles هو أداة فعّالة في منصة MetaTrader 4، تجمع بين عناصر تحليل فني متعددة لتحديد اتجاهات السوق وقياس قوة المشترين والبائعين. يوفر هذا المؤشر متعدد الاستخدامات إشارات مرئية واضحة تُحسّن قرارات التداول الخاصة بك. الميزات الرئيسية 1. تحديد الاتجاه يستخدم شموع Heikin-Ashi المعدلة (اختياري) لتصفية ضوضاء السوق يتضمن متوسطًا متحركًا (فترة قابلة للتكوين) لتأكيد الاتجاه تنفيذ مؤشر القوة النسبية لقياس الزخم 2. قياس القوة تشير الشموع المرمزة بالألوان إلى شدة ضغط الشراء/البيع تحليل الحج
END FLOW MOMENTUM  Capital Flow Analysis with a Geometric Approach Overview End Flow Momentum   is a technical indicator that blends volume, price, and volatility analysis into a visual tool. Designed for traders seeking an alternative capital flow analysis tool. Key Features 1. Mathematical Foundation Proprietary Calculation Model:   Uses a mathematical core that serves as a dynamic central reference point. Volatility-Adaptive Scaling:   Utilizes the asset's inherent volatility as the primary
FarOne Engine Gann Magnet MTF MT5 – マルチタイムフレーム機関投資家レベル 概要 FarOne Engine Gann Magnet は、ガン50%理論に基づいて主要な機関投資家レベルを表示するプロフェッショナルなマルチタイムフレームインジケーターです。 M1からD1までの7つの時間足において、強力な買いゾーン(Buy Zone)と売りゾーン(Sell Zone)を特定するのに役立ちます。 主な特徴 マルチタイムフレーム分析:M1、M5、M15、M30、H1、H4、D1 を1つのチャートに表示 自動レベル計算:High、Low、Buy Zone、Sell Zone を自動表示 スマートダッシュボード:各時間足の状態をリアルタイム表示 — MAGNET、BUY ZONE、SELL ZONE ヒットカウンター:価格がBuy/Sellゾーンに入った回数を時間足ごとに記録 クリーンなビジュアル表示:ライン、ゾーン、価格ラベルを自由にカスタマイズ可能 リペイントなし:固定ルックバック期間に基づいて計算 軽量設計:すべての時間足を有効に
TOPTICK SMC 高度なスマートマネーコンセプト(SMC)トレーディングインジケーター TOPTICK SMC は、市場構造、機関投資家の注文フロー、流動性ゾーン、高確率の取引機会を1つのチャート上で分析できるよう設計された、プロフェッショナル向け Smart Money Concepts(SMC) インジケーターです。 このインジケーターは複数のSMCツールを1つの分析環境に統合し、市場構造の変化、Order Blocks、Fair Value Gaps(FVG)、Premium/Discountゾーン、上位時間足の重要レベル、およびフィボナッチ・リトレースメントを簡単に確認できます。 主な機能 市場構造分析     •    内部 Break of Structure(BoS)     •    内部 Change of Character(CHoCH)     •    外部 Break of Structure     •    外部 Change of Character Smart Money Concepts     •    Order Block の自動検出  
Dynasty SMC/ICT Terminal — v3.0 "Neon-Ops Edition" An all-in-one Smart Money Concepts / ICT dashboard for MetaTrader 5. It's an indicator, not an auto-trading EA — it never places, modifies, or closes real orders. It scans price action for Order Blocks, Fair Value Gaps, market structure, harmonic patterns, and multi-timeframe momentum, blends everything into one calibratable Master Signal, and — if enabled — builds a fully automated on-chart trade plan with entry, stop loss, three take-profit ta
この製品は 2026 年の市場向けに更新され、最新の MT5 ビルドに最適化されています。 価格更新のお知らせ: Smart Trend Trading System は現在 $99 で提供されています。 次の 30 件の購入 後、価格は $199 に上がります。 特別オファー: Smart Trend Trading System を購入後、私にプライベートメッセージを送ることで、 Smart Universal EA を無料 で受け取り、Smart Trend のシグナルを自動売買に変えることができます。 Smart Trend Trading System は、リペイントなし、再描画なし、遅延なしの完全なトレーディングシステムです。よりクリーンなシグナル、より明確なトレンド方向、そしてより整理された取引方法を求めるトレーダー向けに作られています。 Learn Smart Trend Trading System Everything you need to learn, install, and use the product is available here: Online
Trend Sniper X
Sarvarbek Abduvoxobov
4.85 (26)
Trend Sniper X は、トレードの方向性と潜在的な反転ポイントを明確かつ正確に特定するのに役立つ、MetaTrader 5 用のマルチタイムフレーム・トレンドフォロー指標です。 MT4用: https://www.mql5.com/en/market/product/193245 価格情報: 現在の価格はプロモーション価格であり、今後のアップデートや新機能のリリースに伴い変更される場合があります。 ボーナス特典: このインジケーター用の無料自動売買アシスタントEAを入手するには、購入後に an 著者(開発者)へメッセージをお送りください。 Code2Profit チャンネル マルチタイムフレーム分析で相場をマスターしよう! Trend Sniper X で勝率を最大化する方法:重要なルールとセッションのコツ 技術仕様 プラットフォーム MetaTrader 5 インジケータータイプ マルチタイムフレーム・トレンドインジケーター 操作タイムフレーム あらゆるチャートタイムフレームに対応。個別に選択可能な上位タイムフレーム (M1–MN1) を搭載 主要銘柄 FX、ゴールド (X
まず正直に言いましょう。 どんなインジケーターも、それ単体であなたを利益化させることはできません。もしそう言う人がいるなら、それは夢を売っているだけです。完璧な売買シグナル(矢印)を表示するインジケーターは、いくらでも“完璧に見せる”ことができます。正しい過去の区間を拡大して、勝ちトレードだけを切り取ればいいだけです。私たちはそれをしません。 SMC Intraday Formula はツールです。 市場構造を読み取り、最も高い確率の価格ゾーンを特定し、今この瞬間のスマートマネーの痕跡をシンプルな言葉で正確に示します。最終判断はあなたが行います。トレードを実行するのもあなたです。しかし今は「希望」ではなく「精度」でエントリーできます。 私たちはこのインジケーターを、ゴールド(XAUUSD)および主要FX通貨ペアで約3年間、日々のスキャルピングに使用してきました。M1、M5、M15、M30の主要ツールです。これは未来を予測しようとするのではなく、今まさに形成されている高確率セットアップを示し、その理由を説明します。 他のすべてのインジケーターと何が違うのか? ほとんどのトレーディングイ
Zoryk Gold
Reda El Koutbane
5 (7)
割引は 24 時間後に終了します — 次の価格は$ 69 ZORYK — MetaTrader 5専用 XAUUSDシグナル・トレードプランニングシステム このような経験はありませんか。 ゴールドを分析し、エントリーを待ち、ようやくポジションを持った直後に価格が逆方向へ動く。 早すぎる決済をしてしまったり、Stop Lossを動かしたり、数秒迷っている間にチャンスを逃したりする。 その後、相場は自分が最初に予想していた方向へ進み、目標へ到達する。 問題は常に方向判断ではありません。 本当の問題は、明確な計画がなかったことです。 どこでエントリーすべきか。 どこでトレードの前提が無効になるのか。 近い利益を確保すべきか、より大きな値動きを待つべきか。 現在のsetupが本当に強いのか、それとも無理にトレードを探しているだけなのか。 ゴールドは非常に速く動きます。 正しい分析でも、明確なプランがなければ数秒で悪い判断に変わることがあります。 ZORYKは、その問題を解決するために開発されました。 ZORYKとは ZORYKは、MetaTrader 5とXAU
Neuro Poseidon is a new indicator by Daria Rezueva. It combines precise trading signals with adaptive TP/SL levels - creating best possible trades as a result! Message me and get  Neuro Poseidon Assistant  as a gift to automize your trading process! What makes it stand out? 1. Proven profitability on all assets and timeframes 2. Only confirmed BUY and SELL signals present on the chart 3. Adaptive TP & SL levels generated by the software for each trade 4. Easy to understand - suitable for al
SuperScalp Pro
Van Minh Nguyen
4.63 (32)
SuperScalp Pro - Professional Multi-Layer Confluence Scalping System SuperScalp Proは、クラシックなSupertrendに複数のインテリジェントな確認フィルターを追加した、高度なスキャルピングインジケーターです。より高い確率が期待できるBuy/Sellの取引機会を特定し、ダマシのシグナルを大幅に減らすことをサポートします。 明確なBuyとSellの矢印がチャート上に直接表示され、ATRに基づくStop LossとTake Profitのレベルがリアルタイムで自動計算されます。 購入後、設定方法や推奨設定についてのサポートが必要な場合は、私にご連絡ください。 SuperScalp Pro Auto Traderを使用して、シグナルを簡単に自動化できます: [Auto Trader] 推奨設定ファイルをダウンロード: [Set File] 完全なドキュメントは製品ブログでご覧いただけます: [User Guide] 最新情報を受け取るには公式チャンネルに参加してください: [Official Channel]
Welcome to ENTRY IN THE ZONE AND SMC MULTI TIMEFRAME Entry In The Zone and SMC Multi Timeframe is a real-time market analysis tool based on Smart Money Concepts (SMC), designed to analyze market structure, price direction, and key trading zones. It supports both Single-Timeframe Analysis and Multi-Timeframe Analysis, providing a clearer view of the overall market structure across multiple timeframes, with real-time BUY / SELL signals that do not repaint. It is designed to help filter trading opp
UNIX Scalper — Gold Scalping Indicator for MetaTrader 5 UNIX Scalper is a focused Gold scalping indicator designed primarily for XAUUSD on M1, M2, M3, M5, M10 and M15. It gives the trader a clear BUY, SELL or WAIT decision together with the complete trade plan: Entry, Stop Loss, TP1 and TP2 . The concept is simple: wait for the signal, follow the levels, move the Stop Loss to Break Even after TP1, and trade with discipline. Learn UNIX Scalper Everything you need to learn and use the product is
ATSTRONG PRO:市場構造&ブレイクアウトインジケーター ブレイクアウト検出エンジン | 5つの動的TPターゲット | ライブダッシュボードパネル | リペイントなし 導入価格 現在の価格: $59 — 10回の販売ごとに価格が$10上昇します。 ATSTRONG PRO は、MetaTrader 5 用に設計された高度なブレイクアウトおよび機関投資家向け市場構造インジケーターです。 高確率のスイングピボットを検出し、クラスター化されたサポートとレジスタンスの蓄積ゾーンを特定し、 リアルタイムで構造の破壊(BOS)と性質の変化(CHoCH)のシグナルを発します。 このインジケーターは、ダイナミックなストップロスと5つの個別のテイクプロフィットレベル(TP1〜TP5)をチャート上に自動的に直接描画します。 リスクリワード予測ボックス、星付けされたシグナル品質の評価、およびリアルタイムのオンチャートパフォーマンス分析ダッシュボードを備えています。 取引に関する注意: これは手動取引および市場分析用のインジケーターです。ローソク足の確定時に明確な視覚的シグナル、レベル、アラー
GoldenX Entryは、MT5向けのインジケーターであり、適応型Smart Entry Trendアルゴリズム、シグナルスコアリングシステム、マーケットレジーム検出機能、およびボラティリティフィルターを備えています。各シグナルには、計算されたエントリーレベル、3つのテイクプロフィット(TP1、TP2、TP3)、およびストップロスレベルが含まれます。本インジケーターは、異なる市場環境に適応するために設計された複数の分析レイヤー上に構築されており、マルチレイヤー分析システムと内蔵オプティマイザーおよび統計トラッキングシステムを組み合わせています。リスク・リワード(RR)指標および過去のトレード履歴に基づく定量分析を提供します。 使い始めは簡単です — 選択した時間足でオプティマイザーを実行し、そのままチャート上でインジケーターを使用します。 コア機能 GoldenX Entryは、シグナルエンジンとトレード管理機能、そして過去統計トラッキングを1つのチャートに統合しています: - 内蔵オプティマイザー: オプティマイザーはチャート上でワンクリックで実行できます。200通りのパラメー
M1 SNIPER は使いやすいトレーディングインジケーターシステムです。M1時間足向けに設計された矢印インジケーターです。M1時間足でのスキャルピングのためのスタンドアロンシステムとして、また既存のトレーディングシステムの一部としても使用できます。このトレーディングシステムはM1時間足での取引に特化して設計されていますが、他の時間足でも使用できます。元々、この手法はXAUUSDとBTCUSDの取引用に設計しましたが、他の市場においても役立つと考えています。 インジケーターのシグナルは、トレンドの方向と逆方向に取引できます。インジケーターのシグナルを利用して両方向に取引するのに役立つ特別な取引テクニックをご紹介します。この手法は、特別な動的なサポートとレジスタンスの価格帯を利用することに基づいています。 ご購入後、M1 SNIPER矢印インジケーターをすぐにダウンロードできます。さらに、M1 SNIPERツールのすべてのユーザーに、以下のスクリーンショットに表示されているApollo Dynamic SRインジケーターを無料で提供しています。この2つのインジケーターを組み合わせることで
Gold Entry Sniper – ゴールドスキャルピング&スイングトレード用プロフェッショナル多時間足ATRダッシュボード Gold Entry Sniper は、XAUUSDや他の銘柄向けに正確な 売買シグナル を提供する、MetaTrader 5用の高度なインジケーターです。 ATRトレーリングストップロジック と 多時間足分析ダッシュボード を搭載し、スキャルピングからスイングトレードまで対応します。 主な特徴と利点 多時間足シグナル分析 – M1、M5、M15 のトレンドを同時表示。 ATRベースのトレーリングストップ – ボラティリティに応じて動的に調整。 プロ仕様のチャートダッシュボード – シグナル状況、ATRレベル、回帰線、売買方向を表示。 明確な売買マーカー – 自動矢印とテキストラベル。 エグジットアラートとトレード管理 – 利益確定のための自動検出。 完全カスタマイズ可能 – パネル位置、色、フォント、ATR/回帰設定を調整可能。 ゴールド(XAUUSD)に最適化 – M1〜M15のスキャルピングに最適、FXや指数、暗号資産にも対応。 Gold Entry
この製品は 2026 年の市場向けに更新され、最新の MT5 ビルドに最適化されています。 価格更新のお知らせ: Atomic Analyst は現在 $99 で提供されています。 次の 30 件の購入 後、価格は $199 に上がります。 特別オファー: Atomic Analyst を購入後、私にプライベートメッセージを送ることで、 Smart Universal EA を無料 で受け取り、Atomic Analyst のシグナルを自動売買に変えることができます。 Atomic Analyst は、リペイントなし、再描画なし、遅延なしの Price Action トレーディングインジケーターで、手動取引、シグナルの明確化、EA 自動化のために設計されています。 User manual: settings, inputs and strategy.   &   User Manual PDF . 価格行動、強さ、モメンタム、マルチタイムフレーム方向、高度なフィルターを分析し、トレーダーがノイズを減らし、弱いセットアップを避け、より構造化された取引判断を行えるようにします。 このイ
FiboSniper Pro – Multi-Filter Fibonacci System with Auto SL/TP and Control Panel FiboSniper Proは、動的なFibonacci Envelopesと複数の確認フィルターを組み合わせ、選別されたBuyおよびSellシグナルを生成するテクニカルインジケーターです。FibonacciレベルはMoving AverageとATRを基に計算され、その後ADX、EMA、RSI、ATR、Volume、Time、Candle構造によってフィルタリングされます。インジケーターは、ATRに基づく自動Stop LossおよびTake Profitレベルをチャート上に直接表示し、さらに迅速な調整が可能なインタラクティブControl Panelを提供します。 購入後、推奨設定ファイルと詳細な使用方法については、私にご連絡ください。 Auto Trader Xを使用してFiboSniper Proのシグナルを自動化できます: [Auto Trader X] User GuideとSet Files: [Click her
Reversion King Indicator
Eugen-alexandru Zibileanu
5 (6)
新たな王者が登場 - インジケーター + 注文管理表示(TP1 + TP2 + TP3)+ オプションのTelegramシグナル送信機能付き(無料) (完全なトレード&シグナルシステム) ゴールド向け最高のEA: Gold Slayer このインジケーターには、高度な戦略、カスタマイズ可能な注文管理システム、そしてエンベロープ拡張を組み合わせた平均回帰システムが搭載されています。さらに、RSIなど複数のインテリジェントな確認フィルターによって、高確率の反転エントリーをBUY・SELLシグナルとして検出します。 単にトレードを学ぶだけでなく、複数ポジションを効果的に管理し、過去に利益を出しているオープンポジションで損失トレードをカバーする方法も学べます。 M5向けに構築・最適化されており、流動性が高くシグナルの精度が安定しているBTCUSDとXAUUSDで優れたパフォーマンスを発揮します。 このインジケーターは、ATRを基に自動計算されたエントリー、ストップロス、テイクプロフィットレベルを備えた明確なLong・Shortシグナルを提供するため、リスク管理が最初から組み込まれています。 マ
Gann Made Easy   は、ミスター・ギャンの理論を使用した取引の最良の原則に基づいた、プロフェッショナルで使いやすい外国為替取引システムです。 W・D・ガン。このインジケーターは、ストップロスとテイクプロフィットレベルを含む正確な買いと売りのシグナルを提供します。 PUSH通知を利用して外出先でも取引可能です。 ご購入後、取引方法の説明と優れた追加インジケーターを無料で入手するには、私にご連絡ください! おそらく、ギャンの取引手法についてはすでに何度も聞いたことがあるでしょう。通常、ギャンの理論は初心者のトレーダーだけでなく、すでにある程度の取引経験がある人にとっても非常に複雑なものです。なぜなら、ギャンの取引手法は理論的にはそれほど簡単に適用できるものではないからです。私はその知識を磨き、最良の原則を私の外国為替インジケーターに組み込むために数年を費やしました。 このインジケーターは非常に簡単に適用できます。必要なのは、それをチャートに添付し、簡単な取引推奨事項に従うだけです。このインジケーターは常に市場分析の仕事を行い、取引の機会を探します。適切なエントリーポイントを検
伝説が帰ってきました:Entry Points Pro 10。 MQL5 Marketのトップ3に3年間入り続けた伝説的インジケーターの再始動です。 2つのバージョンで合計589件の高評価レビュー、毎日数千人のトレーダーが実際のトレードに使用し、デモのダウンロードは31,000件以上   MT4+MT5 。 私はこの5年間に寄せられたレビューをすべて読み、約束を並べる代わりに、その答えをバージョン10に組み込みました。1999年から相場に携わり、 誠実さ、自らの評判、そして顧客を大切にする 作者による製品です。 Entry Points Proのエントリーシグナルは、リペイント(再描画)を一切行いません。 そして今回初めて、これは作者の言葉ではなく検証可能な事実になりました。確定シグナルはローソク足の終値確定後にのみ表示され、自動テストで リペイントはゼロ と確認されています(EURUSD、XAUUSD、BTCUSDで2,486,568回の不変条件チェック、違反0件)。検証方法は公開されており、ストラテジーテスターでご自身で再現できます。 ご購入後は、必ずすぐにダイレクトメッセージでご
SR Liquidity は、市場の流動性が集中し、価格が最も強く反応する「隠れたゾーン」を可視化するために設計されたトレーディング指標です。こうした流動性の高いエリアは強力なサポート(支持)およびレジスタンス(抵抗)レベルとして機能し、市場が反転する可能性が最も高いポイントを明確に示してくれます。 単なる一般的なサポートラインやレジスタンスラインを描画するのではなく、「SR Liquidity」は実際の価格変動を分析し、売りと買いの圧力が集中するゾーンを特定します。これらは、市場の真の動きを牽引する「流動性のプール(溜まり場)」そのものです。それらをチャート上に直接可視化することで、価格が実際に反応する前に、その動きを予測することが可能になります。つまり、このインジケーターは価格の方向性が変わる可能性を予測するのです。生のプライスアクションを、市場の重要な水準(転換点となり得るポイント)を示す、明確で実用的なロードマップへと変換してくれます。 このインジケーターは、FX、株価指数、貴金属、仮想通貨など、あらゆる銘柄や時間足で使用可能です。 ご購入後、取引手順や無料の優れた追加インジケ
このインジケーターを購入された方には、以下の特典を 無料 で提供しています: 各トレードを自動で管理し、ストップロスとテイクプロフィットを設定し、戦略ルールに基づいてポジションを決済する補助ツール 「Bomber Utility」 様々な銘柄に合わせたインジケーターの設定ファイル(セットファイル) 「最小リスク」、「バランスリスク」、「待機戦略」 の3つのモードで使用できる Bomber Utility 用の設定ファイル このトレーディング戦略をすぐに導入・設定・開始できる ステップバイステップのビデオマニュアル ご注意: 上記の特典を受け取るには、MQL5のプライベートメッセージシステムを通じて販売者にご連絡ください。 オリジナルのカスタムインジケーター 「Divergence Bomber(ダイバージェンス・ボンバー)」 をご紹介します。これは、MACDのダイバージェンス(乖離)戦略に基づいた 「オールインワン」型のトレーディングシステム です。 このテクニカルインジケーターの主な目的は、価格とMACDインジケーターの間に発生するダイバージェンスを検出 し、将来の価格の動きを示
この製品は 2026 年の市場向けに更新され、最新の MT5 ビルドに最適化されています。 価格更新のお知らせ: Smart Price Action Concepts は現在 $200 で提供されています。 次の 30 件の購入 後、価格は $299 に上がります。 特別オファー: 購入後、私にプライベートメッセージを送ることで、 無料ボーナス + ギフト を受け取ることができます。 まず、このトレーディングツールはリペイントなし、再描画なし、遅延なしのインジケーターであり、プロフェッショナルな取引に最適であることを強調しておきます。 [Online course] ,   [User Manual]  ,  [How to Install]  ,   [PDF] Smart Price Action Concepts Indicator は、初心者から経験豊富なトレーダーまで使える非常に強力なツールです。20 種類以上の便利なインジケーターを 1 つにまとめ、Inner Circle Trader Analysis や Smart Money Concepts Trading S
[User Manual]   ,   [Online Course]   ,   [PDF]  And [DEMO] Axiom Matrix は、MetaTrader 5 用のプロフェッショナルなマルチシンボル・マルチタイムフレーム市場スキャナー兼意思決定ダッシュボードです。 Market Watch をスキャンし、複数の時間足を分析し、複数のエビデンスエンジンを読み取り、最も強いチャンスを比較し、1つのクリーンなマトリックスダッシュボード内で最適な BUY、SELL、WAIT、またはブロック状態を表示します。 私が Axiom Matrix を作った理由は、市場スキャンという重い作業を代わりに行ってくれる1つのツールが欲しかったからです。 RSI だけを確認したくありませんでした。 次に MACD だけ。 次に移動平均線。 次に出来高。 次にボラティリティ。 次にサポートとレジスタンス。 そして、1つのトレードアイデアを作るためだけに、銘柄と時間足を手動で切り替えることもしたくありませんでした。 私は、市場をスキャンし、エビデンスを比較し、最良のチャンスをランク付けし、今最も強い
通貨強さウィザードは、取引を成功させるためのオールインワン ソリューションを提供する非常に強力な指標です。このインジケーターは、複数の時間枠のすべての通貨のデータを使用して、このまたはその外国為替ペアのパワーを計算します。このデータは、使いやすい通貨インデックスと通貨パワーラインの形式で表され、特定の通貨のパワーを確認するために使用できます。 必要なのは、取引したいチャートにインジケーターを接続することだけです。インジケーターは、取引する通貨の実際の強さを示します。このインジケーターは、トレンドに合わせて取引するときに有利に利用できる売買高の圧力の極値も示します。このインジケーターには、フィボナッチに基づく可能なターゲットも表示されます。 このインジケーターは、PUSH 通知を含むあらゆるタイプのアラートを提供します。 購入後ご連絡下さい。私の取引のヒントをあなたと共有し、素晴らしいボーナスインジケーターを無料で提供します! 幸せで有益な取引をお祈りします。
作者のその他のプロダクト
Relevance Zones Indicator — Price Structure and Price Action Concept An indicator designed for Swing Trading analysis , based on price structure, support and resistance, and average price movements , applying the concept of moving averages within a Price Action framework. Its purpose is to identify and highlight, through horizontal lines , price regions where the market has demonstrated relevant behavior throughout its historical movement. These regions are displayed as areas of attention , all
FREE
Trend Tracking Indicator An indicator based on a moving average with dynamic color changes , designed to assist in monitoring price direction and identifying potential changes in trend behavior. Initial studies were conducted on the M5 and M15 timeframes . However, the indicator can also be tested and used on other timeframes according to each user's methodology and analytical objectives. When the indicator confirms a change in the line to green , users can monitor the relevant price regions and
FREE
MACD and Price Structure Confluence Indicator The indicator is based on the principles of the MACD in its formula , combined with price structure, support, and resistance levels identified on the D1 (Daily) timeframe . The regions identified by the system are represented by dashed lines extending across the entire chart , allowing users to visually monitor important levels within the market structure. The system's studies and analysis were primarily conducted using the M30 (30-minute) timeframe
FREE
FAVERO RETURN SYSTEM Reversal Probability System The system was developed to identify market regions where price shows signs of potential exhaustion , combining overbought and oversold conditions with support and resistance levels from higher timeframes . The objective is not to claim that a reversal will necessarily occur, but rather to identify areas where the probability of a change in market direction may be increasing . How It Works The indicator primarily analyzes the following timefra
Indicator Description Opportunity Identification Indicator — Smart Money This indicator was developed to assist in identifying moments when prices may be reaching areas of greater interest , seeking possible signals in market behavior associated with the concept of “smart money” (Smart Money) , widely discussed in financial literature and market studies. The proposal is to create a bridge between technical analysis and fundamental analysis . The indicator uses technical analysis and price behavi
CONFLUENCE AND PROBABILITY INDICATOR Volume • Fibonacci • Pullback • Technical Analysis This indicator was developed with an approach focused on identifying areas of interest in the market , combining different concepts widely used in technical analysis and trading studies. Its purpose is to assist traders in interpreting price behavior through the confluence of information , allowing each user to integrate the indicator into their own analysis system and personal strategies. KEY CONCEPTS ANALYZ
POSITION TRADE AF I present a trading system designed to assist traders in the technical analysis and study of opportunities for Position Trading , using an approach based on the combination of price structure, volume, support, resistance, and overall market context . The indicator was developed as a professional analytical tool , with the objective of automatically identifying relevant areas on the chart where a greater confluence of technical factors may exist, providing traders with regions t
Horizontal lines on the chart alternate between solid and dashed styles, representing areas of interest based on significant highs and lows from different timeframes, creating potential confluence between market structures. The indicator is designed to assist each participant in their own market studies, giving users the flexibility to combine the indicator with their personal trading system and analysis methods . The lines should not be used as standalone entry triggers . Instead, they are inte
Indicator Description This indicator was developed with the purpose of combining the structure of highs and lows from higher timeframes with confluences generated by different technical indicators . Through the use of multiple horizontal lines , the system highlights relevant market regions that can be used for study, monitoring, and analysis of price behavior . The lines are designed to assist in identifying: Market areas of interest; High and low structures from higher timeframes; Areas where
Price Compression Indicator Based on Financial Volume Levels This indicator was developed to identify price compression regions associated with relevant financial volume levels , using horizontal lines on the chart to highlight areas that may present greater market interest. The system monitors price behavior within these regions, considering different possibilities such as continuation, breakouts, rejections, and potential false breakouts . Therefore, the horizontal lines represent areas for st
Indicator Description This indicator monitors overbought and oversold levels , combining technical indicator signals with financial volume analysis in the regions marked on the chart. The system was primarily developed to support Swing Trading and Position Trading , using the H1 timeframe as its main reference. It is designed to help traders analyze areas where price may show changes in behavior, continuation, or loss of momentum. The marked regions should be used as areas for study and monitori
Volatility and Financial Volume Indicator This indicator was developed to assist in analyzing price volatility , identifying periods of band contraction and expansion , together with color changes associated with financial volume behavior. The system highlights regions where a significant increase in volume occurs, allowing traders to observe potential areas of interest for trend continuation or trend reversal studies. The analysis is primarily focused on the M15 and M5 timeframes , allowing use
Professional Support and Resistance Indicator This indicator was developed as a market context study and analysis tool , designed to help identify potentially relevant areas on the chart through the combination of price action, volume, and higher-timeframe market structure . The indicator displays two layers of horizontal dashed lines , positioned at areas considered relevant for analysis. This allows traders to observe different support and resistance zones and evaluate their relationship with
フィルタ:
レビューなし
レビューに返信