Pivot Prof MT4
- インディケータ
- バージョン: 61.0
- アップデート済み: 17 11月 2025
- アクティベーション: 8

Ultimate MTF Support & Resistance - 5 Star Best Seller
New Year Sale - Save $20 (normal price $79)
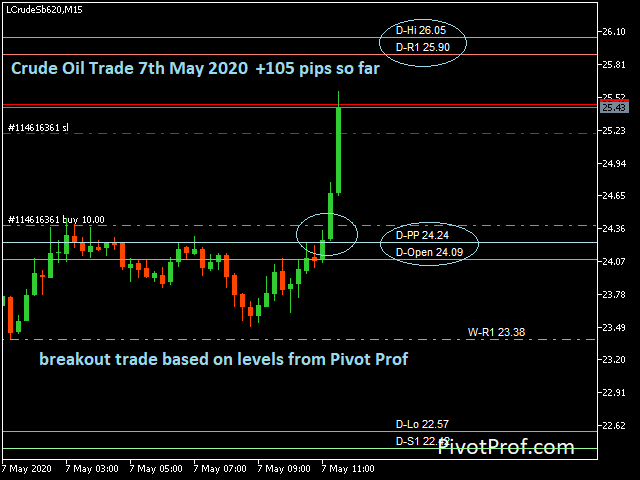
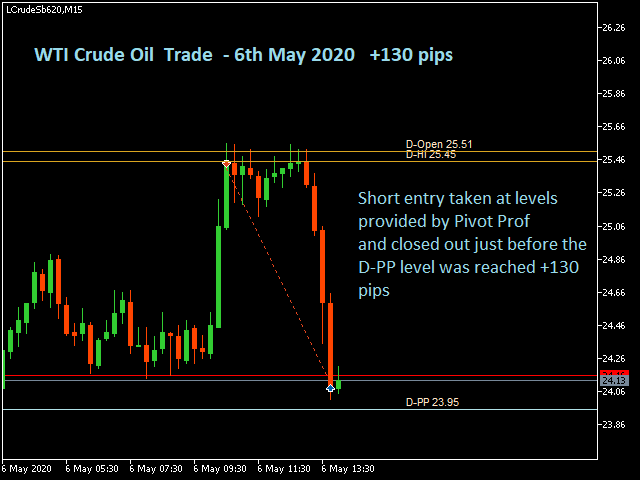
Beginner or Professional our best selling multi-timeframe Pivot Prof will enhance your trading and bring you great trade opportunities with the Support and Resistance levels that professionals use.
Pivot trading is a simple effective method for entering and exiting the market at key levels and has been used by professionals for decades and works on all symbols: Forex, Crypto, Stocks, Indicies etc.
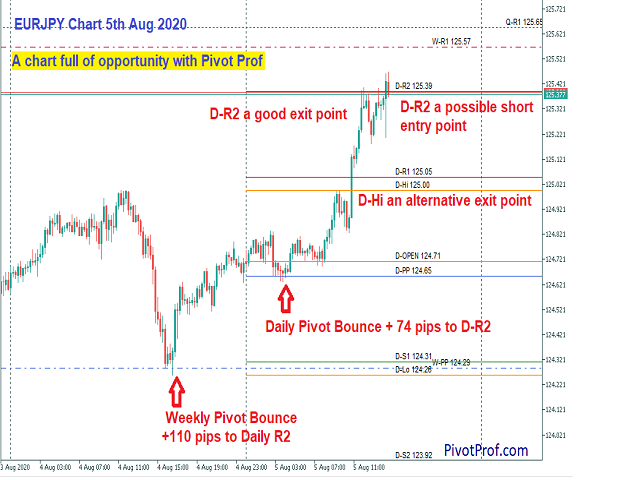
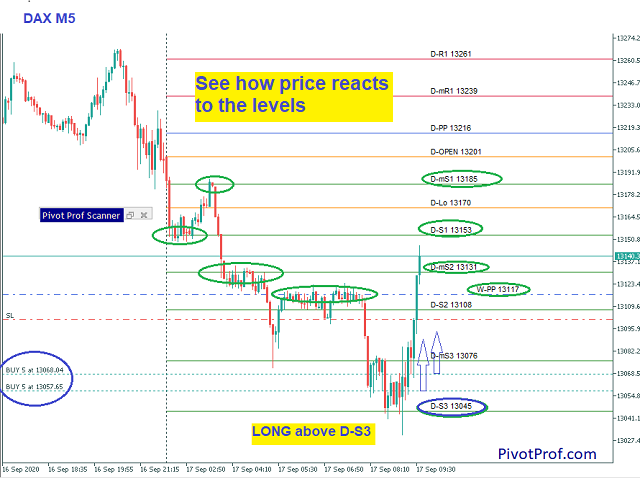
Pivot Prof brings premium levels to the trader where the market is most likely to react, which is the very thing a trader needs to enter or exit the market and to avoid large stoplosses and drawdown.
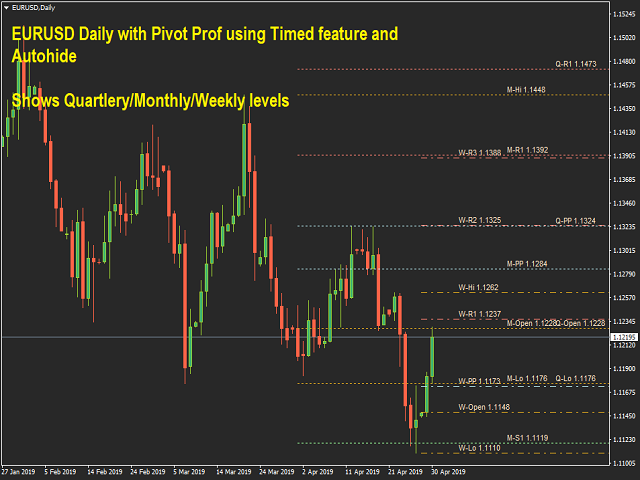
Feature rich with special algorithms to calculate and simultaneously display 120+ levels of information per symbol, from across 17 different timeframes.
Everything is displayed in a unique, tidy and easy to use format, and comes complete with terminal, email and mobile phone alerts. Plus everything is customizable... formulas, display, alerts etc.
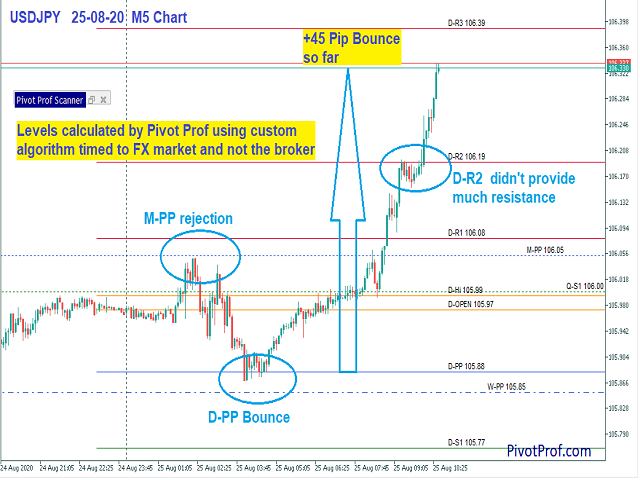
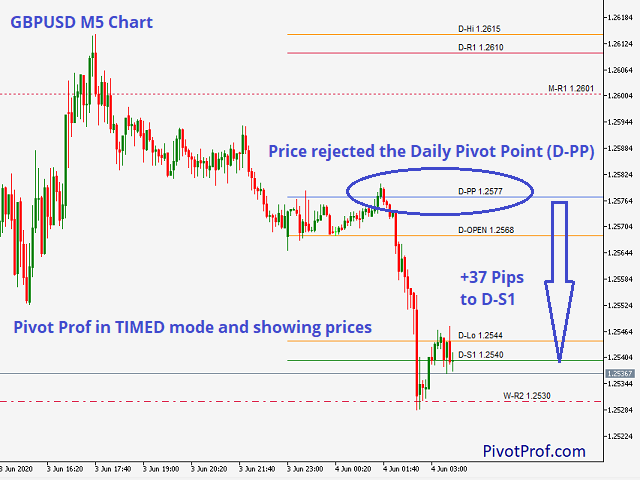
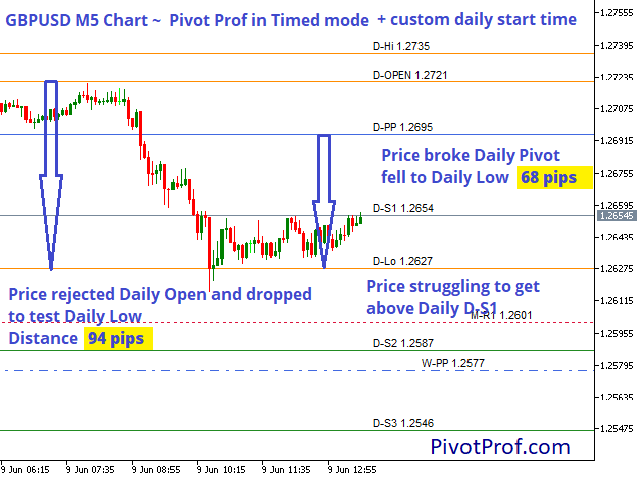
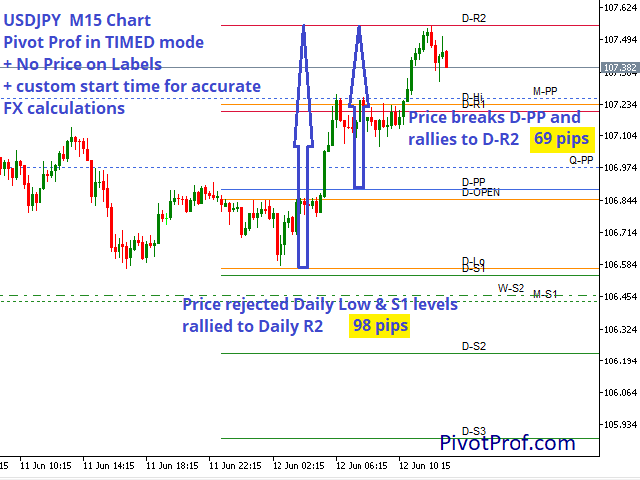
Includes custom day start option for Forex which automatically synchronizes with the start of the FX week in Sydney.
No matter what your trading style, you can use Pivot Prof to identify those key levels for you.
No other indicator does what Pivot Prof does, so read on and get ready to change your trading today.
Click here for the MT5 version + all products
Advantages of Pivot Prof
- Simple, effective trading method
- Identifies key market support and resistance levels
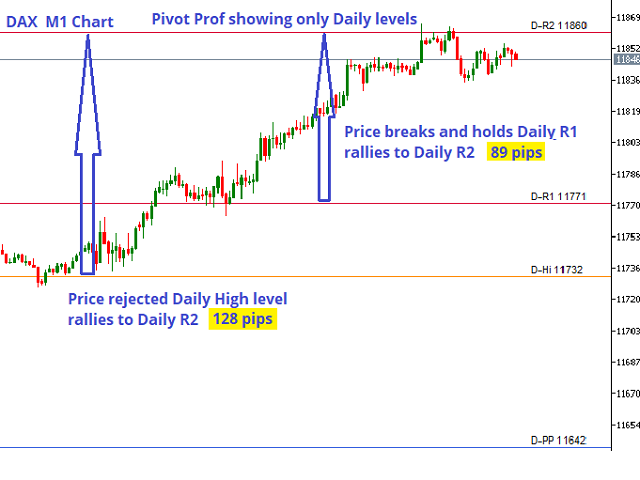
- Easy to use, visual trading levels presented on your chart (more than just pivots)
- Multiple timeframes all in one place
- Popup, Email and Mobile (Push Notification) alerts
- Custom day start for Forex - syncs with start of FX week (auto setup)
- Full customization: Colors, Styles, Levels, Display, Calculations, Alerts and Alert Zones
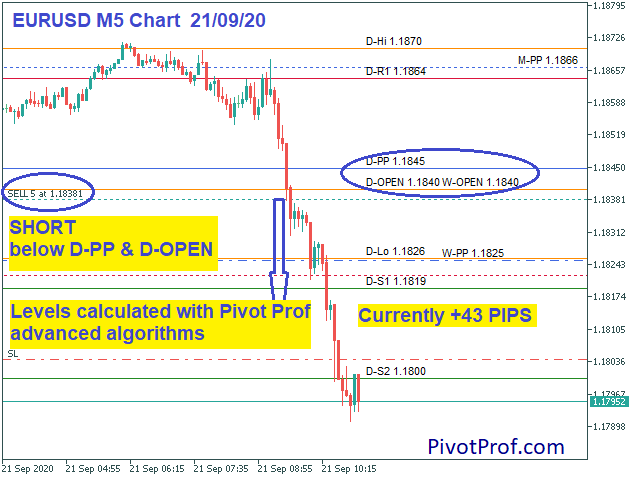
- Unique algorithms to tune levels to market hours and not your broker time
- Unique display methods to keep your chart clear of irrelevant levels
- Levels for Daily, Weekly, Monthly, Quarterly, + 2 Intraday Custom Timeframes
- 5 formulas to choose from: Standard, Fibonacci, Camarilla, Woodies, DeMark
- Set your own percentage levels with Fibonacci pivots.
- You can filter with your preferred indicators/method
- Full Manual
- Works with UHD monitors
- Compatible with EA development
- Excellent product support
Buy with confidence, this is a well supported product with fantastic features.
Purchase Pivot Prof today and start Trading An Edge
You can also see our fantastic Mega Dashboard product here: Mega Dashboard
.
.
#tags #pivot #points #fibonacci #woodie #regression #trend #signal #multi #timeframe #mtf #scalping #swing #day #trading #ranging #market #levels #support #resistance #scanner


I have purchased this indicator when I started trading in 2021 and back then I was still learning through the years of pure price action and using the pivot prof as entries and take profit have been a big game changer for me. Knowledge is important of basic trading and using the pivot prof makes it more powerful. I have purchased this both for my MT5 and MT4. The take profits are accurate with simple entries and executions. Well done Paul. Awesome indicator.