FORCES VARIATION
- インディケータ
- バージョン: 3.0
- アップデート済み: 18 11月 2021
- アクティベーション: 5

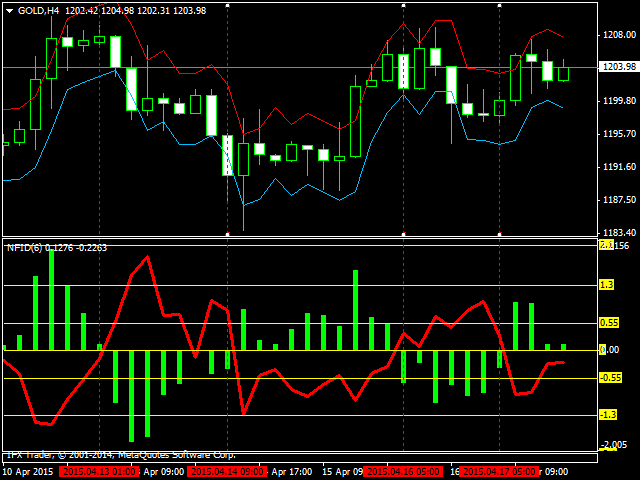
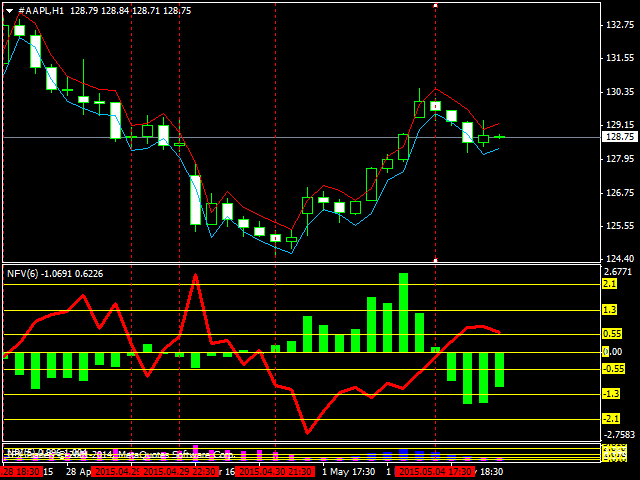
The most important thing in my system of forces, is the variation and changing of these forces. It is the key to the whole system, and from this point, my second indicator called FORCES-VARIATION appeares important. The indicator is represented in a separate window in the form of the green histogram and the red curve.
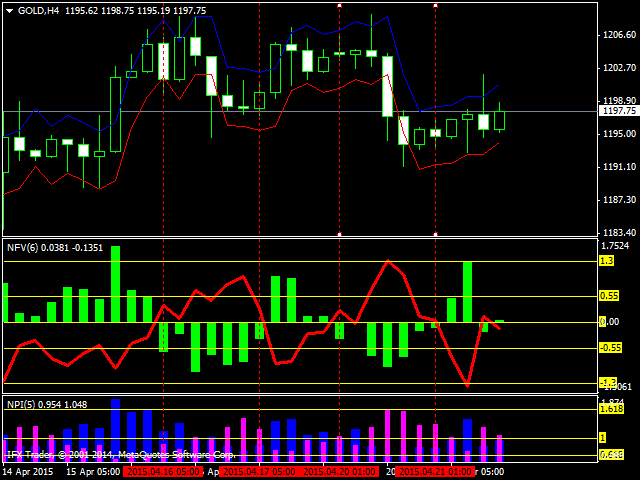
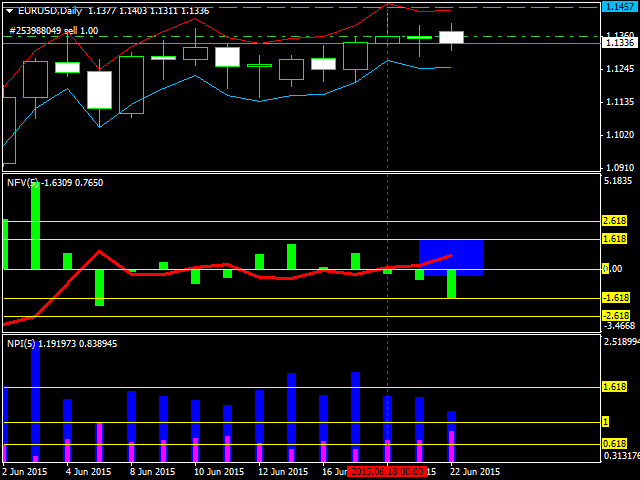
- The parameter NPIuPeriod represents the number of bars on which we calculate the variation of buyers forces.
- The parameter NPIdPeriod represents the number of bars on which we calculate the variation of sellers forces.
This two parameters can be adjusted as you like to see all variation , but the recommended value is 5.
The green histogram measures the variation of buyers force, while the red curve (red histogram 'in the first version') measures the variation of sellers force.
(Variation = changing values and signs).
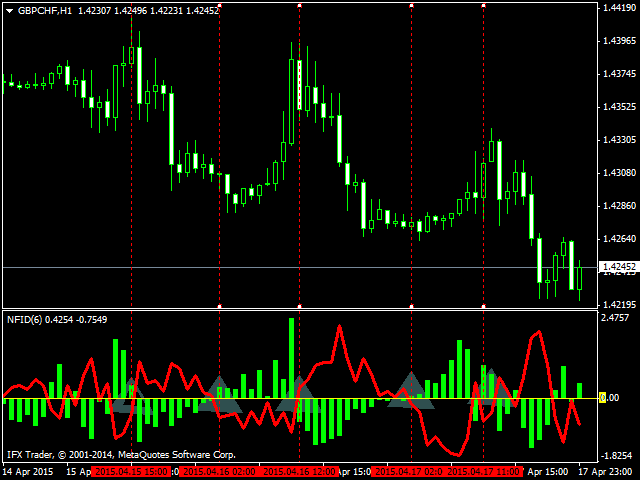
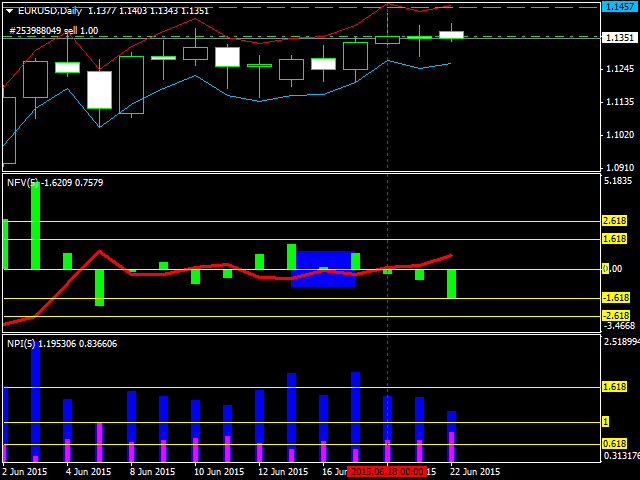
- The changing "trend" from down to the up "trend" is confirmed when the green histogram changes sign from negative to positive (confirmed after candle closing).
- The changing "trend" from the up to the down "trend" is confirmed when the red histogram changes sign from negative to positive (confirmed after candle closing).
When the value of the green histogram increases, that means that "uptrend expected to stay for more time", but if it decreases, we expect that sellers will take control over the price movement.
Respectively, when the red histogram increases, that means that "downtrend expected to stay for more time", and if it decreases, we expect that buyers will take control over the price movement.
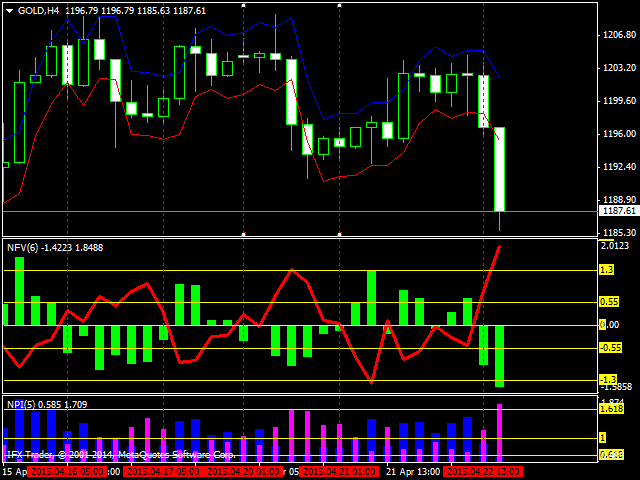
A simple glance at this indicator and in parallel with the price movement gives a very clear impression that it is a tool to predict very early the change of forces acting in the direction of prices.
More details about this system:

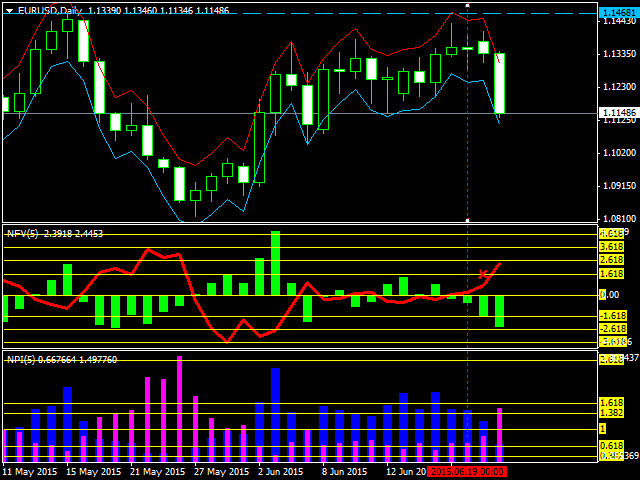
Nice Indicator to detect early trend changes.