Gold Silver Trendline Ultra

Gold Silver Trendline Ultra

Professional Multi-Timeframe Support and Resistance Trendline Detector with Real-Time Signal Labels

This indicator finds and draws the strongest support and resistance trendlines across 6 timeframes automatically. It updates labels in real time as price interacts with each line. No manual drawing. No guesswork. Just clear levels that matter.


What This Indicator Does

Most traders draw trendlines by hand. Two clicks, a line, and hope it holds. The problem is that manual trendlines are subjective. Two traders looking at the same chart will draw different lines. Worse, you miss the lines on timeframes you are not watching. This indicator solves that by scanning every timeframe systematically and only drawing lines that have statistical significance based on multiple price touches.

Each timeframe is processed independently. The zigzag algorithm identifies pivot highs and lows. Then every pair of pivots is tested to find lines with the most price contact. The best support line and the best resistance line per timeframe are drawn with full ray extensions.


Why Multi-Timeframe Matters

Support and resistance on one timeframe can be invisible on another. A key Daily resistance might not be obvious on an M5 chart. This indicator draws all timeframes on the same chart so you always see the full picture. M1 lines for precision entries. M5 and M15 for intraday structure. H1 and H4 for swing context. Daily for the big picture.

When multiple timeframes show the same level, that is high-confluence trading zone. When lower timeframes break a level, check the higher timeframe to decide if it is a real breakout or a fakeout.


Signal Labels Explained

Support Lines

BOUNCE UP > BUY
Price touched the support line and closed back above it within the last 5 bars. This is a long entry signal. The support held and buyers stepped in.

ABOVE > BULLISH
Price is trading above the support line by more than the tolerance threshold. The support zone is intact. No immediate signal but the trend is healthy.

AT SUPPORT > WATCH
Price is within the tolerance zone of the support line. This is a decision point. Traders should watch for a bounce or a break. Do not enter here. Wait for the next label to confirm direction.

BROKEN > SELL
Price broke below the support line by more than the tolerance threshold. The level that was providing support has turned into resistance. This is a bearish signal. Previous buyers are now trapped and may exit, adding to selling pressure.

Resistance Lines

BROKEN > BUY
Price broke above the resistance line by more than the tolerance threshold. The level that was providing resistance has turned into support. This is a bullish signal. The breakout suggests momentum is strong.

REJECTED > SELL
Price touched the resistance line and closed back below it within the last 5 bars. This is a short entry signal. The resistance held and sellers stepped in.

BELOW > BEARISH
Price is trading below the resistance line by more than the tolerance threshold. The resistance zone is intact. No immediate signal but the trend is weak.

AT RESISTANCE > WATCH
Price is within the tolerance zone of the resistance line. Decision point. Watch for rejection or breakout.


Pivot Detection Methodology

The zigzag algorithm identifies swing highs and swing lows on each timeframe. A swing high is a bar where the high price is higher than the specified number of bars on both sides. A swing low is a bar where the low price is lower than the bars on both sides. The Zigzag Sensitivity parameter controls this. A value of 5 means each pivot must be higher or lower than 5 bars on each side.

Once pivots are identified, the algorithm tests every pair of same-type pivots to find valid trendlines. Two swing highs are paired to test a resistance line. Two swing lows are paired to test a support line. For each pair, every other pivot is checked to see if it touches the line within the tolerance threshold. Lines with the most touches are kept.

Only the strongest line per type per timeframe is displayed on the chart. If you have 500 potential pivot pairs on a timeframe, only the single best support and single best resistance line are drawn. This keeps the chart clean and focused on the most relevant levels.


Touch Tolerance and ATR

The Touch Tolerance parameter is a multiplier of the Average True Range. A setting of 0.3 means a pivot can be within 30% of the ATR distance from the line and still count as a touch. In volatile markets, ATR expands and tolerance widens automatically. In calm markets, tolerance tightens. This ensures the indicator works across all market conditions without manual adjustment.


Input Parameters Reference

TIMEFRAMES TO ANALYZE

Enable or disable each timeframe independently. If you only trade intraday, disable Daily to reduce clutter. If you are a position trader, enable only H4 and Daily. Each timeframe adds 2 trendline objects (support and resistance) plus 2 label objects.

M1 Timeframe - Default: true
For precision entries and exits. M1 lines are short term and react quickly.

M5 Timeframe - Default: true
Common timeframe for scalping and short-term trades.

M15 Timeframe - Default: true
Intraday structure. Good for identifying the session trend.

H1 Timeframe - Default: true
Hourly levels that often hold for several hours or days.

H4 Timeframe - Default: true
Swing trading levels. H4 lines are respected by most intraday traders.

Daily Timeframe - Default: true
Major structural levels that can last weeks or months. Daily lines are the most significant.

TRENDLINE DETECTION

Zigzag Sensitivity - Default: 5, Range: 1 to 20
Number of bars required on each side of a pivot. Lower values produce more pivots, which means more trendline candidates. Higher values produce fewer pivots and only show major swing points. For active trading on M1 and M5, values of 3 to 5 work well. For Daily analysis, values of 7 to 12 filter out noise.

Minimum Touches - Default: 3, Range: 2 to 10
Minimum number of price touches required for a trendline to be considered valid. A line with only 2 touches is just two random points. A line with 3 or more touches has statistical significance. Higher values produce fewer but more reliable lines. For swing trading, 3 is a good balance. For position trading, consider 4 or 5.

Touch Tolerance - Default: 0.3, Range: 0.1 to 2.0
This value is multiplied by the ATR of the timeframe to calculate touch tolerance. For example, if ATR on H1 is 100 pips and tolerance is 0.3, a pivot within 30 pips of the line counts as a touch. Higher values detect more lines but reduce quality. Lower values require precise touches.

VISUAL SETTINGS

Each timeframe has its own color setting. The defaults are chosen for clear visibility against typical chart backgrounds. M1 is DimGray because it is the least significant. D1 is Red because it is the most significant. You can customize all colors to match your chart theme.

Line Width controls the thickness of all drawn trendlines. Default 2 is visible without being distracting. Increase to 3 or 4 if you trade on high DPI displays or need more visual weight.


How to Use in Trading

For Scalping (M1 and M5)
Watch the M1 and M5 labels. When price approaches these lines, look for the BOUNCE or REJECTED label to appear. This is your entry signal. Place a stop loss just beyond the line. Take profit at the next line on the same timeframe or the next higher timeframe.

For Day Trading (M15 and H1)
Use the H1 lines to identify the direction of the day. If H1 support is rising and price keeps bouncing off it, the intraday trend is up. Take long entries when M15 bounces off the H1 support line. If H1 resistance is falling and price keeps rejecting it, the trend is down.

For Swing Trading (H4 and Daily)
The Daily support and resistance lines are the most important. They represent levels that have been tested multiple times over weeks or months. When Daily support holds, hold your long position. When Daily resistance breaks, that is a major signal that the trend has shifted. Ignore M1 reactions at Daily levels. The Daily timeframe matters more.

Multi-Timeframe Confluence
The most powerful setups happen when the same level appears on multiple timeframes. If M15, H1, and H4 all show a resistance line within a close range, that zone is extremely significant. A breakout through that zone with momentum is a high-confidence trade. A rejection at that zone is also a high-confidence reversal trade.


Chart Management

The indicator draws up to 12 trendline objects and 12 label objects per chart (support and resistance for each of 6 timeframes). All objects are prefixed with TPRO_ so they can be managed or deleted easily. To remove all indicator lines at once, run a script that deletes objects by prefix.

The indicator only rebuilds lines on new bars. Labels update every 5 ticks to balance performance with responsiveness. This means smooth operation even during high volatility news events.


About the Author

Jignesh Gond is an active XAUUSD trader with years of experience trading gold and silver. This indicator is built from real trading experience, not theory. Every feature exists because it solved a real problem in live trading.

MyFxBook: 
MQL5 Profile: https://www.mql5.com/en/users/jigu266

おすすめのプロダクト
Introducing Your Ultimate Trading Edge:   Dynamic Support & Resistance, Advance Entry Levels Light Indicator for MT5 platform Unlock the power of precision trading with our cutting-edge Dynamic Support & Resistance Indicator. Designed to give traders unparalleled clarity, this indicator is your roadmap to identifying exactly where to buy and sell, maximizing your potential for consistent, sustainable profits. Why Choose Our Indicator? Crystal Clear Entry and Exit Points : No more guesswork. Our
ARE Quantum Liquidity Institutional Smart Money Engine ARE Quantum Liquidity is an advanced Smart Money Concepts (SMC) indicator designed to help traders identify institutional liquidity movements and high-probability trading opportunities. The indicator analyzes market structure in real time and automatically detects important price action elements used by professional traders, including Break of Structure (BOS), Change of Character (CHoCH), Order Blocks, Fair Value Gaps (FVG), Liquidity Swe
FX Clock
Abderrahmane Benali
FXClock – Professional Clock Indicator for Traders Please leave a 5 star rating if you like this free tool! Thank you so much :) The FXClock indicator is a practical and simple tool that displays time directly on your trading platform, allowing you to track multiple key pieces of information at the same time. It is specially designed to help traders synchronize their trading with market hours and global sessions. Key Features: Displays the broker server time with precision. Displays your local c
FREE
LT Support Resistance - サポート&レジスタンスを100%自動で識別 手動でサポートラインやレジスタンスラインを引く作業に、時間を取られて疲れていませんか?あるいは、重要なレベルをいつも見落としてしまい、悔しい思いをしていませんか?LT Support Resistanceは、そのような煩わしい作業をなくすために開発されました。複数のタイムフレーム(時間足)を同時に分析し、取引しているアセットの最も重要なゾーンを自動的に識別してチャート上に描画します。 == 重要レベルのスマート自動化 == 主観的で時間の Gann(ガン)かかる手動のライン引きとは異なり、このインジケーターは価格の履歴を分析し、重要な反転ポイントを特定して、価格が「実際に」意識しているサポート・レジスタンスラインを描画します。その結果、客観的で素早い、データに基づいた分析が可能になります。 == 主な特徴 == 100% 自動検出: 手動による分析なしでサポート/レジスタンスを識別 マルチタイムフレーム (MTF): M5(5分足)チャート上に、H1、H4、D1、W1のレベルを同時に表示可能 ス
The BTC Winner MT5 EA, built on a very successful trading record, uses a breakthrough approach to profit, which is a very effective method, especially in dealing with high volatility trading products, I am sure it will make a lot of profit. The BTC Winner MT5 EA provides an MT5 version, which allows you to use high-precision real Tick data for various tests to find better personalized settings. I provide a group for questions, as well as personalized support at every step. If you have any quest
マルチタイムフレーム対応、カスタマイズ可能なビジュアルシグナル、設定可能なアラートシステムを備えたAverage True Range(ATR)インジケーター。 フリーランスプログラミングサービス、アップデート、その他のTrueTL製品は私の MQL5プロフィール でご覧いただけます。 フィードバックとレビューを大変お待ちしております! ATRとは? Average True Range(ATR)は、J. Welles Wilderが開発した市場のボラティリティを測定するテクニカルインジケーターです。指定した期間のTrue Rangeの平均を計算します。True Rangeは以下の中で最大の値です:現在の高値から現在の安値までの距離、前回の終値から現在の高値までの距離、または前回の終値から現在の安値までの距離。 ATRは価格方向を示しません — ボラティリティのみを測定します。ATRが上昇するとボラティリティの増加を示し、ATRが低下するとボラティリティの減少を示します。トレーダーはATRを使用して市場状況を評価し、動的なストップロスを設定し(例:ATRベースのトレーリングストッ
FREE
Orderflow Scalp Pro v2.4   delivers institutional-grade trading intelligence through advanced volume analysis, dynamic VWAP calculations, real-time aggressive score monitoring, and precision arrow signals. This complete trading system transforms complex market data into clear, actionable signals for consistent profitability on 3-4 minute timeframes. Full Documentation: [Download PDF] Four Powerful Components in One System Volume Profile HeatMap with POC/VAH/VAL Transform your charts into inst
BlueBird EA – Dynamic Adaptive Grid Hedge System BlueBird EA   represents a new era of grid-based automation — combining volatility awareness, adaptive trend tracking, and smart capital management. If you are seeking a   fully autonomous, dynamic grid system   capable of capturing both trends and corrections,   BlueBird EA   is your ultimate trading companion. Overview BlueBird EA is a next-generation adaptive grid trading system designed for dynamic markets such as GOLD (XAUUSD) . It intellige
IQ FX Gann Levels a precision trading indicator based on W.D. Gann’s square root methods . It plots real-time, non-repainting support and resistance levels to help traders confidently spot intraday and scalping opportunities with high accuracy. William Delbert Gann (W.D. Gann) was an exceptional market analyst, whose trading technique was based on a complex blend of mathematics, geometry, astrology, and ancient mathematics which proved to be extremely accurate. We don't offer free or bonus indic
Obor Pawai V75 – Expert Advisor for Gold Trading Obor Pawai V75 is a next-generation Expert Advisor (EA) developed specifically for trading gold (XAUUSD). Built with a proprietary Breakout Finder system and a suite of advanced indicators, it offers both automated and customizable trading strategies for breakout, swing, and scalping scenarios. Key Features Breakout Finder Detects high-probability breakout opportunities using integrated logic from DeMarker, MACD, RSI, ATR, and Pivot Points. Desig
Babel Assistant
Iurii Bazhanov
4.33 (9)
Babel assistant 1 MT5ネッティングロボット「Babel_assistant_1」は、ZigZagインジケーターを使用してM1、M5、M15、H1、H4、D1、W1の時間足全体でフィボナッチレベルを生成し、買いトレンドと売りトレンドの強さを計算します。指定されたトレンドレベル4.925を超えると、「Lot for open a position」の設定を使用してポジションをオープンします。その後、Babelは特定のフィボナッチレベルに指値注文(または逆指値注文)を配置し、指定されたストップロス(Stop Loss)およびテイクプロフィット(Take Profit)のラインを設定します。画面には、ポジション、トレード、トレンドの現在の結果が表示されます。 0.02ロット以上の手動でのポジション追加は、ロボットによって独自の保留注文のトリガーとして認識されます。0.01ロットの保留注文または成行注文は、執行時に単にポジション量を変更します。 免責事項: 以下の資料は、情報提供および教育目的のみを目的としています。外国為替市場向けの自動取引プログラムである本製品「Babel
FREE
Limitless MT5 is a universal indicator suitable for every beginner and experienced trader. works on all currency pairs, cryptocurrencies, raw stocks Limitless MT5 - already configured and does not require additional configuration And now the main thing Why Limitless MT5? 1 complete lack of redrawing 2 two years of testing by the best specialists in trading 3 the accuracy of correct signals exceeds 80% 4 performed well in trading during news releases Trading rules 1 buy signal - the ap
全体像を把握し、上位足の視点であらゆる時間足をトレード。精度の高いエントリーを実現! プロのトレーダーは、質の高いトレードはすべてトップダウン分析から始まることを理解しています。しかし、従来の分析手法では複数のチャートや時間足を何度も切り替える必要があり、集中力が途切れたり、重要な上位足の情報を見逃したりする原因となります。 この繰り返しの作業は分析効率を低下させ、エントリーの精度にも影響を与え、市場全体の構造を継続的に把握することを難しくします。 TOP-DOWN CANDLE CAST は、上位時間足のローソク足(実体・ヒゲ・始値・終値・値幅)を、任意の下位時間足チャート上へ正確に投影する MT5 インジケーターです。チャートを何度も切り替えたり、上位足の値動きを記憶に頼って判断したりする必要はありません。 TOP-DOWN CANDLE CAST は、ライブでピクセル単位の正確さを持つ視覚的な基準を提供し、トップダウン分析をより迅速にし、エントリー判断をより規律あるものにします。これにより、トレーダーは次のことが可能になります。 ・ 実行用チャートを離れることなく、上位時間足の市
FREE
# SHARK HUNTER AI - Advanced Multi-Timeframe Gold & Forex Predator (MT5) **Shark Hunter AI** is a professional-grade Expert Advisor designed for precision trend-following and momentum scalping on MetaTrader 5. Specifically engineered for **Gold (XAUUSD)** and major Forex pairs, Shark Hunter combines higher-timeframe trend directional bias with lower-timeframe micro-structure pullback entries to capture high-probability market impulses while maintaining strict risk boundaries. --- ## KEY AD
CONFLUENCE AND PROBABILITY INDICATOR Volume • Fibonacci • Pullback • Technical Analysis This indicator was developed with an approach focused on identifying areas of interest in the market , combining different concepts widely used in technical analysis and trading studies. Its purpose is to assist traders in interpreting price behavior through the confluence of information , allowing each user to integrate the indicator into their own analysis system and personal strategies. KEY CONCEPTS ANALYZ
Dracula Gold
Vishnu Narayan Patil
Gold barely moves while Europe and America sleep. It drifts inside a narrow band for hours. Then the London and New York traders arrive, and it breaks out of that band - sometimes hard. Dracula works the night shift. It measures the overnight band, waits for gold to break out of it, takes that one trade, and then stops for the day. What it actually does 1. Overnight, it quietly records the highest and lowest price of the session. That is the range. 2. In the morning session, it watches for the f
マルチタイムフレーム対応、カスタマイズ可能なビジュアルシグナル、設定可能なアラートシステムを備えたBalance of Power(BOP)インジケーター。 フリーランスプログラミングサービス、アップデート、その他のTrueTL製品は私の MQL5プロフィール からご利用いただけます。 フィードバックとレビューを大歓迎します! BOPとは? Balance of Power(BOP)は、価格の変化をバーの値幅と比較することで、買い手と売り手の強さを測定するオシレーターです。インジケーターは(終値 - 始値)/(高値 - 安値)として計算され、その後Simple Moving Average(SMA)で平滑化されます。 BOP値は-1から+1の間で変動します。正の値は買い手が強いことを示し(終値が始値より高い)、負の値は売り手が強いことを示します(終値が始値より低い)。値の大きさは動きの強さを示します。BOPは買い圧力と売り圧力のバランスを示すことで、市場の強さと潜在的な反転を識別するのに役立ちます。 特徴: 矢印と垂直線によるビジュアルシグナルマーカー 設定可能なトリガーを持つ3
FREE
Quantum SnR Thrones
Sojitra Rekhaben Rajeshbhai
Professional Support & Resistance Visualizer for MT5 Clear Market Structure, Smarter Trades Professional Support & Resistance Visualizer is a powerful MT5 indicator that automatically identifies and displays high-probability support and resistance levels directly on your chart. No more manual trendline drawing—let the algorithm do the heavy lifting while you focus on what matters: executing quality trades. Key Features  Intelligent Level Detection Automatically identifies significant support and
XAU VWAP Mean Reversion H4 Expert Advisor for MetaTrader 5 — Gold / XAUUSD focus Version: 1.00 What it is XAU VWAP Mean Reversion H4 is an Expert Advisor for gold on the H4 chart. Intraday VWAP mean-reversion style participation on gold H4. Built for structured automated participation — not grid , not martingale . Evaluate on your broker and risk profile before any live use. This product is a technical system . Exact thresholds and entry equations remain internal product design and are not publ
FREE
Nakshatra Edge
Vimal Kirtikumar Sheth
MARTINGLE   VERSION-3 : The Smart, Risk-Capped Trading System Say goodbye to traditional, high-risk EAs that blow accounts. MARTINGLE   VERSION-3 is an intelligent, strictly risk-capped algorithm explicitly designed for the H1 timeframe on XAUUSD (Gold). Driven entirely by raw logic and verified data, this Expert Advisor uses advanced market tracking and a hard-capped risk-recovery system to generate consistent yields while aggressively protecting your margin. Verified Backtest Performance (Aug
The Bitcoin Reaper
Profalgo Limited
3.71 (34)
発売プロモーション: 現在の価格で入手できるコピーの数はごく限られています。 最終価格: 999ドル 新規 (349 ドルから) --> 1 EA を無料で入手 (取引口座番号 2 つ)。 究極のコンボディール   ->   こちらをクリック 公開グループに参加する: ここをクリック   LIVE SIGNAL LIVE SIGNAL V2.0 UPDATE 2.0 INFO BITCOIN REAPER へようこそ!   Gold Reaper が大成功を収めた後、同じ勝利の原則を Bitcoin 市場に適用する時が来たと判断しました。そして、それは非常に有望に見えます!   私はこれまで 20 年以上にわたってトレーディング システムを開発してきましたが、私の専門分野は「断然」ブレイクアウト戦略です。 このシンプルながらも効果的な戦略は、常に最高の取引戦略の上位にランクインしており、基本的にあらゆる市場に適用できます。     特にビットコインのような変動の激しい市場では、真価を発揮します。   それで、この戦略はどのように機能するのでしょうか? ブレイクアウト戦略は、重要なサ
Free automatic Fibonacci is an indicator that automatically plots a Fibonacci retracement based on the number of bars you select on the BarsToScan setting in the indicator. The Fibonacci is automatically updated in real time as new highest and lowest values appears amongst the selected bars. You can select which level values to be displayed in the indicator settings. You can also select the color of the levels thus enabling the trader to be able to attach the indicator several times with differe
FREE
After Purchase Inbox TO get your Trader Kit with this tool YouTube Demo B&C Blue Guardian is a professional-grade precision indicator built for Boom & Crash indices, Deriv synthetics, . It combines multi-oscillator confluence  to pinpoint high-probability spike and reversal zones with zero chart lag.   Strict Direction Engine: Automatically enforces BUY-onl
ピボットポイントフィボRSJは、フィボナッチレートを使用してその日のサポートラインとレジスタンスラインを追跡するインジケーターです。 この壮大な指標は、フィボナッチレートを使用してピボットポイントを通じて最大7レベルのサポートとレジスタンスを作成します。 価格がこのサポートとレジスタンスの各レベルを尊重する方法は素晴らしいです。そこでは、オペレーションの可能な入口/出口ポイントを認識することができます。 特徴 最大7レベルのサポートと7レベルの抵抗 レベルの色を個別に設定します 入力 ピボットタイプ ピボットフィボRSJ1 =フィボ比1の計算 ピボットフィボRSJ2 =フィボ比2の計算 ピボットフィボRSJ3 =フィボ比3の計算 ピボットフィボクラシック=クラシックピボット計算 最小ピボットレベル ピボット3レベル ピボット4レベル ピボット5レベル ピボット6レベル ピボット7レベル それでも質問がある場合は、ダイレクトメッセージで私に連絡してください: https://www.mql5.com/ja/users/robsjunqueira/
FREE
Alpha Distribution Entry Classic is a premium, quantitative algorithmic trading system engineered specifically for XAUUSD (Gold) USDJPY & GBPUSD. Unlike common retail grid or martingale bots that gamble with your capital. REALITY CHECK: NOT A DOPAMINE BOT Important Note before purchasing: This EA does not look for a fake 99% win-rate by hiding floating drawdowns. It operates on a realistic, mathematically proven High Reward Ratio with low Drawdown even you can set your Equity Drawdown limit per
XAU TURBO TITAN MATRIX High-Frequency Hybrid Grid Engine - Navigate extreme volatility with dynamic survival mechanisms. Xau Turbo Titan Matrix is an advanced, fully automated Expert Advisor explicitly engineered for XAUUSD (Gold). Built for high-frequency micro-profit extraction, it utilizes a proprietary Hybrid Turbo Grid system combined with a Dynamic Survival Mode to systematically extract profits from the market while maintaining rigorous risk control during extreme market conditions. Thi
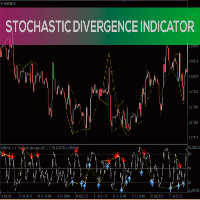
Divergence Detection: The indicator is designed to identify divergences between the price movement and the Stochastics oscillator. This can help traders spot potential trend reversals or trend continuation opportunities. Early Warning System: By capturing divergences, the Stochastics Divergence Indicator can provide an early warning of possible market turning points. This allows traders to take timely action and make informed decisions. Versatility: The indicator can be applied to various finan
HAWK 4.0 — GOLD SIGNAL INDICATOR The most precise signal indicator  for XAUUSD (Gold) trading. Built on ATR Bands + Pivot detection. Signals appear only at real reversal points. No repaint. No delay. No noise. WHAT YOU GET → Clear BUY / SELL arrows → Auto TP1 / TP2 / TP3 levels → Auto SL level → Built-in time filter (UTC) → Real-time success statistics → Full alert system DESIGNED FOR Symbol:    XAUUSD (Gold) Timeframe: M3 / M5 Ses
QuantumAlert RSI Navigator is a free indicator available for MT4/MT5 platforms, its work is to provide "alerts" when the market is inside "overbought and oversold" regions in the form of "buy or sell" signals. This indicator comes with many customization options mentioned in the parameter section below, user can customise these parameters as needful. Join our MQL5 group , where we share important news and updates. You are also welcome to join our private channel as well, contact me for the priva
FREE
Gold Trend Pro は、XAUUSD(ゴールド)を対象に H1(1時間)タイムフレーム専用として開発されたプロフェッショナルなエキスパートアドバイザーです。ランダムなエントリーで市場を追いかけるのではなく、明確なルールに基づいた構造的なアプローチを採用し、クリーンで高品質なトレードセットアップのみを狙います。すべての BUY / SELL 判断は定義された条件に基づいて行われ、感情・推測・「カジノ的取引」は一切ありません。 Gold Trend Pro の大きな特長の一つは、適応型のトレード保護およびターゲットロジックです。固定された Stop Loss や Take Profit に依存せず、市場の現在の動きに合わせて動的に調整されます。これにより、ボラティリティの変化に柔軟に対応し、ノイズの多い相場での不要なストップアウトを回避し、トレンド相場およびレンジ相場の両方で安定したパフォーマンスを実現します。 Gold Trend Pro は、過度なリスクを取る戦略ではなく、安定性とリスク管理を重視するトレーダー向けに設計されています。数量よりも品質を重視し、ゴールド特有の速
このプロダクトを購入した人は以下も購入しています
PrimeScalping is a powerful trading companion designed to generate high-probability entry signals with dynamic TP/SL/DP levels based on volatility. Built-in performance tracking shows win/loss stats, PP1/PP2 hits, and success rates — all updated live. Key Features: Buy/Sell signals with adaptive volatility bands Real-time TP/SL/DP levels based on ATR Built-in MA Filter with optional ATR/StdDev volatility Performance stats panel (Success, Profit/Loss, PP1/PP2) Alerts via popup, sound, push, or e
SmartScalping is a powerful trading companion designed to generate high-probability entry signals with dynamic TP/SL/DP levels based on volatility. Built-in performance tracking shows win/loss stats, PP1/PP2 hits, and success rates — all updated live. Key Features: Buy/Sell signals with adaptive volatility bands Real-time TP/SL/DP levels based on ATR Built-in MA Filter with optional ATR/StdDev volatility Performance stats panel (Success, Profit/Loss, PP1/PP2) Alerts via popup, sound, push, or e
ScalpPoint is a powerful trading companion designed to generate high-probability entry signals with dynamic TP/SL/DP levels based on volatility. Built-in performance tracking shows win/loss stats, PP1/PP2 hits, and success rates — all updated live. Key Features: Buy/Sell signals with adaptive volatility bands Real-time TP/SL/DP levels based on ATR Built-in MA Filter with optional ATR/StdDev volatility Performance stats panel (Success, Profit/Loss, PP1/PP2) Alerts via popup, sound, push, or emai
MasterTrend Indicator for MT5 A powerful trend-following and signal-evaluation tool MasterTrend   is a custom MT5 indicator that combines Moving Averages and ATR-based risk/reward logic to generate clear buy/sell signals. It visualizes dynamic SL/TP levels, evaluates past trade outcomes, and displays win/loss statistics in a clean on-chart panel. Key features include: Buy/Sell signals based on MA crossovers ATR-based SL/TP1/TP2/TP3 levels with visual lines and labels Signal outcome tracking wit
AriX
Temirlan Kdyrkhan
1 (4)
AriX Indicator for MT5 A powerful trend-following and signal-evaluation tool AriX is a custom MT5 indicator that combines Moving Averages and ATR-based risk/reward logic to generate clear buy/sell signals. It visualizes dynamic SL/TP levels, evaluates past trade outcomes, and displays win/loss statistics in a clean on-chart panel. Key features include: Buy/Sell signals based on MA crossovers ATR-based SL/TP1/TP2/TP3 levels with visual lines and labels Signal outcome tracking with real-time stat
MERAVITH SCANNERは、MetaTrader 5用のプロフェッショナルな金融市場インジケーターで、複数の分析ツールを一つの統合システムにまとめています。独自の出来高加重平均価格(VWAP)手法を使用してすべての計算を自動で行い、主観的な解釈を完全に排除します。 このインジケーターは、すべての資産クラス(FX、株式、指数、商品、暗号通貨)およびM1から月足までのすべての時間軸で動作します。基本原理は「価格は出来高に従う」というものです。MERAVITHは機関投資家の出来高が集中するポイントを特定し、その集中から数学的に正確な価格レベルを導き出します。予測や投機は行わず、計算のみを行います。 MERAVITH SCANNERを使用すると、28の主要FX通貨ペアをすべての時間軸でわずか2~3分でスキャンできます。また、任意の市場をスキャンすることも可能です。例えば、約100銘柄の株式を約10分でスキャンできます。 インジケーターは、消耗レベル、均衡線、偏差、統計レベル、およびターゲット予測を算出します。 チャート要素 Origin Point :すべての計算が始まる起点です。イン
The Expert Advisor and the video are attached in the Discussion tab . The robot applies only one order and strictly follows the signals to evaluate the indicator efficiency. Pan PrizMA CD Phase is an option based on the Pan PrizMA indicator. Details (in Russian). Averaging by a quadric-quartic polynomial increases the smoothness of lines, adds momentum and rhythm. Extrapolation by the sinusoid function near a constant allows adjusting the delay or lead of signals. The value of the phase - wave s
Классификатор силы тренда. Показания на истории не меняет. Изменяется классификация только незакрытого бара. По идее подобен полной системе ASCTrend, сигнальный модуль которой, точнее его аппроксимация в несколько "урезанном" виде, есть в свободном доступе, а также в терминале как сигнальный индикатор SilverTrend . Точной копией системы ASCTrend не является. Работает на всех инструментах и всех временных диапазонах. Индикатор использует несколько некоррелируемых между собой алгоритмов для класси
FFx Universal Strength Meter PRO is more than a basic strength meter. Instead of limiting the calculation to price, it can be based on any of the 19 integrated strength modes + 9 timeframes. With the FFx USM, you are able to define any period for any combination of timeframes. For example, you can set the dashboard for the last 10 candles for M15-H1-H4… Full flexibility! Very easy to interpret... It gives a great idea about which currency is weak and which is strong, so you can find the best pai
The FFx Universal MTF alerter shows on a single chart all the timeframes (M1 to Monthly) with their own status for the chosen indicator. 9 indicators mode (MACD-RSI-Stochastic-MA-ADX-Ichimoku-Candles-CCI-PSAR). Each can be applied multiple times on the same chart with different settings. Very easy to interpret. Confirm your BUY entries when most of the timeframes are showing green color. And confirm your SELL entries when most of the timeframes are showing red color. 2 Alert Options : input to s
The FFx Watcher PRO is a dashboard displaying on a single chart the current direction of up to 15 standard indicators and up to 21 timeframes. It has 2 different modes: Watcher mode: Multi Indicators User is able to select up to 15 indicators to be displayed User is able to select up to 21 timeframes to be displayed Watcher mode: Multi Pairs User is able to select any number of pairs/symbols User is able to select up to 21 timeframes to be displayed This mode uses one of the standard indicators
FFx Patterns Alerter gives trade suggestions with Entry, Target 1, Target 2 and StopLoss .... for any of the selected patterns (PinBar, Engulfing, InsideBar, OutsideBar) Below are the different options available: Multiple instances can be applied on the same chart to monitor different patterns Entry suggestion - pips to be added over the break for the entry 3 different options to calculate the SL - by pips, by ATR multiplier or at the pattern High/Low 3 different options to calculate the 2 TPs -
MetaTrader 4 version available here : https://www.mql5.com/en/market/product/24881 FFx Basket Scanner is a global tool scanning all pairs and all timeframes over up to five indicators among the 16 available. You will clearly see which currencies to avoid trading and which ones to focus on. Once a currency goes into an extreme zone (e.g. 20/80%), you can trade the whole basket with great confidence. Another way to use it is to look at two currencies (weak vs strong) to find the best single pairs

MetaTrader 4 version available here: https://www.mql5.com/en/market/product/25793 FFx Pivot SR Suite PRO is a complete suite for support and resistance levels. Support and Resistance are the most used levels in all kinds of trading. Can be used to find reversal trend, to set targets and stop, etc. The indicator is fully flexible directly from the chart 4 periods to choose for the calculation: 4Hours, Daily, Weekly and Monthly 4 formulas to choose for the calculation: Classic, Camarilla, Fibonac
ClassicSBA
Umri Azkia Zulkarnaen
this indicator very simple and easy if you understand and agree with setup and rule basic teknical sba you can cek in link : please cek my youtube channel for detail chanel : an for detail info  contact me  basicly setup buy (long) for this indicator is Magenta- blue and green candle or magenta - green  and green candlestik and for setup sell (short) is Black - yellow - and red candle or black - red  and red candlestik
A scalping indicator based on mathematical patterns, which on average gives signals with relatively small SL, and also occasionally helps to catch big moves in the markets (more information in the video) This indicator has three main types of notifications: The first type warns of a possible/upcoming signal on the next bar The second type indicates the presence of a ready signal to enter the market/open a position The third type is for SL and TP levels - you will be notified every time price re
Recommended TimeFrame >= H1. 100% Non Repainted at any moment.  Use it carefully, only with Trend Direction. Trading Usage: 2 Variants: as Range System or as BreakOut System (Both Only With Trend Direction)::: (Always use StopLoss for minimise Risk); [1] as Range System: (Recommended) in UP TREND:  - BUY in Blue Line , then if price goes down by 50 points (on H1) open Second BUY.   Close in any Profit you wish: TrailingStop(45 points) or Close when Price touches upper Gold Line. in DOWN TREND
this indicator is a Spike detector indicator, it is specially designed to trade Boom 1000, Boom 500, Crash 1000 and Crash 500 We recommend using it on Deriv Boom and Crash indices only Its setting is intuitive, familiar, easy to use it has notification functions; audible notifications and push notifications. this tool is simple to use, easy to handle This update is based on different strategies for spikes
POSITION TRADE AF I present a trading system designed to assist traders in the technical analysis and study of opportunities for Position Trading , using an approach based on the combination of price structure, volume, support, resistance, and overall market context . The indicator was developed as a professional analytical tool , with the objective of automatically identifying relevant areas on the chart where a greater confluence of technical factors may exist, providing traders with regions t
Trend and Signals MT5  indicator scans  30 trading Instruments (Forex, Metals and Indices).     It uses special algorithm on the  current market   based on   Pure Price Action   and display the overall trend and signal on the dashboard. When signals are produced the indicator sends alert and notification. Strategy for Signals This indicator uses the daily timeframe to determine the direction of the trend. The hourly timeframe is used to identify possible entries. Main trend and is determined by
This indicator is based on a mathematical formula and an ANN combined, designed to make a model(using previous prices) of the most recent market condition (any chart*) in order to use the model as a forecasting tool. *This indicator can operate on any chart/timeframe, but it's suggested you use multiple timeframes for each trade because this method relies solely on the time factor, you can not use this indicator to predict price volatility, but if it's fit correctly it will show you when the nex
This indicator is based on the crossing of two Moving Average with the RSI It is intended for scalpers Specially designed for Boom and Crash syhtetic indices from Binary.com/Deriv.com It is easy to use and intuitive. We recommend its use on M1 and is equipped with three types of notification Email alert Sound notification Push notification these parameters can be activated and deactivated.
IVISTscalp5
Vadym Zhukovskyi
5 (6)
[iVISTscalp5]:時間を通じた市場行動研究ラボ TLV Framework | Liquidity Activation Points ⸻ 概要 iVISTscalp5 は、VISTmany プロジェクトの一環として開発された、多層型のタイミングおよび価格構造インジケーターです。 このシステムは、Liquidity Activation Points(タイミング)を通じて、 動きが発生する時間 方向性 値動きの範囲 を予測します。 iVISTscalp5 インジケーターは、デフォルト設定のまま、あらゆる金融商品に使用できます。 ⸻ 実践的価値 iVISTscalp5 は、一般的なテクニカル指標として開発されたものではありません。 開発の中心的な理念は次の通りです。 あらゆる人が「時間」を通じて市場行動を研究できるようにすること。 ⸻ Time Language VISTmany (TLV) — プロジェクトの主要概念 t(p) t(p) は、タイミングが活性化する価格レベルです。 ⸻ p(p) p(p) は
This indicator is a scalping indicator intended solely for the Boom and Crash indices of the Deriv Limited market It supports Boom 500, Boom 1000, Crash 500 and Crash 1000 Not repaint and no bug The settings are intuitive and easy to use The product activation number is 20 The Time Frame used depends on the user If you are an aggressive scalper then just use M1 For long trades use M15 If you are conservative use M5 Please contact me for more details of its use
The Recuroid indicator shows very good entry points. Just look at the screenshots, then download the free version and look in the strategy tester and see for yourself. The system is based on two key algorithms. The first algorithm (managed) creates a system of balanced transition from the buy zone to the sell zone and vice versa, draws arrows and lines, and forms entries. The second algorithm (managing) corrects the initial data for the first algorithm (managed) by measuring virtual windows, t
Live broadcast of the indicator on YouTube. Please click on the link below for more credibility. There are also videos of the indicator that you can watch. Note that the broadcast is late, do not rely on it. Only a review of the indicator is only a review of the indicator’s accuracy, which does not lose almost and the profit rate reaches 95%. I will work with great accuracy on the CRASH coin 1000 INDICES
MMM Gold Sniper MT5
Gilang Wardhana Purnama Putra
Indicator is based on   Market Maker Strategy.   NO REPAINT. MM's are traders and their objective is to make money.  This includes strategies to trade against retails traders.  The major difference between them and other traders is that they have the ability, through access to massive volumes, to move price at their will.  So to make money, they aim to buy at a lower price and then sell at a higher price. They achieve this by:  1. Inducing traders to take positions. This is achieved by using a
Tatino Super Signals is Non Repaint Indicator for Binary Option trading and Forex trading. Recommendations: Timeframe: All timeframes. For best results we recommend using it on M1, M5 and M15 timeframes. Currency pairs: All Pairs Account type: All Type Broker time: Any Brokers : Alls Binary Trading : Expired 1 Candle Buffer Buy=1, Sell=0, Entry Next Candle Recommended Forex trading stop loss : 15 pips Recommended  Forex tradingTake profit levels : 15 pips Specifications: Does not repaint   Pa
Magicx
Hasan Abdulhussein
The indicator places a buy or sell signal when the conditions of the strategy it was designed with are met. The strategy is guaranteed, strong, and has been tested for 9 years. The indicator is for binary options and can be converted into a bot by linking it to MT2Trading, where it sends the signal to this platform. This platform automatically opens a trade on the trading platform you are using, whether it is Pocket Option, IQ Option, or any other binary options platforms. The entry is on the n
バイナリーオプションのインジケーターです。移動平均シグナル確認を使用して巻き込みローソク足を計算します。緑の買い矢印と赤の売り矢印がチャートに表示されます。 複数のペア(EUR/USD、EUR/JPY、USD/JPY...など)の3分足チャートと5分足チャートでテストされています。 EUR/JPY OTC や EUR/USD OTC などの Pocketoption OTC 市場でも機能します。 初心者向け、 マーチンゲールを使用している場合、推奨される設定は次のとおりです。 初期投資: $1.00 マーチンゲール乗数: 2.5 マーチンゲールステップ: 5 エキスパートトレーダーにとって、 マーチンゲールを使用する場合、初期投資はリスク管理戦略に従って決定されます。ただし、2.5 マルチプライヤーを強くお勧めし、ステップは 5 に維持します。 インジケーターはおそらく 5 番目のステップに到達しないでしょうが、インジケーターが売買できる余地をある程度与える必要があります。 添付のスクリーンショットをご覧ください。そして  ご質問がございましたら、お気軽にお問い合わせくだ
フィルタ:
レビューなし
レビューに返信