InitialBalance
- インディケータ
- バージョン: 1.2
- アップデート済み: 22 11月 2021
- アクティベーション: 5
InitialBalance. Universal business tool from professional traders that helps to visualize interest market situations. It previews markets using a price action and sentiment in the market. Tool necessary to understand the market situation and the anticipation of further movement. Finally, you will see how traders estimate the market.
Who knows the first steps in the market can estimate the point where the market will stop and reflect!
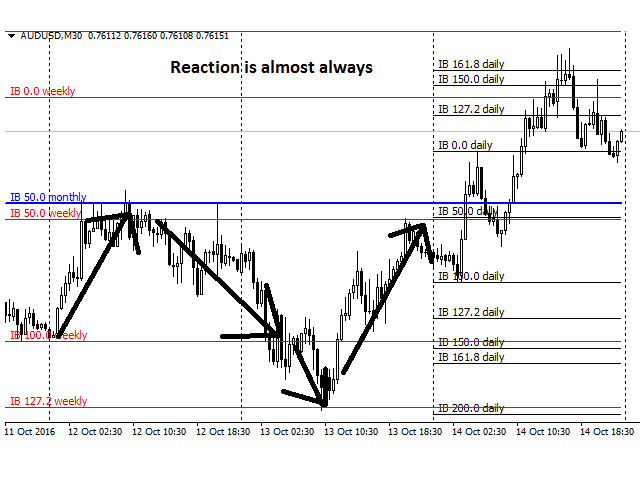
With this tool, you will see important supports and resistances. It shows you the entry of big players on the market.
The indicator works on all timeframes. You are not limited by use of different timeframes, the indicator is able to adapt. On the screenshots, you can see different views of InitialBalance and entrances to the market. The indicator contains basic settings. Please keep in mind that the use of more bars for calculation may lead to the program slowdown.
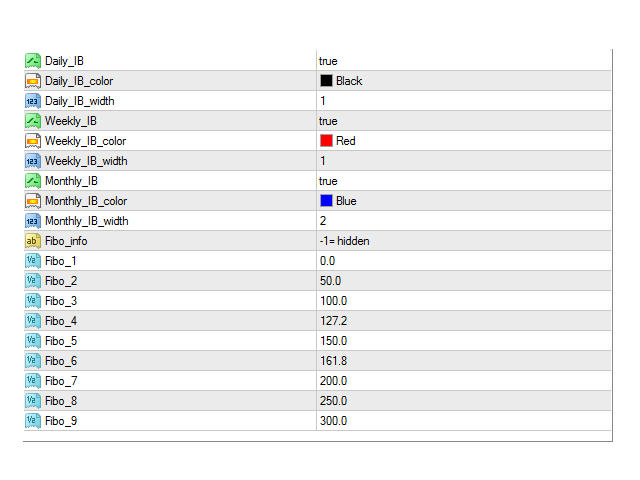
Settings:
- Daily IB=true – you will see daily IB
- Daily IB color – daily IB color
- Daily IB width=1 – daily IB width
- Weekly IB=true – you will see weekly IB
- Weekly IB color – weekly IB color
- Weekly IB width=1 – weekly IB width
- Monthly IB=true – you will see monthly IB
- Monthly IB color – monthly IB color
- Monthly IB width=2 – monthly IB width
- Fibo Info – do not change
- Fibo 1 - 9 – strong level of S/R