SMC Engine Matrix
- インディケータ
- バージョン: 1.0
- アクティベーション: 10

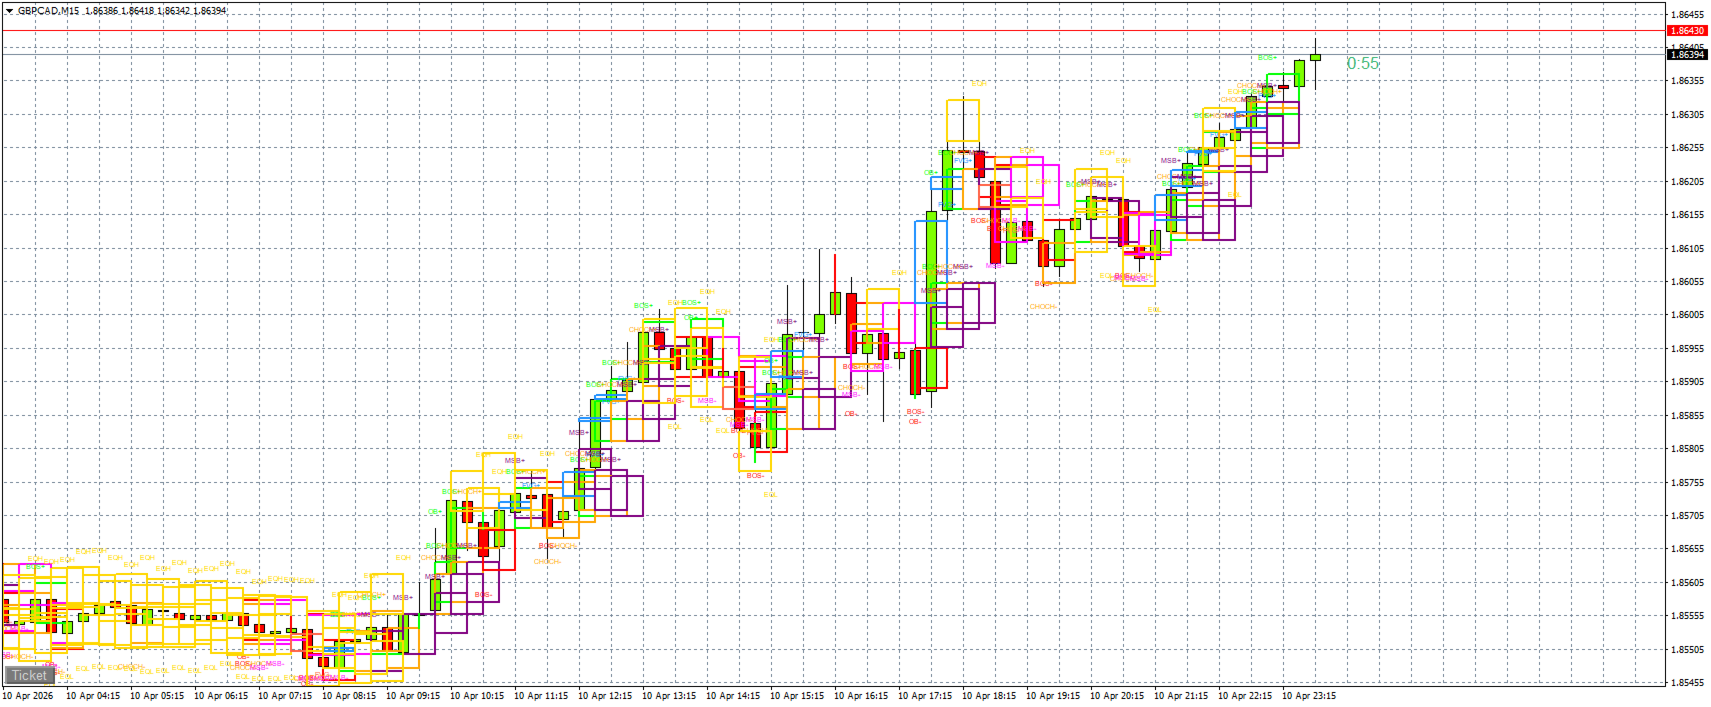
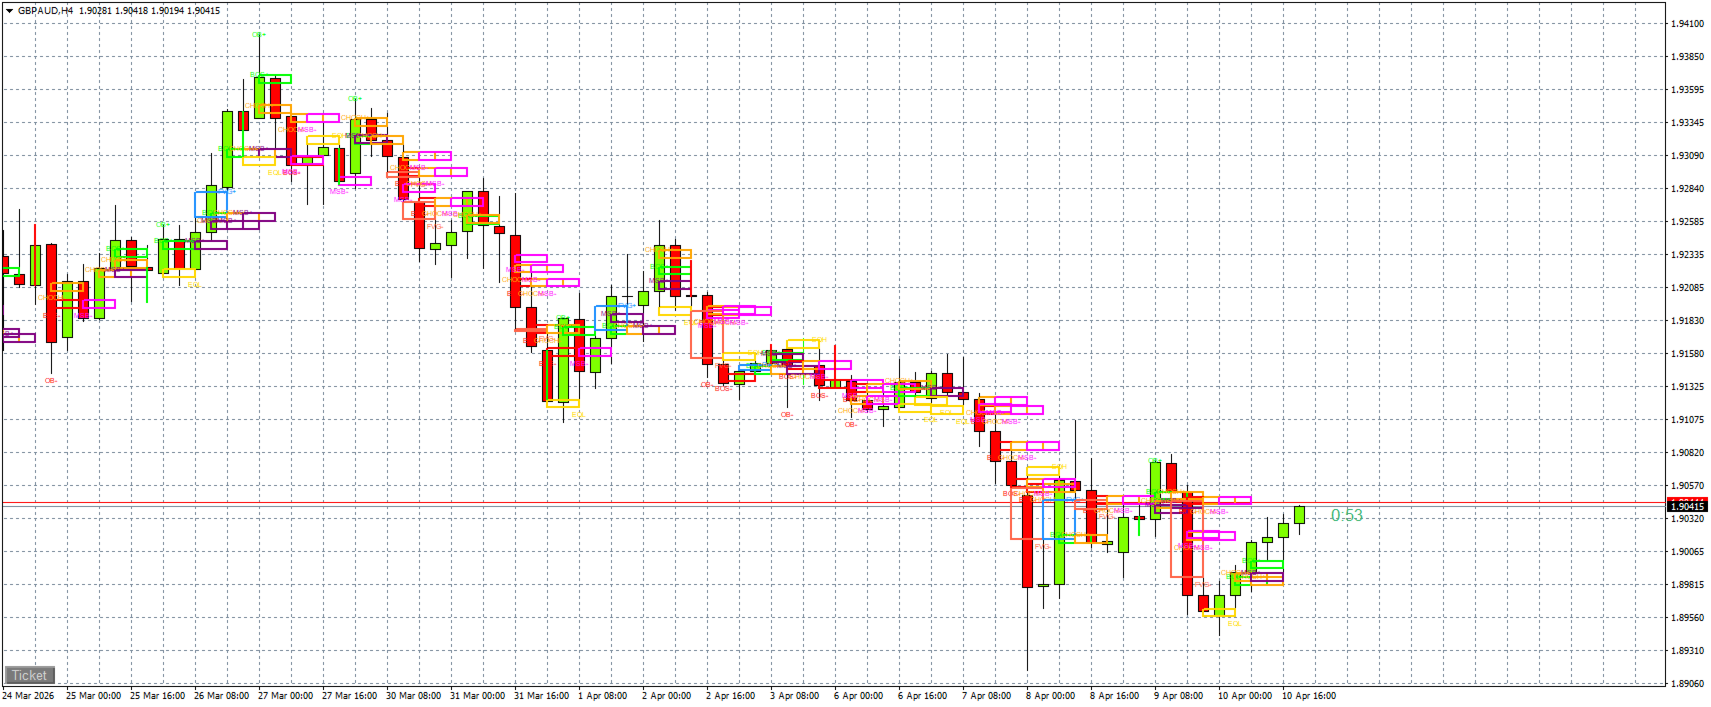
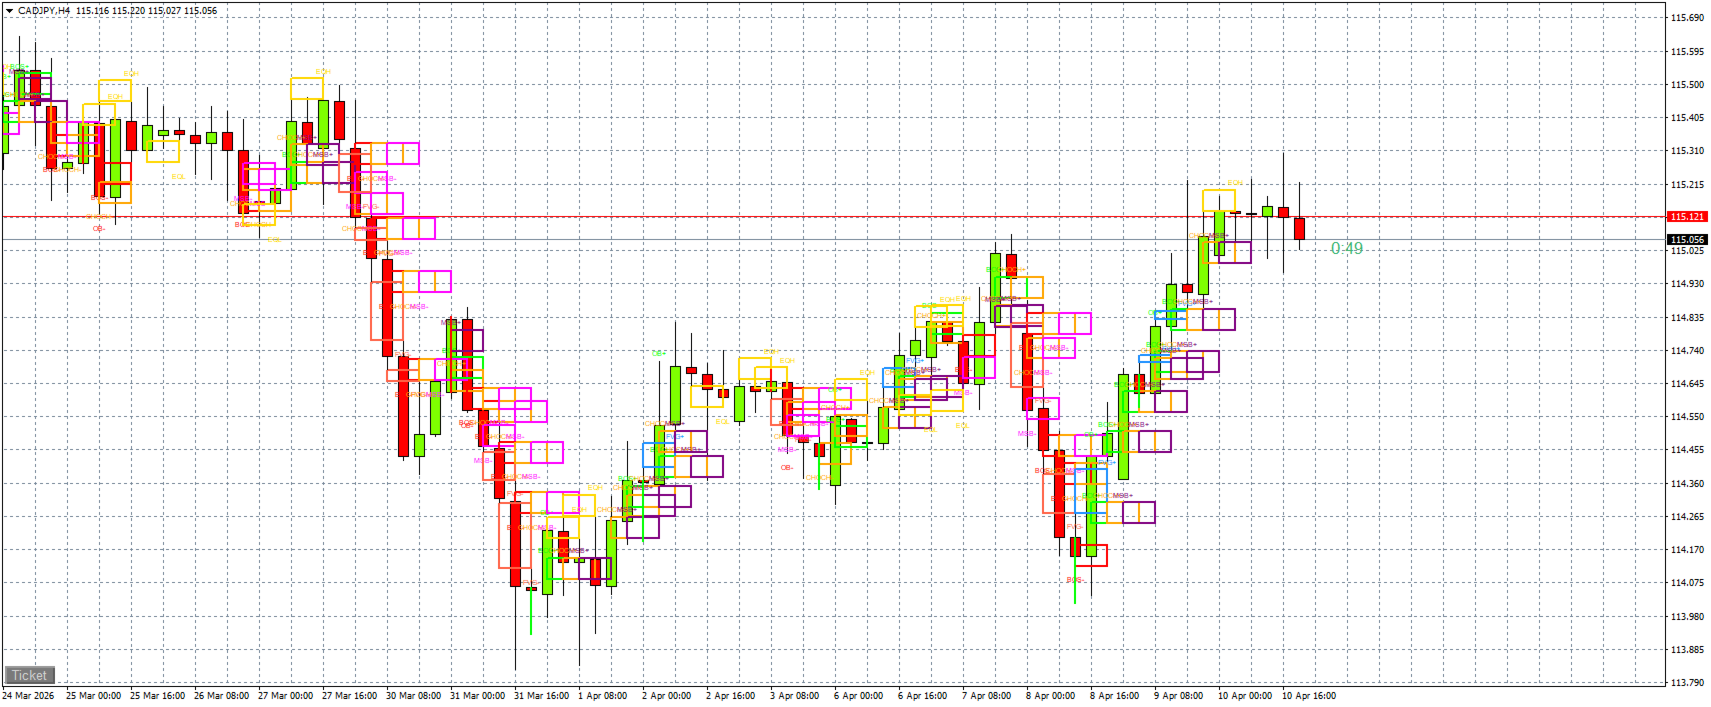
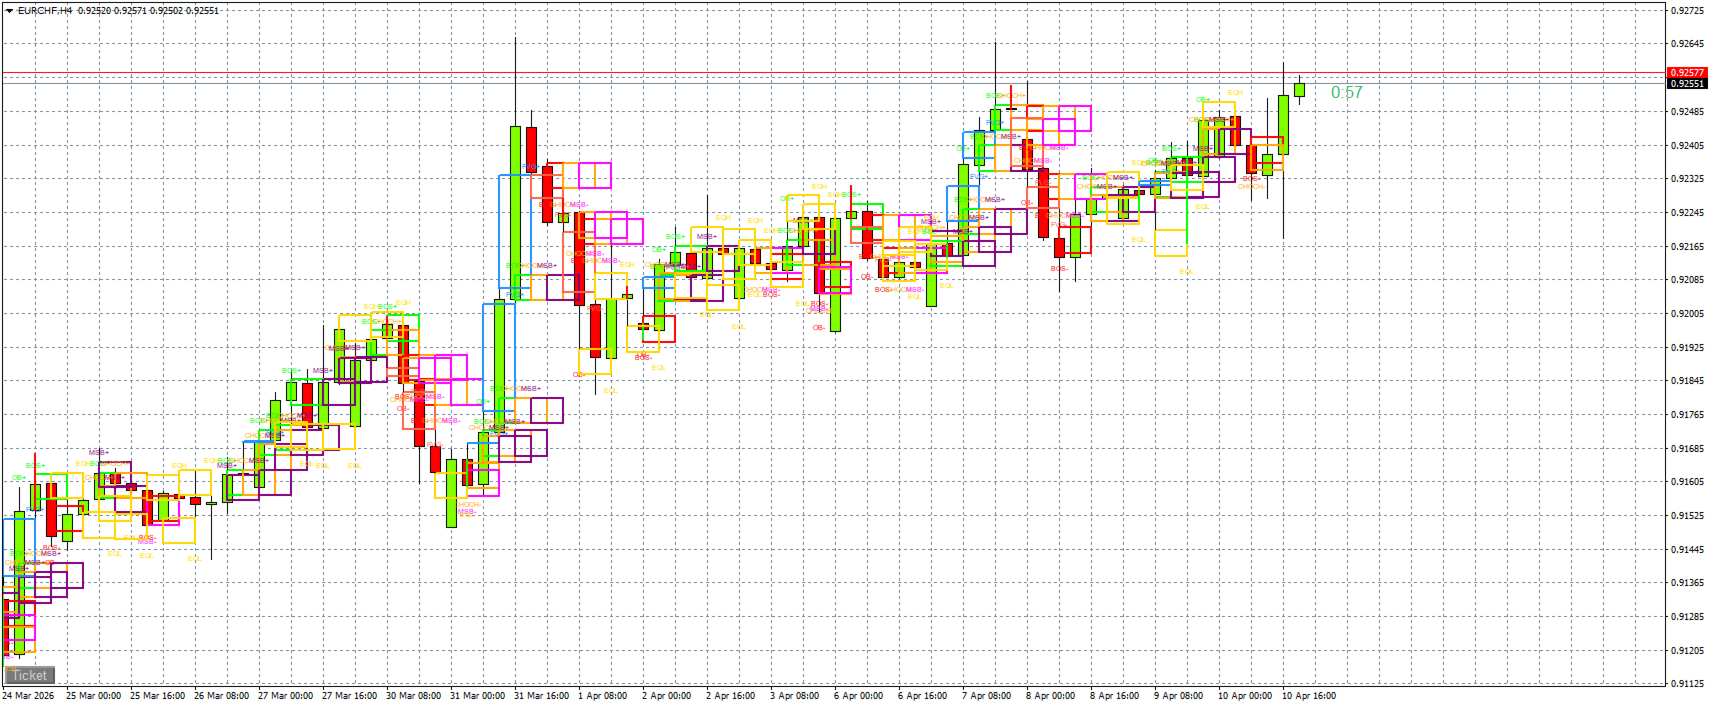
SMC PRO is a powerful and lightweight trading indicator designed to help traders identify key Smart Money Concepts (SMC) directly on the chart. Built for both beginners and advanced traders, it provides clear visual structures and real-time alerts to improve decision-making.
🚀 Key Features
✔ Fair Value Gaps (FVG)
Detects bullish and bearish imbalances in the market with clear zone visualization.
✔ Order Blocks (OB)
Automatically identifies institutional buying and selling zones.
✔ Break of Structure (BOS)
Highlights trend continuation points when structure is broken.
✔ Change of Character (CHOCH)
Detects early trend reversals and shifts in market behavior.
✔ Market Structure Break (MSB)
Advanced confirmation of structural changes.
✔ Liquidity Zones (EQH / EQL)
Find equal highs and lows where liquidity is likely resting.
🔔 Smart Alerts System
Get real-time alerts for every key event:
FVG (Buy / Sell)
Order Blocks (Buy / Sell)
BOS (Up / Down)
CHOCH (Trend Shift)
MSB (Structure Confirmation)
Liquidity (EQH / EQL)
No missed opportunities — stay informed instantly.
🎯 Visual Trading Made Simple
Clean chart visualization
Color-coded zones for instant recognition
Minimalistic and non-repainting logic
Adjustable font size and display options
⚙️ Fully Customizable
Enable or disable each feature individually:
FVG / OB / BOS / CHOCH / MSB / Liquidity
Alerts ON/OFF per signal
Custom colors for all elements