Chart Score AI Panel

Chart Score AI Panel

What is Chart Score AI Panel?

A real-time environment scoring panel that combines 6 technical elements into a single 0-100 score. It helps you quickly judge whether current chart conditions appear favorable for trading. Designed by a data analyst using statistical methods. Non-repainting. Works on all Forex pairs, Gold, indices, and crypto.

Do any of these sound familiar?

- You use several indicators such as EMA, RSI, ADX, and ATR, but still struggle to decide whether current chart conditions are worth trading.
- You enter a trade, only to see price reverse soon after, and wish you had filtered the setup more carefully.
- You trade during low-liquidity hours and get caught in weak or noisy conditions.

A common problem is that multiple technical signals remain disconnected. You can see each piece separately, but not the overall quality of the current environment.

Chart Score AI Panel helps solve that by combining multiple technical factors into a single 0-100 score. It is designed as a decision-support panel that helps you judge whether current conditions appear favorable, mixed, or unfavorable.

Despite the name containing "AI", this is not a self-learning AI. It is a transparent, rule-based scoring panel that quantifies and visualizes multiple technical elements. Scores are evaluated on closed bars for signal confirmation, and the panel is intended to be used together with your own trading rules.

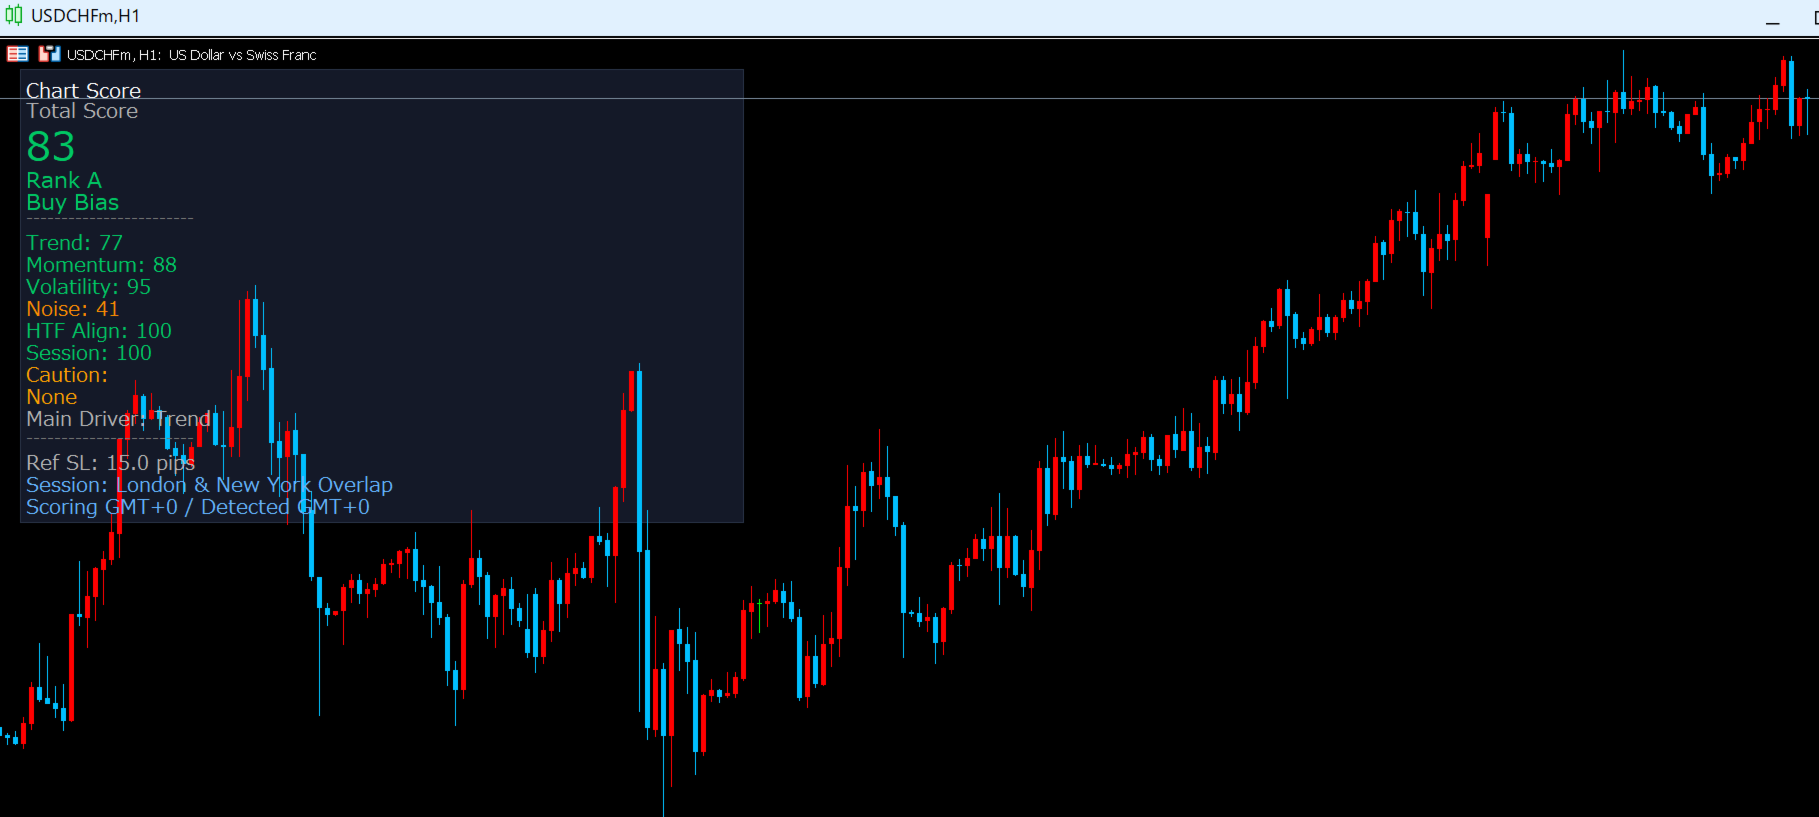
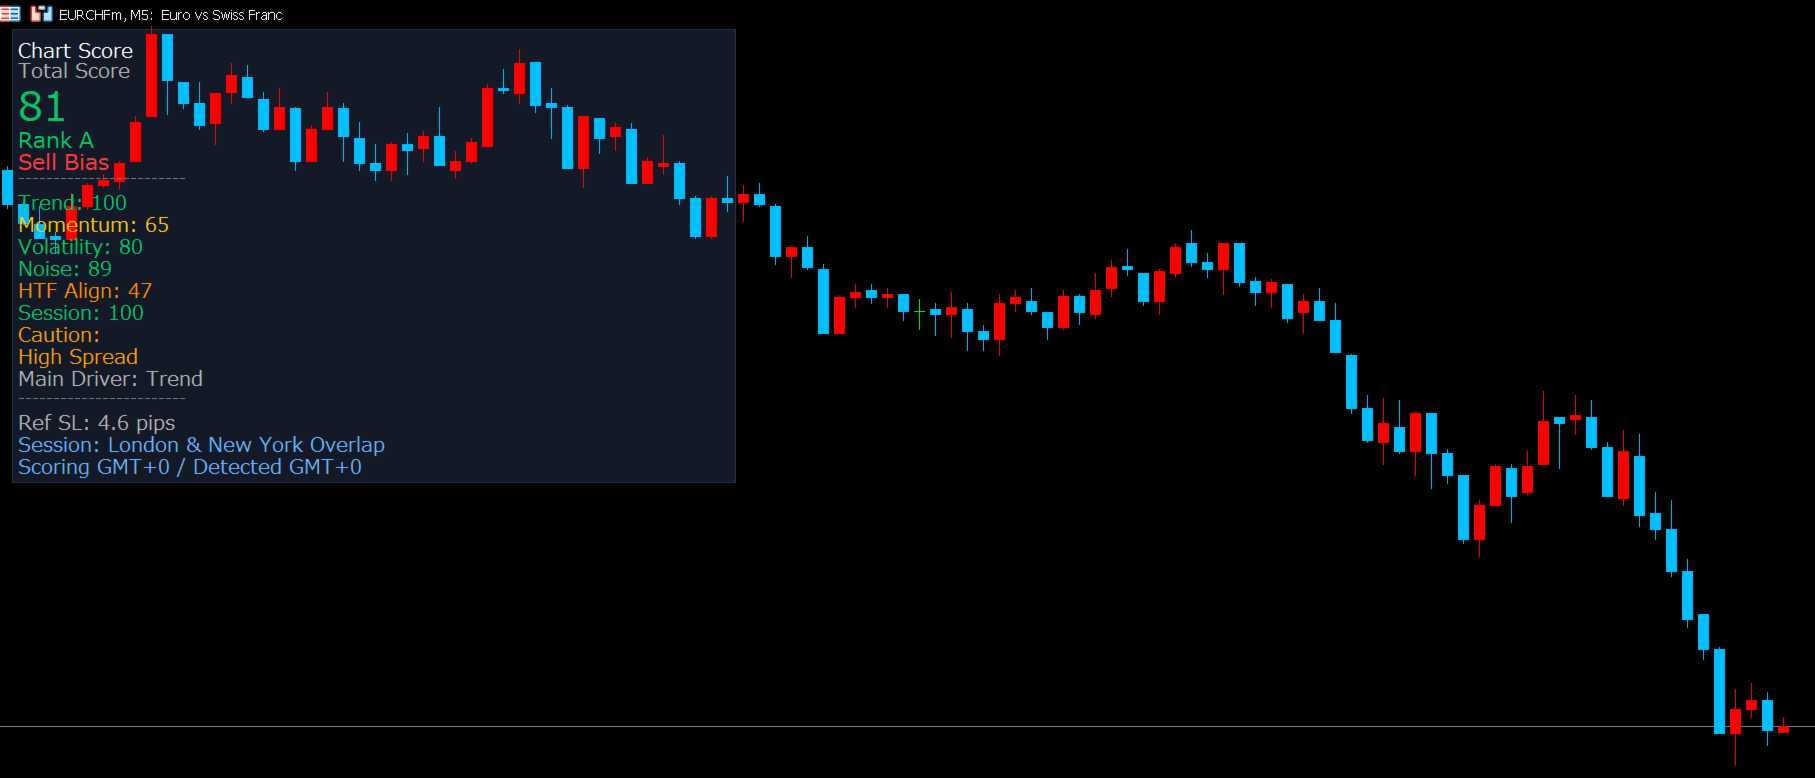
What the Panel Shows

When applied to a chart, the panel displays the following information:

Total Score (0-100) - A weighted score based on 6 technical elements.

Rank (A-E) - The total score grouped into 5 levels for quick reading.

Direction Signal - Displays Buy Bias, Sell Bias, or Neutral.

Detail Scores - Trend, Momentum, Volatility, Noise, HTF Align, and Session.

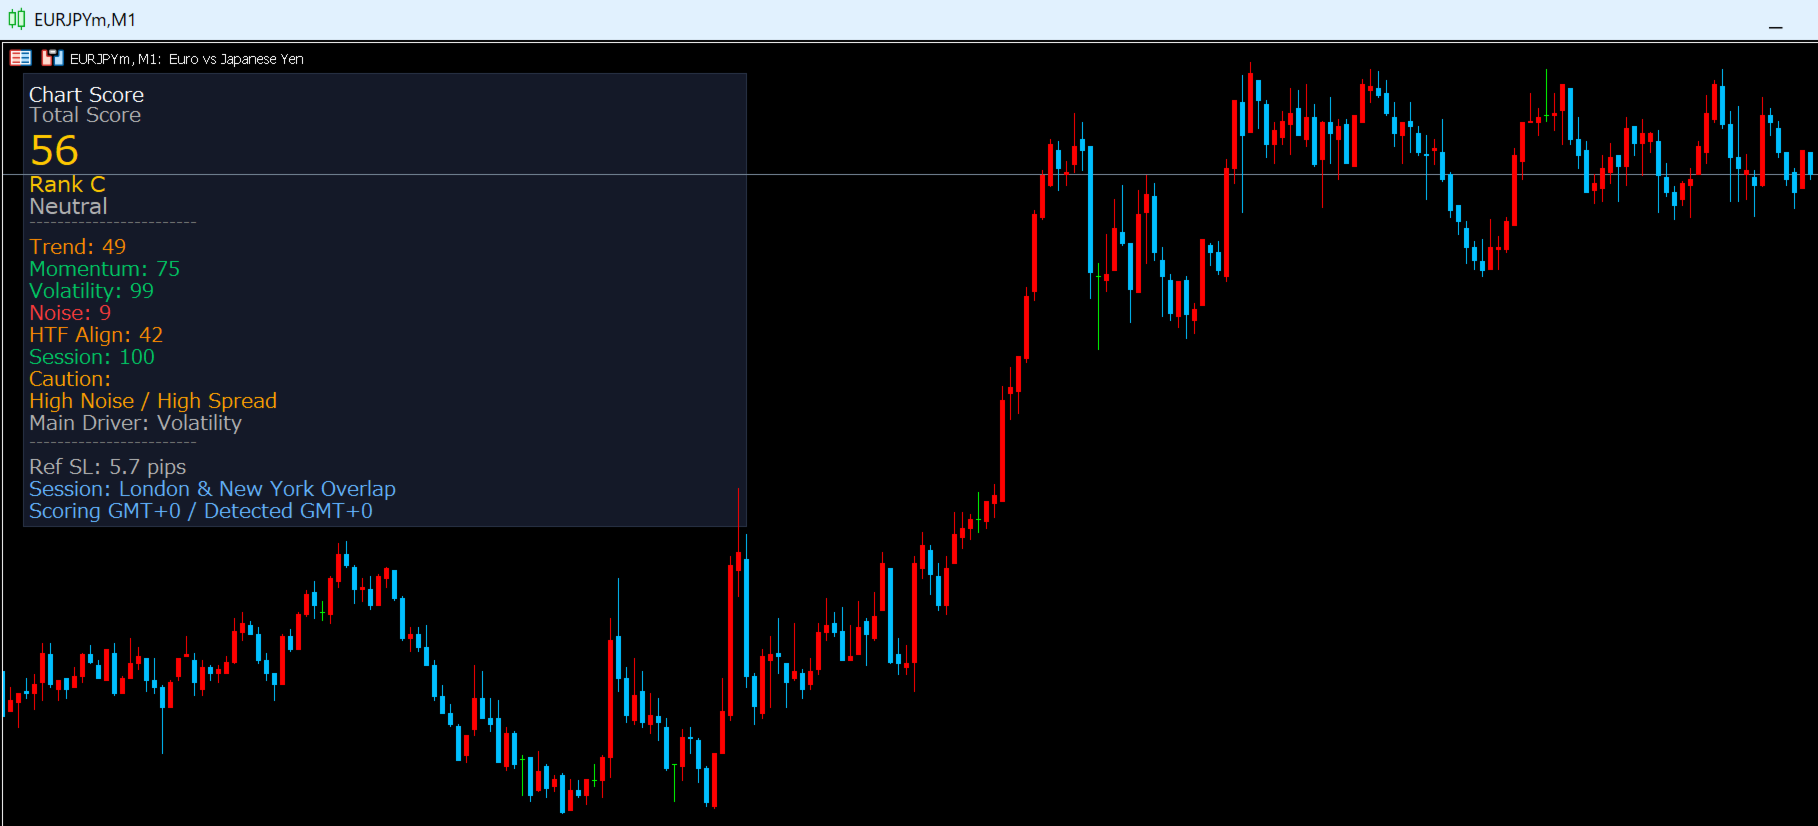
Caution Tags - Tags such as High Noise, Weak Trend, Low Vol, or Off-hours when conditions are weak.

Main Driver - Shows which component contributed most strongly to the current score.

Ref SL - A reference stop-loss distance based on ATR and noise conditions. Displayed in pips for Forex symbols and points for non-Forex symbols.

Session - Current session name, with GMT-based session evaluation.

How It Helps in Practice

Before:
- Entering because the chart "looks okay" without a clear quality filter
- Switching between multiple indicators and still feeling uncertain
- Taking setups during noisy or weak sessions that could have been filtered out

After:
- Checking one score first before spending time on detailed chart analysis
- Using low scores as a reason to skip weak conditions
- Focusing on pairs and sessions where conditions appear more organized

A Practical Example

Step 1: You open GBPUSD on H1 during the London session. The panel shows Score 78 / Rank B / Buy Bias.

Step 2: In detail view, Trend, Momentum, and Volatility are healthy, caution tags are minimal, and the overall environment appears organized.

Step 3: Your own entry rule is also satisfied. You consider a long setup and use the displayed Ref SL only as a reference for stop placement.

Step 4: Another pair shows a low score with caution tags such as High Noise or Weak Trend, so you decide to leave it alone and focus elsewhere.

This makes the panel useful as a quick filter: not to force trades, but to reduce entries during poor conditions.

6 Scoring Elements

The total score is calculated from the following 6 elements:

1. Trend (25%) - Uses EMA separation and ADX strength to estimate how clear the current trend is.
2. Momentum (15%) - Uses RSI in relation to the current directional bias.
3. Volatility (20%) - Compares current ATR to its recent average and penalizes conditions that are too quiet or excessively stretched.
4. Noise (15%) - Uses efficiency-style price movement analysis to estimate whether price action is clean or noisy.
5. HTF Align (15%) - Checks whether higher-timeframe EMA direction aligns with the current chart direction when HTF data is available.
6. Session (10%) - Adds session-based context for Forex symbols when session adjustment is enabled.

Rank Guide

Rank A (80-100) - Conditions appear favorable.
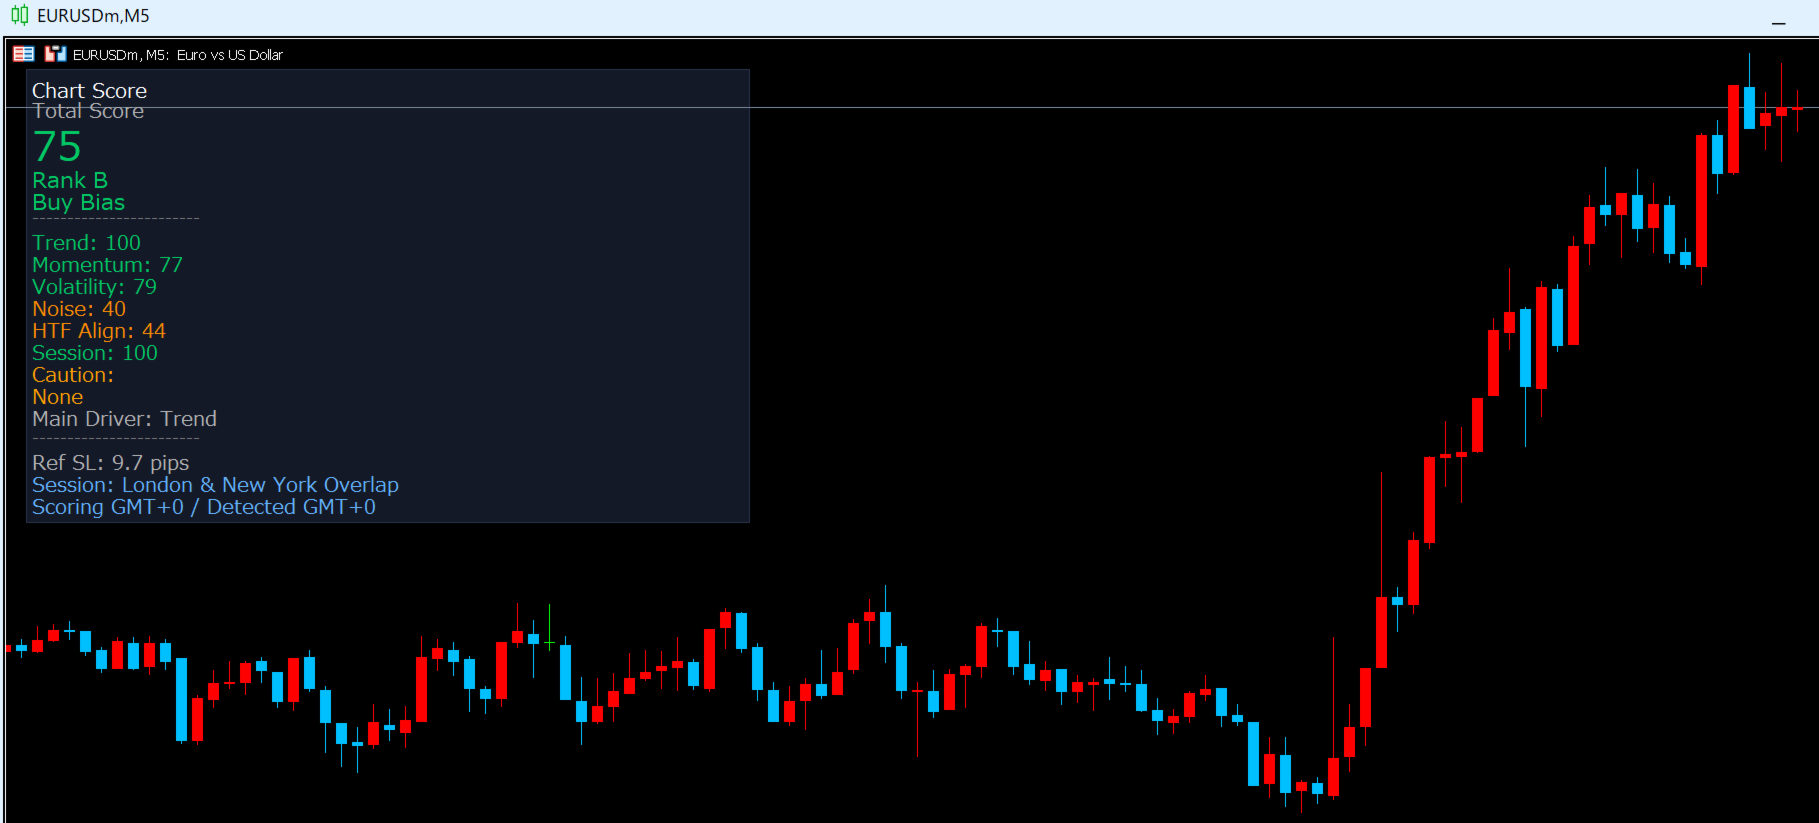
Rank B (65-79) - Conditions are relatively good.
Rank C (50-64) - Mixed conditions.
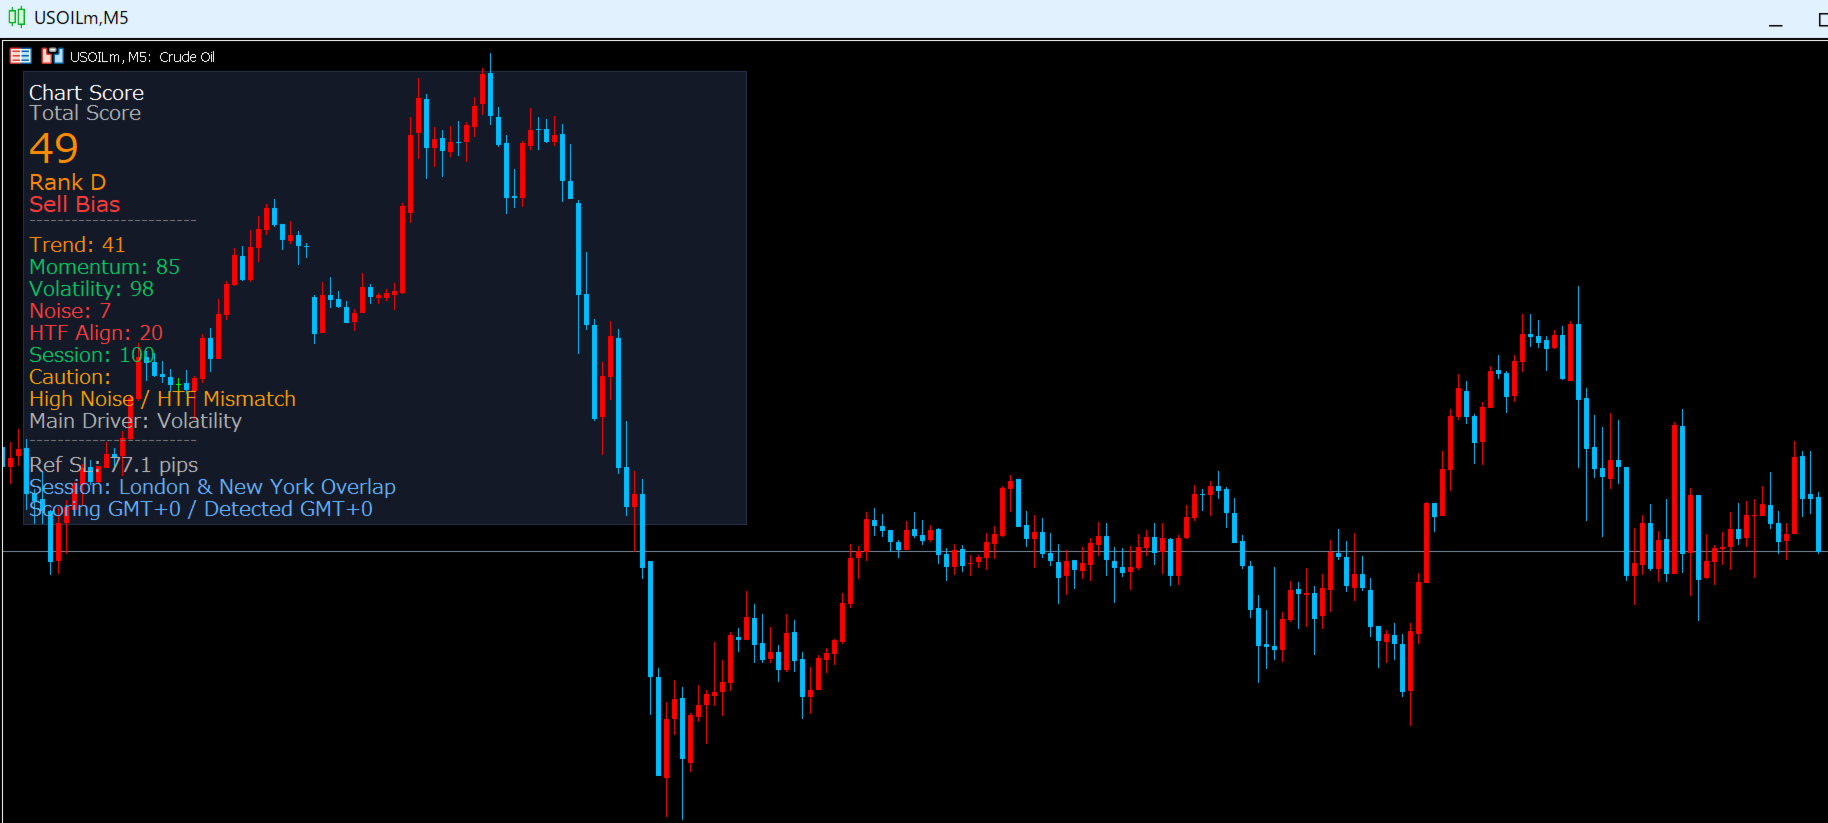
Rank D (35-49) - Unfavorable conditions.
Rank E (0-34) - Poor conditions.

The panel is especially useful as a filter: low scores can help you avoid spending time on weak setups.

Signal Logic

The panel shows one of three direction states:

Buy Bias - Current directional conditions lean bullish.
Sell Bias - Current directional conditions lean bearish.
Neutral - No meaningful directional bias is detected.

This is a directional assessment, not a standalone entry signal.

Session Handling

For Forex symbols, the panel evaluates session conditions using GMT-based time windows with DST-aware handling for London and New York.

Typical session categories are:

Tokyo
London
New York
London & New York Overlap
Off-hours

For non-Forex symbols, session scoring is disabled automatically and shown as not applicable.

Who This Is For

Recommended for:
- Traders who want a clearer environment filter before entering
- Traders using multiple indicators and wanting a single summary score
- Traders who want a practical reason to skip low-quality setups
- Traders who want to combine chart analysis with a structured scoring panel

Not recommended for:
- Those looking for a fully automated Expert Advisor
- Those expecting guaranteed results from one indicator alone
- Those who want simple arrow-only entry signals without context
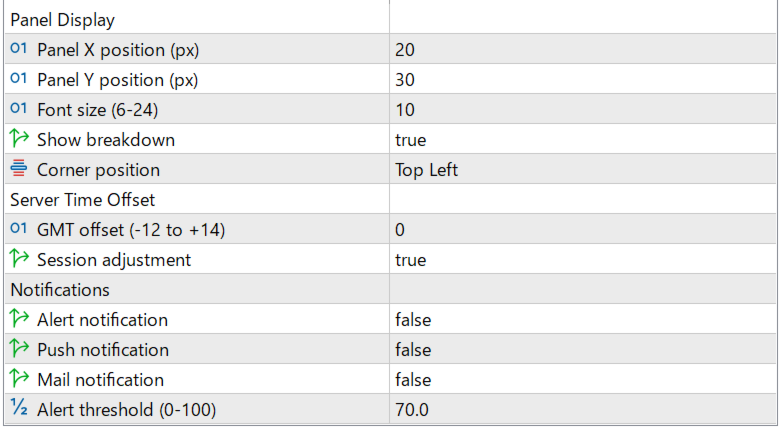
Parameters

Panel Display

PanelX (default: 20) - Horizontal panel position in pixels.
PanelY (default: 30) - Vertical panel position in pixels.
FontSize (default: 10, range: 6-24) - Panel text size.
ShowDetails (default: true) - Shows or hides the detailed component breakdown.
CornerPos (default: Top Left) - Panel anchor corner.

Server Time Offset

ServerGMTOffset (default: 3, range: -12 to +14) - Difference between broker server time and GMT, used for session evaluation.
SessionAdj (default: true) - Enables or disables session-based score adjustment. Automatically treated as not applicable for non-Forex symbols.

Notifications

AlertEnabled (default: false) - MT5 alert notification.
PushEnabled (default: false) - Push notification to the MT5 mobile app.
MailEnabled (default: false) - Email notification via MT5 mail settings.
AlertThreshold (default: 70.0, range: 0-100) - Threshold used for score-based notifications.

Notifications are checked on confirmed bars. They can fire when the score crosses above the threshold, or when a previously non-neutral signal reverses between Buy Bias and Sell Bias.

FAQ

Q: The panel does not appear.
A: The chart needs enough history for EMA, ATR, RSI, and ADX calculations. If there is not enough history, the panel will display a loading/error message. Also check that PanelX and PanelY are not placing the panel off-screen.

Q: Notifications are not working.
A: Make sure AlertEnabled, PushEnabled, or MailEnabled is turned on. Push notifications require MetaQuotes ID configuration, and email requires SMTP setup in MT5. Notifications are checked on confirmed bars only.

Q: Which timeframe should I use?
A: The indicator supports multiple timeframes. On Monthly charts, the HTF component may be unavailable because there is no higher mapped timeframe.

Q: Does it work on XAUUSD and non-Forex symbols?
A: Yes. The indicator supports Forex and non-Forex symbols. For non-Forex symbols, session scoring is disabled automatically, and Ref SL is displayed in points instead of pips.

Q: Does it repaint?
A: The panel is designed to confirm signals and notifications on closed bars. Once a bar is closed, those confirmed results do not change retroactively.

Q: Can I trade using only the score?
A: This indicator is a decision-support tool, not a complete trading system. It is best used as a filter together with your own entry and risk-management rules.

Key Features

- Real-time 0-100 score
- A-E rank display
- Buy Bias / Sell Bias / Neutral signal
- Detail mode for all 6 scoring elements
- Caution tags for weak conditions
- Main Driver display
- ATR-based Ref SL display
- GMT-based session handling with DST-aware London/New York overlap logic
- Alert, push, and email notifications on confirmed bars
- Supports Forex and non-Forex symbols including XAUUSD
- Supports multiple timeframes, from M1 to MN
- No DLL required

About the Developer

Designed and developed by a data analyst with a statistics-focused background.

Unlike typical arrow-signal indicators, this tool is built as an environment assessment panel. Its purpose is to help quantify whether current market conditions appear favorable, mixed, or weak before you apply your own trading rules.

Concept: Data-driven decisions, not gut feelings.

Disclaimer

This indicator does not provide investment advice. Scores, ranks, signals, and Ref SL values are reference information based on technical analysis and do not guarantee future market behavior. All trading decisions are made at the user's own risk. The author assumes no liability for losses incurred through the use of this indicator.

おすすめのプロダクト
Price Magnet — Price Density and Attraction Levels Indicator Price Magnet is a professional analytical tool designed to identify key support and resistance levels based on statistical Price Density. The indicator analyzes a specified historical period and detects price levels where the market spent the most time. These zones act as “magnets,” attracting price action or forming a structural base for potential reversals. Unlike traditional Volume Profile tools, Price Magnet focuses on price-time d
Order Book, known also as Market Book, market depth, Level 2, - is a dynamically updated table with current volumes of orders to buy and to sell specific financial instument at price levels near Bid and Ask. MetaTrader 5 provides the means for receiving market book from your broker, but in real time only, without access to its history. The indicator OrderBook Cumulative Indicator accumulates market book data online and visualizes them on the chart. In addition, the indicator can show the market
Follow The Line MT5
Oliver Gideon Amofa Appiah
4.6 (35)
This indicator obeys the popular maxim that: "THE TREND IS YOUR FRIEND" It paints a GREEN line for BUY and also paints a RED line for SELL. (you can change the colors). It gives alarms and alerts of all kinds. IT DOES NOT REPAINT and can be used for all currency pairs and timeframes. Yes, as easy and simple as that. Even a newbie can use it to make great and reliable trades. NB: For best results, get my other premium indicators for more powerful and reliable signals. Get them here: https://www.m
FREE
Crash 1000 Scalping Indicator for the Crash 1000 Deriv Synthetic Index. Introduction The Crash 1000 Scalping Indicator is a specialized tool designed for the Crash 1000 index on the Deriv Synthetic market. This indicator is particularly useful for scalping on the M1 timeframe, helping traders to identify precise entry and exit points for buy positions. It is designed to be non-repainting, providing clear signals with audible alerts and push notifications, and is compatible with mobile devices th
Was: $249  Now: $99   Market Profile defines a number of day types that can help the trader to determine market behaviour. A key feature is the Value Area, representing the range of price action where 70% of trading took place. Understanding the Value Area can give traders valuable insight into market direction and establish the higher odds trade. It is an excellent addition to any system you may be using. Inspired by Jim Dalton’s book “Mind Over Markets”, this indicator is designed to suit the
CosmiCLab SMC FIBO CosmiCLab SMC FIBO is a professional trading indicator designed for traders who use Smart Money Concepts (SMC), market structure analysis and Fibonacci retracement levels. The indicator automatically detects market swings and builds Fibonacci levels based on the latest impulse movement. It also identifies market structure changes such as BOS (Break of Structure) and CHOCH (Change of Character), helping traders understand the current market direction. CosmiCLab SMC FIBO also pr
Fvg Edge
Ahmad Meftah Abdulsalam Alawwami
5 (2)
FVG Smart Zones – 無料版 MetaTrader 5 (MT5)用 公正価値ギャップ(FVG)検出インジケーター ただのランダムなインジケーターではなく、 本格的なトレーディングツール をお探しですか? FVG Smart Zones – 無料版 は、公正価値ギャップ(FVG)を自動で検出し、チャート上に 高確率トレーディングゾーン をハイライトして、プロフェッショナルな市場の洞察を提供します。 以下のトレーダー向けに設計されています: スマートマネーコンセプト (SMC) ICTトレーディングコンセプト プライスアクション (Price Action) 需給分析 (Supply & Demand) 機関投資家向けトレーディング戦略 このインジケーターは、 価格が反応しやすいゾーン に集中するのを助けます。 主な機能 スマートゾーン検出 上昇・下降FVGの自動検出 クリーンでプロフェッショナルなビジュアルゾーン 弱い、または関連性の低いギャップを除去するインテリジェントフィルター 高度な確認機能 上位時間軸(HTF)
FREE
AP VWAP Bands Pro (MT5) Volume-weighted average price with ±σ bands for clear intraday bias, mean-reversion zones, and dynamic support/resistance. Works on crypto (incl. BTC) , FX , indices , and metals . Uses tick-volume when real volume isn’t available. What it shows VWAP line (volume-weighted mean price). Two envelopes around VWAP (default ±1σ and ±2σ) to highlight balance vs. extension. Reset modes : Day , Week , or Anchor Time (HH:MM) to start VWAP where you need it (e.g., exchange open).
FREE
SMC Venom Model BPR インジケーターは、スマート マネー (SMC) コンセプトで取引するトレーダー向けのプロフェッショナル ツールです。価格チャート上の 2 つの主要なパターンを自動的に識別します。 FVG   (フェアバリューギャップ) は、3 本のローソク足の組み合わせで、最初のローソク足と 3 番目のローソク足の間にギャップがあります。ボリュームサポートのないレベル間のゾーンを形成し、価格修正につながることがよくあります。 BPR   (バランス価格範囲) は、2 つの FVG パターンの組み合わせで、「ブリッジ」を形成します。これは、価格がボリュームアクティビティの少ない動きで動くときに、ブレイクアウトしてレベルに戻るゾーンで、ローソク足の間にギャップを作成します。 これらのパターンは、大規模な市場プレーヤーと一般参加者の相互作用が発生するチャート上のボリュームと価格動向の分析に基づいて、トレーダーが主要なサポート/レジスタンス レベル、ブレイクアウト ゾーン、エントリ ポイントを識別するのに役立ちます。 インジケーターは、長方形と矢印の形でパターンを視覚
Value Chart Candlesticks
Flavio Javier Jarabeck
4.57 (14)
The idea of a Value Chart indicator was presented in the very good book I read back in 2020 , " Dynamic Trading Indicators: Winning with Value Charts and Price Action Profile ", from the authors Mark Helweg and David Stendahl. The idea is simple and the result is pure genius: Present candlestick Price analysis in a detrended way! HOW TO READ THIS INDICATOR Look for Overbought and Oversold levels. Of course, you will need to test the settings a lot to find the "correct" one for your approach. It
FREE
Trading Room Indicator is a professional market-structure tool built to give traders a clear, complete trading framework — combining CPR levels, dynamic targets, and trend direction in one clean view. Instead of guessing direction or overloading the chart with indicators, Trading Room Indicator focuses on what actually matters : levels, direction, and potential price expansion. What This Indicator Provides CPR Structure BUY level SELL level Pivot Point (PP) Designed to highlight equilibrium
CCI FIXED DUALとは何か CCI FIXED DUALは、プロフェッショナル向けのTrend Direction Filterであり、次の要素を正確に識別するために設計されています。 市場の支配的な方向 値動きの構造的な質 メイントレンドと加速局面との一貫性 これは直接的なエントリー指標ではありません。 これはクラシックなオシレーターではありません。 これはコンテキストツールであり、トレーダーがいつ取引すべきか、そしていつ取引すべきでないかを判断するのを助け、市場のノイズと解釈ミスを大幅に減らすために設計されています。 CCI FIXED DUALの基本哲学 CCI FIXED DUALが基づいている原則はシンプルですが非常に強力です。 シグナルは、市場構造と一貫している場合にのみ価値を持ちます。 この理由から、このインジケーターは 単一の値を使用しません 価格に衝動的に反応しません 無理に反転ポイントを探しません その代わりに、次の要素に基づいて階層的なトレンドの読みを構築します。 Typical Price上のCCI 異なる速度のLWMA移動平均 短期 中期 長期の動的
Noize Absorption Index - is the manual trading system that measures the difference of pressure between bears forces and bulls forces. Green line - is a noize free index that showing curent situation. Zero value of index shows totally choppy/flat market.Values above zero level shows how powerfull bullish wave is and values below zero measures bearish forces.Up arrow appears on bearish market when it's ready to reverse, dn arrow appears on weak bullish market, as a result of reverse expectation.
Monitor your order
Eslam Mohamed Hassanein Hassan Aly
Advanced Lot & Profit Monitor PRO is a powerful MT5 indicator that provides real-time monitoring of your trading positions directly on the chart. It displays the number of orders, total lot sizes, and profit (including swap) for Buy and Sell positions separately, as well as the overall account performance. Designed with a clean and customizable interface, this tool helps traders stay in control of their exposure and risk at all times. Key Features: Real-time monitoring of open positions Sepa
HAS RSI Signal — SL/TP自動計算機能付き プロフェッショナル・トレンドインジケーター HAS RSI Signal は、信頼性の高いクラシックな手法と最新のノイズ除去アルゴリズムを融合させた強力なトレーディングツールです。 平均足スムーズド(Heiken Ashi Smoothed) と RSI を組み合わせることで、トレンドの転換点や買われすぎ・売られすぎ圏からの脱出タイミングを正確に捉え、明確なエントリーシグナルを提示します。 主な特徴: 二重のフィルタリング: 平均足スムーズドで市場の「ノイズ」を除去し、RSIで勢い(モメンタム)の強さを確認します。 損切り・利確ラインの自動計算: 単にシグナルを出すだけでなく、ボラティリティ( ATR )に基づいた最適なストップロス(SL) と テイクプロフィット(TP)を自動で算出します。 視覚的な分かりやすさ: シグナルはチャート上にカラーキャンドルとして表示されるため、一目でトレンドを把握でき、取引画面をスッキリと保てます。 充実の通知機能: アラート、音声、スマートフォンへのプッシュ通知機能を搭載。チャンスを逃すこと
インディケータは現在のクオートを作成し、これを過去のものと比較して、これに基づいて価格変動予測を行います。インジケータには、目的の日付にすばやく移動するためのテキスト フィールドがあります。 オプション: シンボル - インジケーターが表示するシンボルの選択; SymbolPeriod - 指標がデータを取る期間の選択; IndicatorColor - インジケータの色; HorisontalShift - 指定されたバー数だけインディケータによって描画されたクオートのシフト; Inverse - true は引用符を逆にします。false - 元のビュー。 ChartVerticalShiftStep - チャートを垂直方向にシフトします (キーボードの上下矢印)。 次は日付を入力できるテキストフィールドの設定で、「Enter」を押すとすぐにジャンプできます。
Wapv Price and volume
Eduardo Da Costa Custodio Santos
MT5のWAPV価格と出来高インジケーターは、(Wyckoff Academy Wave Market)および(Wyckoff Academy Price and Volume)ツールセットの一部です。 MT5のWAPV価格および出来高インジケーターは、チャート上の出来高の動きを直感的な方法で簡単に視覚化できるように作成されました。 それを使用すると、ピークボリュームの瞬間と市場が専門家の関心を持たない瞬間を観察することができます 「スマートマネー」の動きではなく、慣性によって市場が動いている瞬間を特定します。 ユーザーが変更できる4色で構成されています。 赤=オファーの増加 緑=需要の増加 灰色のキャンドル=需要と供給の減少 青=スマートマネー演技 上方向への動きは強さを示します。 下向きの動き弱さを示します。 価格の方向に関係なく、最強のボリュームが上がる必要があります。 R.Wyckoffの理論に基づいて作成されたインジケーター
# DRAWDOWN INDICATOR V4.0 - The Essential Tool to Master Your Trading ## Transform Your Trading with a Complete Real-Time Performance Overview In the demanding world of Forex and CFD trading, **knowing your real-time performance** isn't a luxury—it's an **absolute necessity**. The **Drawdown Indicator V4.0** is much more than a simple indicator: it's your **professional dashboard** that gives you a clear, precise, and instant view of your trading account status. --- ## Why This Indicator
RBreaker Gold Indicatorsは、金先物の短期日内取引戦略であり、トレンドフォローと日内反転の2つの取引手法を組み合わせたものです。トレンド相場での利益を捉えるだけでなく、相場が反転した際には迅速に利確し、その流れに沿ってポジションを反転させることができます。 この戦略は、アメリカの雑誌『Futures Truth』において、15年連続で最も収益性の高い取引戦略トップ10に選ばれた実績を持ち、非常に長いライフサイクルを誇り、現在も国内外で広く使用・研究されています。 本インディケーターは、2026年の金先物の値動きに対応し、14日間のATR指標に基づいて、ブレイクアウト係数A、観察係数B、リバーサル係数Rをより合理的な値で定義しています。非常に優れたインディケーターであり、安定的な年間収益を実現しています。ぜひおすすめします〜
Caicai L&S Yield Histogram Important Notice: This indicator is an integral tool of the automated EA Caicai Long and Short Pair Trading . This indicator visually displays the percentage deviation (Yield %) of a pair's current spread relative to its own historical mean. It is an excellent tool for quickly visualizing the gross financial potential of a market distortion in Long & Short operations. Main Features: Percentage Visualization: Understand the size of the distortion in palpable percentage
概要 このインジケーターは、クラシックな ドンチャンチャネル を強化したバージョンで、実践的なトレード機能を追加しています。 標準の3本線(上限、下限、中央線)に加え、 ブレイクアウト を検出し、チャート上に矢印で視覚的に表示します。また、チャートを見やすくするために、 現在のトレンド方向と逆側のラインのみを表示 します。 インジケーターの機能: 視覚的シグナル :ブレイクアウト時にカラフルな矢印を表示 自動通知 :ポップアップ、プッシュ通知、Eメール RSIフィルター :市場の相対的な強弱に基づいてシグナルを検証 カスタマイズ可能 :色、ラインの太さ、矢印コード、RSI閾値など 動作原理 ドンチャンチャネルは次のように計算します: 上限線 :直近N本のクローズ済みローソク足の最高値 下限線 :直近N本のクローズ済みローソク足の最安値 中央線 :最高値と最安値の平均値 上方ブレイクアウト は終値が上限線を超えたときに発生し、 下方ブレイクアウト は終値が下限線を下回ったときに発生します。 インジケーターは以下を行います: 3本のドンチャンラインを描画 方向転換後の最初のブレイクアウト
FREE
Binary Options Assistant (BOA) Multi Currency Dashboard for Binary Options (MT5) . You can use any of the BOA Signals Indicators with the dashboard. Just change the BOA Signals Indicator Name in the dashboard settings to the indicator you want to get signals from. For example: CHILL. BLAZE:  BOA_BLAZE_Indicator_v1   Strategy :   BLW Online Trading Binary Options Strategy (3 Moving Average) LAVA:  BOA_LAVA_Indicator_v1   Strategy:   Lady Trader Binary Options Strategy (Bollinger Bands & Stochas
Trend Indicator Multi-timeframe trend scoreboard with box system, ATR impulse arrows and automatic score for MetaTrader 5. Panel Position The scoreboard panel can be freely positioned in the chart using X and Y coordinates. Parameter Default Description X 260 Horizontal position of the panel (pixels from left) Y 25 Vertical position of the panel (pixels from top) Timeframes The scoreboard displays three columns. Each column can be set to any timeframe independently. Parameter Default Descri
Fibo Daily Channel Indicator The  Indicator is a powerful tool for traders, providing precise daily support and resistance levels based on Fibonacci retracement and extension calculations. This indicator automatically draws key pivot points (PP, R1, R2, S1, S2) as well as additional extension levels (R3, R4, S3, S4), helping traders identify potential reversal and breakout zones with ease. It includes customizable alerts and push notifications, allowing traders to receive updates whenever the pr
Range Directional Force Indicator – Designed for You to Optimize! The Range Directional Force Indicator is a cutting-edge tool designed to empower traders by visualizing market dynamics and directional strength. Built to offer insights into market trends and reversals, this indicator is an invaluable asset for traders seeking precision in their strategies. However, it is important to note that this indicator is not optimized, leaving room for you to tailor it to your unique trading preferences.
Deriv Synthetic HTF Candle Projection GMT2 Higher Timeframe Candle Projection & Previous Levels Tool for Deriv Synthetic Indices (MT5) Overview Deriv Synthetic HTF Candle Projection GMT2 is a professional MetaTrader 5 indicator built specifically for Deriv Synthetic indices . It projects the current forming Higher Timeframe (HTF) candle onto the chart and automatically draws key reference levels from previous candles. This indicator is designed to help traders maintain higher timeframe context
FREE
The indicator analyzes the volume scale and splits it into two components - seller volumes and buyer volumes, and also calculates the delta and cumulative delta. The indicator does not flicker or redraw, its calculation and plotting are performed fairly quickly, while using the data from the smaller (relative to the current) periods. The indicator operation modes can be switched using the Mode input variable: Buy - display only the buyer volumes. Sell - display only the seller volumes. BuySell -
FREE
TRI Visualizer Enhanced - 熱力学的市場分析の革命 概要 TRI(Thermal Range Indicator)Visualizer Enhanced は、従来のテクニカル分析を超越した、物理学の熱力学理論を応用した革新的なマーケット分析インジケーターです。市場の価格変動を「熱力学的エネルギー」として捉え、これまで見落とされていた市場の微細な変化を高精度で検出します。 革新的な仕組み 1. デュアル計算エンジン クラシックTRIモード 基本公式: |終値-始値| + (高値-安値) ローソク足の実体とヒゲを統合した純粋なボラティリティ測定 シンプルで直感的、あらゆる市場環境で安定動作 熱力学的TRIモード(独自開発) 価格加速度 :2次微分による価格変化の勢いを測定 出来高変化率 :相対的な出来高の変化を動的に評価 ポジションエネルギー :正規化された価格変動エネルギーを計算 熱力学的係数 :物理学の熱力学法則を市場分析に応用 2. 高度な平滑化システム SMA(単純移動平均) :基本的なノイズ除去 EMA(指数移動平均) :最新データ重視の平滑化
A powerful indicator that highlights key market zones and helps traders identify potential opportunities across multiple timeframes. Designed for clarity and efficiency, it provides real-time alerts to keep you informed of important price levels. Key Features: Works on multiple timeframes: M1, M5, M15, M30, H1, H4, D1, W1, MN1. Customizable zone colors for each timeframe. Real-time alerts and notifications when price reaches significant zones. Automatically manages chart objects to keep your wor
This indicator has been developed to identify and display these trends quickly and easily, allowing you to see instantly, those currency pairs which are trending, and those which are not – and in all timeframes, with just one click. The 28 currency pairs are displayed as a fan as they sweep from strong to weak and back again, and this is why we call it the ‘currency array’. All 28 pairs are arrayed before you, giving an instant visual description of those pairs that are trending strongly, those
このプロダクトを購入した人は以下も購入しています
ARIPoint is a powerful trading companion designed to generate high-probability entry signals with dynamic TP/SL/DP levels based on volatility. Built-in performance tracking shows win/loss stats, PP1/PP2 hits, and success rates all updated live. Key Features: Buy/Sell signals with adaptive volatility bands Real-time TP/SL/DP levels based on ATR Built-in MA Filter with optional ATR/StdDev volatility Performance stats panel (Success, Profit/Loss, PP1/PP2) Alerts via popup, sound, push, or email Cu
SuperScalp Pro
Van Minh Nguyen
4.63 (24)
SuperScalp Pro – 高度なマルチフィルタースキャルピングインジケーターシステム SuperScalp Pro は、クラシックな Supertrend と複数のインテリジェント確認フィルターを組み合わせた高度なスキャルピングインジケーターです。M1 から H4 まで複数の時間足で効率的に動作し、XAUUSD、BTCUSD、主要 Forex 通貨ペア向けに最適化されています。 このインジケーターは明確な Buy / Sell シグナルを提供し、ATR に基づいてエントリー価格、Stop Loss、Take Profit を自動計算します。Fibonacci Take Profit 機能により、重要な価格帯で早期決済し、到達時に通知を送信します。 初期設定では Fibonacci Take Profit が有効化されており、より安定した取引体験を重視しています。チャートに適用するだけですぐ利用可能です。上級者向けに、すべてのパラメータは自由にカスタマイズできます。 EMA、RSI、ADX、Volume、VWAP、Bollinger Bands、MACD Divergence な
このインジケーターを購入された方には、以下の特典を 無料 で提供しています: 各トレードを自動で管理し、ストップロスとテイクプロフィットを設定し、戦略ルールに基づいてポジションを決済する補助ツール 「Bomber Utility」 様々な銘柄に合わせたインジケーターの設定ファイル(セットファイル) 「最小リスク」、「バランスリスク」、「待機戦略」 の3つのモードで使用できる Bomber Utility 用の設定ファイル このトレーディング戦略をすぐに導入・設定・開始できる ステップバイステップのビデオマニュアル ご注意: 上記の特典を受け取るには、MQL5のプライベートメッセージシステムを通じて販売者にご連絡ください。 オリジナルのカスタムインジケーター 「Divergence Bomber(ダイバージェンス・ボンバー)」 をご紹介します。これは、MACDのダイバージェンス(乖離)戦略に基づいた 「オールインワン」型のトレーディングシステム です。 このテクニカルインジケーターの主な目的は、価格とMACDインジケーターの間に発生するダイバージェンスを検出 し、将来の価格の動きを示す
Entry In The Zone and SMC Multi Timeframe is a real-time 2-in-1 market analysis tool that combines market structure analysis and a No Repaint BUY / SELL signal system into a single indicator, built on Smart Money Concepts (SMC) — a widely adopted framework used by professional traders to understand market structure. This indicator helps you see the market more clearly, make decisions based on structure rather than guesswork, and focus on high-probability zones where price is more likely to react
SignalTech MT5 is an unique fully rule based trading system for EURUSD, USDCHF, USDJPY, AUDUSD, NZDUSD, EURJPY, AUDJPY, NZDJPY, CADJPY.  All the winning trades with chart setups are published on the comments page. 2026-05 2802 Pips (Until 05-15 NY Closed) 2026-04 2243 Pips 2026-03 2165 Pips 2026-02 2937 Pips 2026-01 2624 Pips 2025-12 1174 Pips It can generate signals with Buy/Sell Arrows and Pop-Up/Sound Alerts. Each signal has clear Entry and Stop Loss levels, which should be automatically flag
Power Candles V3 - 自己最適化型強弱インジケーター Power Candles V3は 、通貨や銘柄の強さを、適用されたすべてのチャート上で実行可能なトレードプランに変換します。単にローソク足を色分けするだけでなく、バックグラウンドでリアルタイムの自動最適化を実行し、目の前の銘柄に対して最適なストップロス、テイクプロフィット、およびシグナルの閾値を提示します。ワンクリックで実取引に適用でき、エントリーポイント、ストップロス、テイクプロフィットのラインが正確な価格位置にチャート上に表示され、方向性を示すアラートがリアルタイムで発動します。 このツールは、Stein Investmentsのエコシステムの一部です。  18種類以上のツールをすべて閲覧し、AIを活用したセットアップの推奨事項を入手し、  https://stein.investments でコミュニティに参加しましょう クローズしたバーごとに3,000回以上のトレードシミュレーション。9つの強さの状態。2つの戦略を並行してテスト。勝率の高い設定をワンクリックで適用。 なぜこれが必要なのか ほとんどの強
Gann Made Easy   は、ミスター・ギャンの理論を使用した取引の最良の原則に基づいた、プロフェッショナルで使いやすい外国為替取引システムです。 W・D・ガン。このインジケーターは、ストップロスとテイクプロフィットレベルを含む正確な買いと売りのシグナルを提供します。 PUSH通知を利用して外出先でも取引可能です。 ご購入後、取引方法の説明と優れた追加インジケーターを無料で入手するには、私にご連絡ください! おそらく、ギャンの取引手法についてはすでに何度も聞いたことがあるでしょう。通常、ギャンの理論は初心者のトレーダーだけでなく、すでにある程度の取引経験がある人にとっても非常に複雑なものです。なぜなら、ギャンの取引手法は理論的にはそれほど簡単に適用できるものではないからです。私はその知識を磨き、最良の原則を私の外国為替インジケーターに組み込むために数年を費やしました。 このインジケーターは非常に簡単に適用できます。必要なのは、それをチャートに添付し、簡単な取引推奨事項に従うだけです。このインジケーターは常に市場分析の仕事を行い、取引の機会を探します。適切なエントリーポイントを検
このインジケーターを購入すると、プロ仕様のトレードマネージャーを無料で差し上げます。 まず第一に、このトレーディングシステムがノンリペイント、ノンリドロー、ノンラグのインジケーターであることを強調する価値がある。これにより、手動取引とロボット取引の両方に理想的なものになっています。 オンラインコース、マニュアル、プリセットのダウンロード。 「スマートトレンドトレーディングシステム MT5」は、新規および経験豊富なトレーダー向けにカスタマイズされた包括的なトレーディングソリューションです。10以上のプレミアムインジケーターを組み合わせ、7つ以上の堅実なトレーディング戦略を備えており、多様な市場状況に対応する多目的な選択肢となっています。 トレンドフォロー戦略:トレンドを効果的に乗り越えるための正確なエントリーとストップロス管理を提供します。 リバーサル戦略:潜在的なトレンドの反転を特定し、トレーダーがレンジ相場を活用できるようにします。 スキャルピング戦略:高速で正確なデイトレードおよび短期取引のために設計されています。 安定性:すべてのインジケーターはノンリペイント、ノンリドロー、ノ
ご紹介     Quantum Breakout PRO は 、ブレイクアウト ゾーンの取引方法を変革する画期的な MQL5 インジケーターです。 13年以上の取引経験を持つ経験豊富なトレーダーのチームによって開発されました。     クォンタム ブレイクアウト プロ   は、革新的でダイナミックなブレイクアウト ゾーン戦略により、あなたのトレーディングの旅を新たな高みに押し上げるように設計されています。 クォンタム ブレイクアウト インジケーターは、5 つの利益ターゲット ゾーンを備えたブレイクアウト ゾーン上のシグナル矢印と、ブレイクアウト ボックスに基づいたストップロスの提案を提供します。 初心者トレーダーにもプロのトレーダーにも適しています。 量子EAチャネル:       ここをクリック 重要!購入後、インストールマニュアルを受け取るためにプライベートメッセージを送ってください。 推奨事項: 時間枠: M15 通貨ペア: GBPJPY、EURJPY、USDJPY、NZDUSD、XAUUSD アカウントの種類: ECN、Raw、またはスプレッドが非常に低い R
Azimuth Pro
Ottaviano De Cicco
5 (7)
Azimuth Pro V2:MT5向けシンセティック・フラクタル構造分析と確認済みエントリー 概要 Azimuth Pro は Merkava Labs によるマルチレベルスイング構造インジケーターです。4つのネストされたスイングレイヤー、スイングアンカーVWAP、ABCパターン検出、3タイムフレーム構造フィルタリング、そして確定バーでの確認済みエントリー — 1つのチャートで、ミクロスイングからマクロサイクルまでを網羅するワークフロー。 これはブラインドシグナル製品ではありません。ロケーション、コンテキスト、タイミングを重視するトレーダーのための構造ファーストワークフローです。 V2発売記念オファー — Azimuth Pro V2をUSD 399で(次の100本)。最終価格:USD 499。 1. V2での変更点 シンセティック・マルチタイムフレームエンジン 上位タイムフレーム分析をMeridian Proと同じ独自のシンセティックアーキテクチャで一から再構築。よりクリーンなHTFコンテキスト、安定したライブ動作、従来のMTF同期問題なし。シンセティックエンジンは 固定比率タ
Meridian Pro
Ottaviano De Cicco
5 (2)
Meridian Pro 2.00:MT5向けプロ仕様マルチタイムフレーム・トレンドマトリクス Meridian Pro 2.00 は、MetaTrader 5 向けのプロ仕様の適応型トレンドマトリクスです。オリジナルの Meridian トレンドエンジン、クリーンなチャート ribbon、確定足ベースのシグナル矢印、8時間足 dashboard、Fuel momentum、weighted consensus、synthetic HTF processing、そしてチャート上に直接表示される上位足コンテキストラインを統合します。 目的はシンプルです。現在のトレンド、マルチタイムフレーム構造、強度、momentum、EA-ready 状態を、複数チャートに無関係なインジケータを重ねるのではなく、1つの整理された workflow で読むことです。 Meridian Pro の違い 1つの適応型エンジン - 同じ volatility-aware Meridian ロジックを M1 から W1 まで適用します。 Synthetic HTF architecture - 上位足行は下位足デ
まず第一に、この取引ツールはノンリペイント、ノンリドロー、ノンラグの指標であり、プロの取引に理想的ですことを強調する価値があります。 オンラインコース、ユーザーマニュアル、デモ。 スマートプライスアクションコンセプトインジケーターは、新米から経験豊富なトレーダーまで、非常 に強力なツールです。Inner Circle Trader AnalysisやSmart Money Concepts Trading Strategiesなど、20以上の有用な指標を1つに組み合わせています。このインジケーターはスマートマネーコンセプトに焦点を当て、大手機関の取引方法を提供し、彼らの動きを予測するのに役立ちます。 特に、流動性分析に優れており、機関がどのように取引しているかを理解しやすくしています。市場のトレンドを予測し、価格の動きを慎重に分析するのに優れています。機関の戦略とトレードを合わせることで、市場の動向についてより正確な予測ができます。このインジケーターは多目的であり、市場構造を分析し、重要な注文ブロックを特定し、さまざまなパターンを認識するのに優れています。 このインジケーター
FX Trend NG:次世代マルチマーケット・トレンドインテリジェンス 概要 FX Trend NG は、複数の時間足に対応したプロフェッショナル向けトレンド分析およびマーケット監視ツールです。 市場全体の構造を数秒で把握することができます。 複数のチャートを切り替える必要はありません。どの銘柄がトレンド中なのか、どこでモメンタムが弱まっているのか、そしてどの時間足で強い整合性があるのかを瞬時に確認できます。 ローンチ特別オファー – FX Trend NG を $30(6ヶ月) または $80 永久ライセンス でご利用いただけます。 すでに Stein Investments のユーザーですか? -> メッセージを送信 して、プライベートグループへアクセスしてください。 セットアップや詳細情報が必要ですか? -> Stein Investments 公式ページ をご覧ください。 1. FX Trend NG が他と異なる理由 3ステート・トレンドロジック ― Buy と Sell だけではない • 多くのインジケーターは Buy または Sell の2状態のみを表示します。
トレンド スクリーナー インジケーターでトレンド取引の力を解き放ちます。ファジー ロジックと複数通貨システムを活用した究極のトレンド取引ソリューションです。 ファジー ロジックを活用した革新的なトレンド インジケーターである Trend Screener を使用して、トレンド取引を向上させます。 これは、13 を超えるプレミアム ツールと機能、および 3 つの取引戦略を組み合わせた強力なトレンド追跡インジケーターであり、Metatrader をトレンド アナライザーにする多用途の選択肢となります。 期間限定オファー : トレンド スクリーナー インジケーターは、わずか 65 ドルで生涯ご利用いただけます。 (元の価格 50$ ) (オファー延長) Trend Screener の 100% 非再描画精度の揺るぎない精度を体験して、取引の決定が過去の価格変動の影響を受けないようにしてください。 マルチタイムフレームおよびマルチ通貨機能の多用途性を解放し、比類のない自信を持って外国為替、商品、暗号通貨、インデックスの世界を取引できるようにします。 Trend Screener の包括的な戦
多くの矢印インジケーターは、シグナルだけを表示して、その後の判断をすべてトレーダーに任せてしまいます。KT Alpha Hunter Arrows は、完整なトレードプランをチャート上に提示します。 各シグナル矢印が表示されるたびに、エントリーライン、ストップロス、4つのテイクプロフィット水準、そして現在の銘柄と時間足が今トレードに値するかどうかを示すリアルタイムのエッジ判定が、すでに描画された状態で表示されます。付属の Trade Manager EA は、あなたが手動でエントリーした後の実行管理を担当し、相場が荒れて判断がぶれやすい場面でも規律あるトレードを保ちやすくします。リペイントなし。確定足シグナルのみ。Forex、ゴールド、指数、その他あなたが取引するあらゆる銘柄に対応します。 主な機能 リペイントしない買い矢印と売り矢印を、足の確定後にのみ表示。 各シグナルに、エントリーライン、構造的ストップロス、4つのテイクプロフィット水準を表示。 Edge Dashboard が、現在のチャートで買いセットアップと売りセットアップを別々に評価。 判定システム:No Edge、Mar
GEM Signal Pro GEM Signal Pro は、MetaTrader 5 向けのトレンドフォロー型インジケーターです。より明確なシグナル、より整理されたトレードセットアップ、そして実用的なリスク管理をチャート上で確認したいトレーダーのために設計されています。 単純な矢印だけを表示するのではなく、GEM Signal Pro はトレード全体の考え方を、より見やすく分かりやすい形で表示します。条件が確認されると、インジケーターはエントリー価格、ストップロス、利確目標をチャート上に表示し、トレードセットアップをより効率的に確認できるようにします。 動作の仕組み このインジケーターは、まず内部ロジックに基づいて有効なシードシグナルを検出します。 確認条件が満たされると、GEM Signal Pro はチャート上に完全なセットアップを表示します。これにより、トレーダーはトレード構造をより明確に把握し、手作業による分析を減らすことができます。 チャート上のトレードレベル 確認済みシグナルに対して、GEM Signal Pro は以下を表示できます。 エントリー価格 ストップロス テ
これはMT5のインジケーターで、再描画なしで取引に参入するための正確なシグナルを提供します。 外国為替、暗号通貨、金属、株式、インデックスなど、あらゆる金融資産に適用できます。かなり正確な見積もりを提供し、取引を開始して終了するのに最適な時期を教えてくれます。1つのシグナルを処理しただけでインジケーターの元が取れた例の 動画 (6:22)をご覧ください。Entry PointsPro インジケーターの助けを借りたほとんどのトレーダーの最初の1週間の結果が改善しています。 Telegramグループ に登録してください。Entry Points Proインジケーターのメリットは次の通りです。 再描画のないエントリーシグナル 再描画されるインジケーターでは一度表示されたシグナルが削除されて大きな金銭的損失につながることがありますが、これと異なり、表示されて確認されたシグナルは消えることがありません。 エラーなしの取引開始 インジケーターアルゴリズムによって取引を開始する(資産を売買する)理想的な瞬間を見つけることができます。それを使用するすべてのトレーダーの成功率が向上します。 あら
このダッシュボードは、選択されたシンボルの最新の利用可能なハーモニックパターンを表示するので、時間を節約し、より効率的に /   MT4バージョン 。 無料インジケーター:   Basic Harmonic Pattern インジケーター列 Symbol : 選択したシンボルが表示されます。 Trend :   強気または弱気 Pattern : パターンの種類(ガートレー、バタフライ、バット、カニ、サメ、サイファー、ABCD) Entry : エントリー価格 SL: ストップロス価格 TP1: 1回目の利食い価格 TP2: 2回目の利食い価格 TP3:   3回目の利食い価格 Current price :   現在値 Age (in bars):    最後に描画されたパターンの年齢 主な入力項目 Symbols:   "28 Major Currency Pairs "または "Selected Symbols "から選択。 Selected Symbols:   カンマで区切られた監視したいシンボル("EURUSD,GBPUSD,XAUUSD")。ブローカーがペアに接
BTMM State Engine Pro is a MetaTrader 5 indicator for traders who use the Beat The Market Maker approach: Asian session context, kill zone timing, level progression, peak formation detection, and a multi-pair scanner from a single chart. It combines cycle state logic with a built-in scanner dashboard so you do not need the same tool on many charts at once. What it does Draws the Asian session range; session times can follow broker server offset or be set in inputs. Tracks level progression (L
Trend Forecaster – Since 2023. The Trend Forecaster indicator utilizes a unique proprietary algorithm to determine entry points for a breakout trading strategy. The indicator identifies price clusters, analyzes price movement near levels, and provides a signal when the price breaks through a level. The Trend Forecaster indicator is suitable for all financial assets, including currencies (Forex), metals, stocks, indices, and cryptocurrencies. You can also adjust the indicator to work on any time
Quantum TrendPulse を ご紹介します。これは、   SuperTrend   、   RSI   、および Stochastic のパワーを 1 つの包括的なインジケーターに組み合わせて、取引の可能性を最大限に引き出す究極の取引ツールです。精度と効率を求めるトレーダー向けに設計されたこのインジケーターは、市場のトレンド、勢いの変化、最適なエントリー ポイントとエグジット ポイントを自信を持って特定するのに役立ちます。 主な特徴: SuperTrend 統合: 現在の市場動向に簡単に追従し、収益性の波に乗ることができます。 RSI精度: 買われすぎと売られすぎのレベルを検出し、市場の反転のタイミングに最適で、SuperTrendのフィルターとして使用されます。 確率的精度: 確率的振動を活用して、変動の激しい市場で隠れたチャンスを見つけます。SuperTrend のフィルターとして使用されます。 マルチタイムフレーム分析:   M5 から H1 または H4 まで、さまざまなタイムフレームで市場を常に把握します。 カスタマイズ可能なアラート: カスタム取引条件が満たされ
優れたテクニカルインジケーター「Grabber」をご紹介します。これは、すぐに使える「オールインワン」トレーディング戦略として機能します。 ひとつのコードに、市場のテクニカル分析ツール、取引シグナル(矢印)、アラート機能、プッシュ通知が強力に統合されています。 このインジケーターを購入された方には、以下の特典を無料で提供します: Grabberユーティリティ:オープンポジションを自動で管理するツール ステップバイステップのビデオマニュアル:インジケーターのインストール、設定、取引方法を解説 カスタムセットファイル:インジケーターをすばやく自動設定し、最大限の成果を出すための設定ファイル 他の戦略はもう忘れてください!Grabberだけが、あなたを新たなトレードの高みへと導いてくれるのです。 Grabber戦略の主な特徴: 推奨タイムフレーム:M5〜H4 対応通貨ペア・資産:どれでも使用可能ですが、私が実際に検証した以下を推奨します(GBPUSD、GBPCAD、GBPCHF、AUDCAD、AUDUSD、AUDSGD、AUDCHF、NZDUSD、NZDCAD、EURCAD、EURUSD、E
FX Power: 通貨の強弱を分析して、より賢い取引を実現 概要 FX Power は主要通貨と金の実際の強弱をあらゆる市場状況で理解するための必須ツールです。強い通貨を買い、弱い通貨を売ることで、 FX Power は取引の意思決定を簡素化し、高い確率の取引機会を見出します。トレンドを追従する場合でも、極端なデルタ値を使用して反転を予測する場合でも、このツールはあなたの取引スタイルに完全に適応します。ただ取引するだけではなく、 FX Power で賢く取引をしましょう。 1. なぜ FX Power がトレーダーにとって非常に有益なのか 通貨と金のリアルタイム強弱分析 • FX Power は主要通貨と金の相対的な強弱を計算し、マーケットダイナミクスに関する明確な洞察を提供します。 • どの資産がリードしているか、または後れを取っているかを監視して、取引するペアを賢く選びましょう。 マルチタイムフレームの包括的なビュー • 短期、中期、長期のタイムフレームで通貨と金の強弱を追跡し、マーケットトレンドに基づいて取引戦略を調整できます。 • スキャルピングからスイングトレード
まず第一に、この取引インジケーターは再描画されず、再描画されず、遅延しないことを強調する価値があります。これにより、手動取引とロボット取引の両方に理想的なものになります。 ユーザーマニュアル:設定、入力、戦略。 アトミックアナリストは、価格の強さとモメンタムを利用して市場でより良いエッジを見つけるためのPA価格アクションインジケーターです。ノイズや誤ったシグナルを除去し、取引ポテンシャルを高めるための高度なフィルターを備えています。複雑なインジケーターの複数のレイヤーを使用して、アトミックアナリストはチャートをスキャンし、複雑な数学的計算をシンプルなシグナルと色に変換します。これにより、どのような初心者トレーダーでも理解して使用し、一貫した取引の決定を行うことができます。 「アトミックアナリスト」は、新規および経験豊富なトレーダー向けにカスタマイズされた包括的な取引ソリューションです。プレミアムインジケーターとトップノッチの機能を1つの取引戦略に組み合わせ、すべてのタイプのトレーダーにとって汎用性のある選択肢にします。 デイリートレーディングとスキャルピング戦略:高速で正確なデイ
OrderFlux | MetaTrader 5 用フットプリント・オーダーフロー バージョン 2.0 – アクティブトレーダー向けのリアルタイム Bid/Ask 可視化 OrderFlux は MT5 用のフットプリントおよびオーダーフローインジケーターです。価格がどこに動いたかだけでなく、その動きの中で何が起きているか(各価格レベルの Bid/Ask ボリューム、デルタ、インバランス、ボリューム分布)を表示します。 多くのチャートはローソク足の最終結果しか表示しません。OrderFlux はそこに至るまでの過程を表示します。ローソク足の形状だけでなく、市場参加者の動向を読み取りたい場合にまさに役立ちます。 ライブチャートにおいて、OrderFlux は主に次の3つの質問に答えます: 現在、どこで積極的な買いまたは売りの圧力が市場に参入しているか? どの価格レベルでボリュームが吸収、または拒否されているか? 現在の動きはセッションのコンテキスト(背景)にどう適合しているか? インターフェースで得られるもの メインチャートは、Canvas ベースでフットプリントを直接レンダリングします
RelicusRoad Pro: 定量的市場オペレーティングシステム 【期間限定】無制限アクセス 70% OFF - 2,000人超のトレーダーと共に なぜ多くのトレーダーは「完璧な」インジケーターを使っても失敗するのでしょうか? それは、文脈を無視して 単一の概念 だけでトレードしているからです。文脈のないシグナルは単なるギャンブルです。勝ち続けるには、 根拠の重なり(コンフルエンス) が必要です。 RelicusRoad Proは単なる矢印インジケーターではありません。完全な 定量的市場エコシステム です。独自のボラティリティモデリングを用いて、価格が推移する「適正価値の道(Fair Value Road)」をマッピングし、ノイズと真の構造的ブレイクを判別します。 推測はやめましょう。機関投資家レベルの「ロード・ロジック」でトレードを。 コアエンジン:「Road」アルゴリズム システムの中心となる Road Algo は、市場環境にリアルタイムで適応するダイナミックなボラティリティチャネルです。 安全ライン(平衡点) と、価格が数学的に反転しやすい 拡張レベル を投影します。 Si
Hydra Trend Rider is a non-repainting, multi-timeframe trend indicator that delivers precise buy/sell signals and real-time alerts for high-probability trade setups. With its color-coded trend line, customizable dashboard, and mobile notifications, it's perfect for traders seeking clarity, confidence, and consistency in trend trading. Setup & Guide:  Download  MT4 Version here. To learn how to use the Indicator: Indicator Manual & Guide -   Read Here Follow our MQL5 channel for daily market ins
トレンドラインプロ   市場の真の方向転換点を理解するのに役立ちます。この指標は、真のトレンド反転と主要プレーヤーが再び参入するポイントを示します。 分かりますか     BOSライン   複雑な設定や不要なノイズなしに、より長い時間足でのトレンドの変化と重要なレベルを把握できます。シグナルは再描画されず、バーが閉じた後もチャート上に残ります。 MT4バージョン   -   RFI LEVELS PRO インジケーター と組み合わせることで、その最大限の能力を発揮します インジケーターが示す内容: 本当の変化   トレンド(BOSライン) 一度シグナルが現れたら、それは有効です!これは、リペイント機能を持つインジケーターとの重要な違いです。リペイント機能を持つインジケーターは、シグナルを発した後、それを変更し、資金の損失につながる可能性があります。これにより、より高い確率と精度で市場に参入できます。また、矢印が現れた後、目標値(利益確定)に達するか、反転シグナルが現れるまで、ローソク足の色を変更する機能もあります。 繰り返しエントリ   主要プレーヤーの補充 エントリーポイントを探す
Introducing Indicator for PainX and GainX Indices Traders on Weltrade Get ready to experience the power of trading with our indicator, specifically designed for Weltrade   broker's PainX and GainX Indices.  Advanced Strategies for Unbeatable Insights Our indicator employs sophisticated strategies to analyze market trends, pinpointing optimal entry and exit points.  Optimized for Maximum Performance To ensure optimal results, our indicator is carefully calibrated for 5-minute timeframe charts on
このインジケーターは、反転ポイントと価格戻りゾーンを正確に表示します。     主要プレーヤー 。新たなトレンドが形成される場所を把握し、最大限の精度で意思決定を行い、すべての取引をコントロールします。 TREND LINES PRO インジケーターと組み合わせることで、その潜在能力を最大限に発揮します。 VERSION MT4 インジケーターが示す内容: 新しいトレンドの始まりに活性化する反転構造と反転レベル。 リスクと報酬の比率を最小限に抑えた利益 確定 と 損失停止の レベルの表示     RR 1:2   。 インテリジェントな削減ロジックによるストップロス。 指定されたインジケーターから 2 つのトレンド タイプの反転パターンを表示します。 指標: トレンドを追う   TREND LINES PRO   (世界的なトレンドの変化) TREND PRO   (クイックトレンド変更) シンプルで効果的   スキャナー   リアルタイムトレンド(新機能)。 マルチタイムフレームのインストゥルメント フィルタリング。 画面   利益     LOGIC AI信号の後。 当日プラス方
作者のその他のプロダクト
Currency Strength & MTF Direction Panel What is Currency Strength & MTF Direction Panel? A real-time currency analysis dashboard that ranks all 8 major currencies by composite strength, displays trend direction across 4 timeframes (M15/H1/H4/D1), and suggests which pair to focus on. Designed by a data analyst using statistical methods. Non-repainting. Works with all major FX brokers. Do any of these sound familiar? - You open multiple charts every morning, flip between pairs, and still cannot de
Environment Pro MT5 What is Environment Pro? Environment Pro is a real-time market scanning dashboard that monitors multiple symbols and timeframes in a single panel. It helps you quickly identify which pairs show clear directional bias, which are stuck in range, and where unusual volatility is appearing. Built as a practical environment-assessment tool for MT5, it can be used with Forex pairs, Gold, indices, and crypto symbols supported by your broker. The Problem It Solves - You enter a trade
Future Fractal Pro What is Future Fractal Pro? A statistical pattern-matching indicator that scans up to 15,000 bars of historical data, finds the closest matching price patterns using k-Nearest Neighbors (k-NN) methodology, and projects the statistically most likely price scenario as future candlesticks on your chart. It displays a confidence rank (A/B/C), expected return in pips, and risk direction -- all in a single information panel. Designed by a data analyst. M30 timeframe, 6 major pairs.
フィルタ:
レビューなし
レビューに返信