MarketSync Pro
- インディケータ
-
Moch Wahyu Febriyanto
 "Welcome to my trading profile! I have been in the trading world for over a year and have developed an effective scalping technique. I am happy to consistently provide profits for my followers. You can check out my trading history on the signals I have created. I open trade positions every day to
 - バージョン: 1.10
- アクティベーション: 5
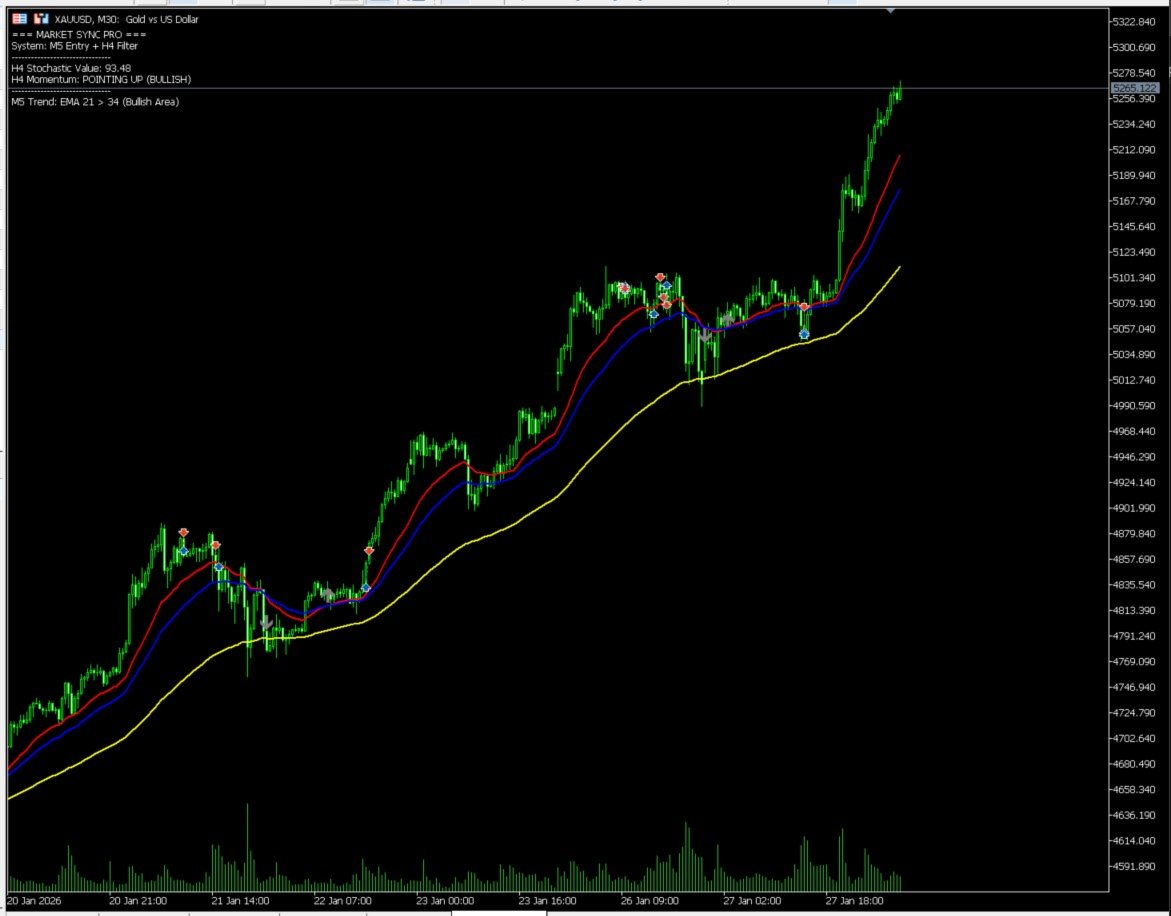
Market Sync Pro
Tagline: Precision Entries. Trend Alignment. No More False Signals.
Overview: Are you tired of taking moving average crossovers that turn into fakeouts? The problem isn't the entry; it's the trend direction. Market Sync Pro solves this by synchronizing short-term precision with long-term momentum.
This indicator is a powerful multi-timeframe scanner designed specifically for the M5 Timeframe. It detects high-probability EMA Crossovers (21 & 34) on the M5 chart, but ONLY validates them if the H4 Stochastic Momentum agrees with the direction.
It acts as your strict filter: if the H4 trend doesn't support the move, Market Sync Pro will block the signal, saving you from low-quality trades.
Key Features:
-
Multi-Timeframe Logic: Automatically reads H4 data while you trade on M5. No need to switch charts.
-
Smart Filtering System:
-
Valid Signals (Green/Magenta Arrows): Confirmed by H4 Momentum. Ready to trade.
-
Filtered Signals (Gray Arrows): Rejected by the system because H4 trend is opposing. (Visual Debugging).
-
-
Real-Time Dashboard: Displays the live status of H4 Stochastic (Bullish/Bearish) and M5 EMA Trend directly on your chart.
-
Full Notification Suite: Receive instant Push Notifications to your mobile and Pop-up Alerts on PC when a valid setup occurs.
-
Non-Repainting: Signals are confirmed once the candle closes.
How to Trade:
-
Attach to M5 Chart: This indicator is optimized for the 5-minute timeframe.
-
Wait for Valid Signals:
-
BUY Signal (Green Arrow): EMA 21 crosses above EMA 34 (M5) + Stochastic is pointing UP (H4).
-
SELL Signal (Magenta Arrow): EMA 21 crosses below EMA 34 (M5) + Stochastic is pointing DOWN (H4).
-
-
Ignore Gray Arrows: These indicate that a crossover happened, but the big trend (H4) was against you. Stay out of the market.
Input Parameters:
-
System Settings:
-
InpMaxBars : Number of historical bars to calculate (Default: 5000).
-
InpShowGray : Show/Hide filtered (gray) signals.
-
-
Entry Settings (M5): Customize the Fast (21) and Slow (34) EMA periods.
-
Filter Settings (H4): Customize the H4 Stochastic settings (Default: 5, 3, 3).
-
Notifications: Enable/Disable PC Alerts and Mobile Push Notifications.
Why Market Sync Pro? Professional traders know that "The Trend is Your Friend." Market Sync Pro ensures you never trade against the major trend again. It effectively forces you to follow the institutional flow of the H4 timeframe while executing with M5 sniper precision.