Sunday Open Eng

Russian version https://www.mql5.com/ru/market/product/148571?source=Site+Profile+Seller

This guide is designed to help beginner traders understand how the "Sunday Open " indicator works and is configured, as well as how to properly interpret its signals for making informed trading decisions.

Part 1: What is the Sunday Open Indicator and How to Use It?

Core Concept

The indicator is based on a simple but powerful concept: the weekly opening price is a key support and resistance level.

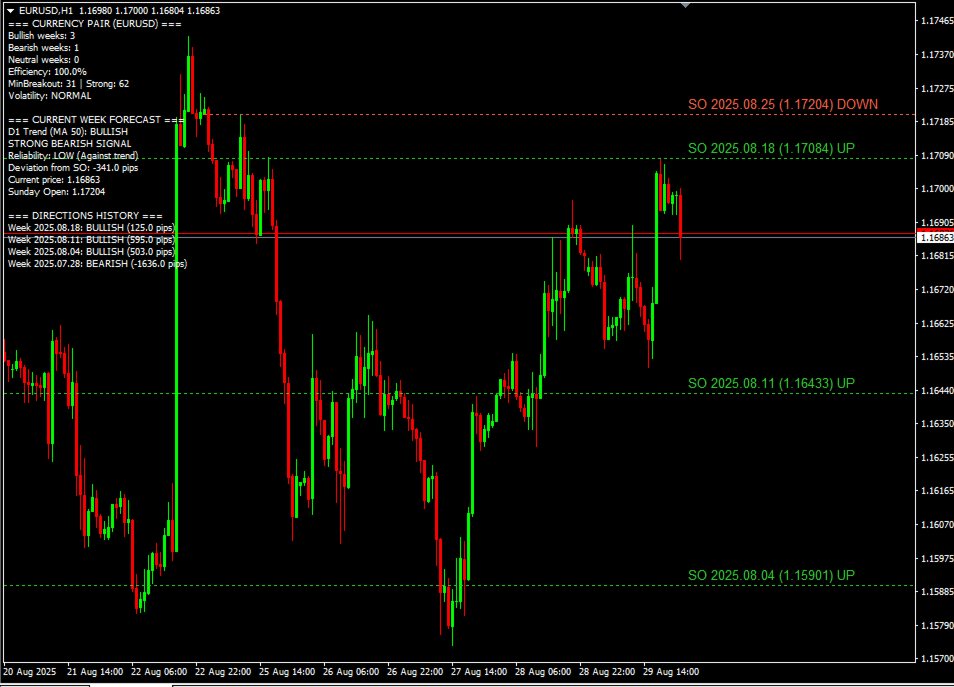
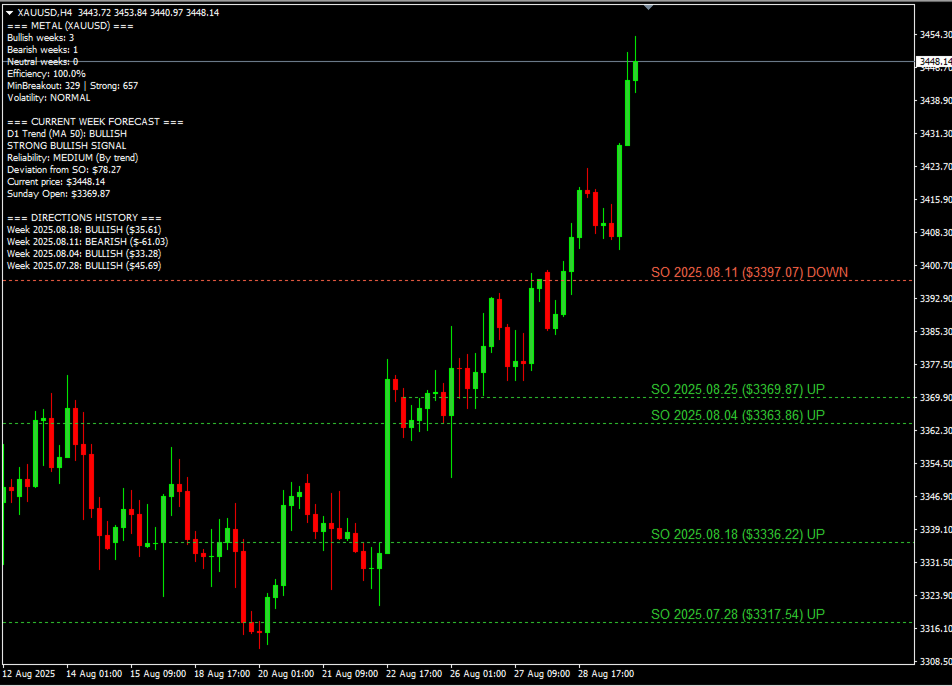
Imagine that at the beginning of the week (Sunday evening or Monday morning, depending on your broker), the price of an asset, for example, gold (XAUUSD), opens at $3300. This price, "Sunday Open" (SO), becomes the reference point. Throughout the week, major players — banks, funds, market makers — will orient themselves around this level.

If the price moves above the SO level and stays there, it indicates buyer strength. The week will likely be "bullish" (rising).

If the price drops below the SO level and consolidates under it, it indicates seller strength. The week will probably be "bearish" (falling).

If the price oscillates around the SO level, it indicates market uncertainty or sideways movement ("flat").

The indicator automatically finds these levels for the past several weeks, plots them on the chart, and analyzes how price behaved relative to them. This gives you a clear picture of market sentiment and helps forecast movement for the current week.

How to Properly Apply the Indicator?

1. Determine the Main Trend. The indicator is your assistant, not a "holy grail." Always look at the big picture. If the global trend on the daily chart (D1) is rising, then buy signals from the SO level (for example, a bounce from below) will be more reliable.

2. Use SO levels as entry zones. Don't enter a trade the moment price simply touches the line. Wait for confirmation:

  • Bounce: Price touches the level and begins moving in the opposite direction.
  • Breakout and Retest: Price breaks the level, then returns to it to "test" it from the other side, and only after that continues the movement. This is one of the strongest signals.
  • False Breakout: Price breaks the level but quickly returns back. This signals that the "breakout" was a trap, and price will likely go in the opposite direction.

3. Combine with Other Tools. Use the indicator together with other analysis methods: candlestick patterns (pin bars, engulfing), other levels (previous day's highs/lows), or oscillators (RSI, Stochastic) to confirm signals.

4. Pay Attention to Statistics. The indicator shows how many previous weeks were bullish versus bearish. If 4 out of the last 5 weeks were bullish, this indicates strong upward pressure.

Part 2: Detailed Breakdown of Indicator Settings

Below is a "plain English" explanation of each setting so you can adapt the indicator to your trading style and any financial instrument.

General Settings

MaxSundays = 5

  • What it means: Number of historical Sunday Open levels that will be displayed on the chart. A value of "5" means you'll see the current week's level and four previous ones.
  • Why it's needed: Old levels can also act as support or resistance. Price "remembers" these marks. Analyzing several weeks gives you a more complete picture of key price zones.
  • How to use:
    • For EURUSD: 5 is optimal. The market isn't as volatile, and 4-5 weeks provide sufficient context.
    • For XAUUSD (gold): You can keep 5, but if you're day trading on lower timeframes (M15-H1), you can reduce to 3-4 to avoid chart clutter. Gold is more "trending," and the most relevant levels are those from the last 2-3 weeks.

Visual Settings

LineStyle = DOT (Line Style)

  • What it means: Determines how the level line will look on the chart: solid (SOLID), dashed (DASH), dotted (DOT), etc.
  • Why it's needed: Purely for your visual convenience.
  • How to use: Choose the style you prefer that doesn't interfere with chart analysis. Dotted (DOT) or dashed (DASH) lines are often preferred as they don't clutter the chart as much as solid lines.

LineWidth = 1 (Line Width)

  • What it means: Line thickness in pixels.
  • Why it's needed: Allows making important levels more noticeable.
  • How to use: If you want to highlight the freshest SO level, you can manually change it on the chart, making it thicker. For standard display, "1" or "2" is sufficient.

ShowLabel = true (Show Labels)

  • What it means: A text label with the week's opening date and level price will be displayed next to each line.
  • Why it's needed: You won't need to hover over the line to know its exact value and date. Very convenient for quick analysis.
  • How to use: Recommended to always keep enabled (true).

ShowDirection = true (Show Direction Analysis)

  • What it means: Enables display of the previous week's direction (whether it was bullish or bearish) directly on the line label and in the information window.
  • Why it's needed: Allows instant assessment of how the previous week closed relative to its opening, providing hints about current market sentiment.
  • How to use: Definitely true. This is one of the key analytical functions.

ShowStatistics = true (Show Statistics)

  • What it means: A statistics block will be displayed in the chart corner showing: how many weeks were bullish, bearish, neutral, and overall strategy "effectiveness" (percentage of weeks that closed in trend).
  • Why it's needed: Provides understanding of overall market context. If 80% of recent weeks were bullish, it's a clear sign of strong upward trend.
  • How to use: Recommended true for strategic analysis.

ShowPrediction = true (Show Current Week Prediction)

  • What it means: Enables display of the current week's forecast based on its current position relative to Sunday Open, as well as considering trend and volume filters.
  • Why it's needed: This is your "operational summary." The indicator analyzes the current situation and provides hints, for example: "BULLISH TREND, Reliability: HIGH (Trend+Volume)".
  • How to use: Definitely true. This is dynamic real-time situation assessment.

UseMondayOpen = true (Use Monday Opening)

  • What it means: Some brokers open trading on Sunday, but liquidity at this time is very low, which can lead to false "gaps" (price jumps). This setting allows considering the full trading session opening on Monday as the reference point, not Sunday opening.
  • Why it's needed: To get a cleaner and more representative weekly opening level that isn't distorted by low liquidity.
  • How to use: In 99% of cases, recommended to set true. This increases level accuracy.

Adaptive Settings

These parameters are automatically adjusted by the indicator, but understanding their essence is important.

MinBreakoutPips = 15 (Minimum Pips for Breakout)

  • What it means: Minimum distance in pips that price must move from the SO level for it to be considered the beginning of a trend (bullish or bearish). If price moved less, the week is considered "neutral."
  • Why it's needed: To filter market "noise." Fluctuations of a few pips aren't significant.
  • How it works: The indicator automatically selects this value based on instrument volatility. For EURUSD it might be 10-15 pips, and for XAUUSD gold — 150-200 pips (15-20 pips).

StrongSignalPips = 30 (Pips for Strong Signal)

  • What it means: Distance in pips from the SO level that indicates strong and confident movement.
  • Why it's needed: To distinguish ordinary trend movement from powerful impulse.
  • How it works: Also automatically adjusted. If for gold MinBreakoutPips equals 150 pips, then StrongSignalPips might be 300-400. This helps in forecasting signal reliability.

Filters

Use_D1_Trend_Filter = true (Use D1 Trend Filter)

  • What it means: The indicator will analyze the global trend direction on the daily chart (D1) using a moving average (MA). Signals coinciding with this trend will be considered more reliable.
  • Why it's needed: This is one of the most important filters. Trading with the trend is always safer. If the D1 trend is bullish, then a buy signal from the SO level has much better chances of success.
  • How to use: Strongly recommended true. D1_MA_Period (MA period) and D1_MA_Method (MA method) can be left at default (50, EMA) — these are classic trend determination settings.

Use_Volume_Filter = true (Use Volume Filter)

  • What it means: The indicator analyzes trading volume. A level breakout confirmed by a volume spike is considered more genuine and strong.
  • Why it's needed: Volume is "fuel" for price. If price breaks an important level but trading volumes are low, it might be a trap. Abnormally high volume confirms major player interest.
  • How to use: Definitely true. Settings Volume_MA_Period (period for average volume calculation) and Volume_StdDev_Ratio (deviation coefficient for "spike" detection) are better left at default.

Alert System 

EnableAlerts = true (Enable Alerts)

  • What it means: Activates sound and text notification system.
  • Why it's needed: So you don't miss important trading signals even when away from the monitor.
  • How to use: true if you actively trade using the indicator.

Alert_Cooldown_Bars = 3

  • What it means: After the indicator issues a similar signal (for example, "touch"), it will "be silent" for 3 bars (candles) and won't repeat the same signal.
  • Why it's needed: On volatile instruments like XAUUSD, price can "saw" the level for a long time, causing a barrage of identical notifications. This setting protects from spam.
  • How to use:
    • For XAUUSD: Can set higher (for example, 5-10 bars on H1) as price often moves in jerks.
    • For EURUSD: 3-5 bars is usually sufficient.

Max_Consecutive_Touches = 5 (Maximum Consecutive Touches)

  • What it means: If price touches the level 5 times in a row without clear breakout or bounce, the indicator will stop sending "touch" alerts for this level to avoid spam during flat periods.
  • Why it's needed: Protects from annoying signals when the market is in sideways movement and price "sticks" to the level.
  • How to use: Value 5 is balanced. Don't decrease it, can increase to 7-8 if your instrument tends to long-term level "trading."

Retest_Tolerance_Pips = 2.0 (Retest Tolerance in Pips)

  • What it means: Price doesn't always return to the level pip by pip during retest. This setting creates a small "zone" around the level (in this case, 2 pips) for retest detection.
  • Why it's needed: To not miss a good retest signal just because price didn't reach the level by 1-2 pips.
  • How to use: 2-3 pips is optimal for most currency pairs. For gold, can increase to 5-10 pips.

Alert_On_Momentum = true (Consider Movement Strength)

  • What it means: Enables analysis of the "strength" of the candle on which the breakout occurred. A breakout made by a large, confident candle will have higher priority than a breakout by a small, indecisive candle.
  • Why it's needed: To filter weak, uncertain breakouts that often turn out to be false.
  • How to use: Definitely true. This significantly improves breakout signal quality.

EnablePushNotifications = true (Enable Push Notifications)

  • What it means: If you've configured MetaTrader on your smartphone, the indicator will send notifications directly to your phone.
  • Why it's needed: To stay informed of events even when far from the computer.
  • How to use: true if you use the mobile application.

AlertOnOldLevels = false (Alerts on Old Levels)

  • What it means: By default, notifications come only when interacting with the current week's level. If set to true, alerts will come for old levels too.
  • Why it's needed: Allows focusing on the most current level or, conversely, tracking the entire grid of key levels.
  • How to use:
    • For beginners: false to avoid confusion.
    • For experienced traders: true if you use old levels in your strategy.

Sound and Color Settings (Sound_Touch, BullishColor, etc.)

  • What it means: These parameters allow you to configure sound signals for different events (touch, breakout, bounce) and colors for bullish, bearish, and neutral weeks.
  • Why it's needed: For personalization. You can set different sounds for different events to audibly determine what happened in the market. Color indication helps quickly assess the visual picture.
  • How to use: Configure to your taste. Recommended to set a more "alarming" sound for breakout (news.wav) and calmer for touch (alert.wav).

Part 3: How to Read and Understand Indicator Alerts

Let's examine a real alert example and break it down part by part.

Alert Example:

2025.08.25 21:28:35.324 Sunday_Open XAUUSD,H4: Alert: FALSE BREAKOUT: XAUUSD bounced from level below [Strength: 0.3] from 2025.08.25 Level price: $3369.87 > Matches D1 trend!

Part-by-Part Breakdown:

FALSE BREAKOUT: XAUUSD bounced from level below

  • What it means: The strongest signal after retest occurred. Gold price (XAUUSD) first broke the Sunday Open level ($3369.87) from top to bottom but couldn't consolidate and quickly returned back up. "Bounced from level below" means price tried to break the level downward but was "bought up" and bounced upward.
  • How to interpret: This is a strong bullish signal. Sellers' attempt to "push" price down failed. The upward movement will likely continue. This is an excellent opportunity to consider buying.

[Strength: 0.3]

  • What it means: This is a "movement strength" indicator calculated as the ratio of candle body size to average volatility (ATR).
    • Strength < 0.5: Weak, uncertain movement
    • Strength 0.5 - 1.2: Normal, healthy movement
    • Strength > 1.2: Very strong, impulsive surge
  • How to interpret: In this case, Strength: 0.3 refers to the candle before the false breakout, showing that the downward movement was weak and uncertain, which led to the bounce. If this were a "BREAKOUT" alert with strength 0.3, such a breakout should be ignored.

from 2025.08.25

  • What it means: The week opening date to which this level relates. This helps identify which specific Sunday Open level price is interacting with.

Level price: $3369.87

  • What it means: The exact price value of the Sunday Open level where the event occurred.
  • How to interpret: This is your reference point for stop-loss placement. For example, when buying after this false breakout, stop-loss can be placed slightly below this level.

> Matches D1 trend!

  • What it means: The most important context line! It says that your buy signal (bullish false breakout) fully coincides with the global upward trend on the daily chart.
  • How to interpret: This greatly amplifies your signal. The probability of successful trade significantly increases as you're trading not against the "current" but with it. If it said "Against D1 trend!" here, the signal should be treated with great caution.

Final Alert Conclusion:

The indicator reported a high-probability buy entry point for gold, as a bullish false breakout of a key level occurred, and this signal is confirmed by the global trend. This is a comprehensive and quality trading setup.


おすすめのプロダクト
VWap Bands EForex
Veridiana Adorno Kendrick
VWAP Bands Metatrader 4 Forex Indicator The VWAP Bands Metatrader 4 Forex indicator is a quite similar to the Bollinger bands, but it deploys volume weighted average as the core value of the bands. There is an option of using the tick volume or real volume for calculation when using the VWAP Bands Metatrader 5 custom forex indicator, especially when the forex broker displays symbol alongside real volume. Similarly, you can decide to have deviations calculated with the sample correction or not.
Bull Bear Easy MTF
Naththapach Thanakulchayanan
This indicator, Bull Bear Easy MTF, summarise the strength color graphic and percentage of power for both  Bull and Bear in current market emotion stage which will show you in multi time frames and sum of the total Bull and Bear power strength which is an important information for traders especially you can see all Bull and Bear power in visualized graphic easily, Hope it will be helpful tool for you for making a good decision in trading.
Session Volume Profile  is an advanced graphical representation that displays trading activity during Forex trading sessions at specified price levels. The Forex market can be divided into four main trading sessions: the Australian session, the Asian session, the European session and the favorite trading time - the American (US) session. POC  - profile can be used as a support and resistance level for intraday trading. VWAP  - Volume Weighted Average Price. ATTENTION! For the indicator to wo
Markets Heat indicator can help you determine correct course of action at current market situation, by calculating market's "heat level". What is market's "heat level"? Well, it's my own way of simplifying complex market conditions to ease decision-making process. How does it work? Most of time market is moving in some narrow range and can't "decide" where to go -> flat market -> cold market. Other times, price goes Up or Down -> making trend movements -> heating the market. More powerful trends
UPD1 Volume Cluster
Vitaliy Kuznetsov
4.82 (17)
このアルゴリズムは、指標 UPD1 Trend Direction に基づいて減少したボラティリティのゾーンを検出し、指標 UPD1 Volume Box に基づいて最大水平ボリュームを構築します。 原則として、蓄積を終了するときに強い傾向の動きが発生します。 価格が累積を残している場合は、その最大水平ボリューム(POC)をテストすることができます。 スマートアラートは設定で使用できます。 入力パラメータ 。 基本設定 。 Bars Count – 指標が機能する履歴バーの数 。 Timeframe Flat - フラットが検索され、クラスターが構築されている時間枠の選択。 デフォルトでは、それは常に現在のものです。 Data Source - 見積期間の選択。 自動的に検出(最適) 。 Vertical Step - 密度と垂直精度に影響します 。 Period - オシレーターの周期を選択します 。 Start Flat After Bar - フラットを描画を開始する傾向の終了後に無視するろうそくの数 。 Minimal Flat Bars - フラット内のキャンドルの最小
FREE
Indicator (includes Volume Profile + Order Blocks) - a revolutionary indicator that combines two of the most powerful concepts of modern technical analysis: volume profiles and institutional players' order blocks. This tool allows you to see what is hidden from most traders and gives you a significant advantage in the market. Key benefits of the indicator: Visualization of "smart money": Clearly shows the areas of concentration of large players, highlighting areas with maximum volume in bright
The Quality trend indicator expresses the ratio of the strength of a trend or the speed of its growth (fall) to the degree of its noisiness or a certain norm of amplitudes of chaotic fluctuations of a growing (falling) price. The position of the indicator line above zero shows an increasing trend, below zero - a falling trend, the fluctuation of the indicator line near zero shows a flat. If the indicator line begins to fluctuate rapidly around zero and approach it, then this indica
Mr Beast Trend Reverse
Luis Mariano Vazquez Marcos
MR BEAST TREND REVERSE RECOMENDED H1 EUR USD La estrategia "Trend Reverse" en el mercado de divisas (Forex) es un enfoque utilizado para identificar puntos de reversión de tendencias y capturar cambios de dirección en los precios de los pares de divisas. Esta estrategia se basa en la premisa de que las tendencias del mercado no duran para siempre y que se producirán puntos de inflexión. Este robot de trading de Forex ha sido desarrollado por MRBEAST como una herramienta para facilitar el trading
Please refer to full version: https://www.mql5.com/en/market/product/140908 Key Zone Detector Key Level Supply & Demand Zone Detector   Overview A sophisticated supply and demand zone detection indicator that identifies and rates key price levels where significant market activity occurs. The indicator uses fractal analysis and multiple validation methods to detect and classify trading zones. Key Features Zone Detection Auto-detects support and resistance zones Uses dual fractal system (fast and
FREE
Reversal Monster Mini
Abdulfattah Yahya Mohammed Alhazmi
The Most advanced and comprehensive EA to trade Trend Reversals/Pullbacks It is a very profitable EA, to trade trends breakout, and manage trades, takeprofit, stoploss, move to breakeven, and trailing stop. The   “Reversal Monster EA”   trades Reversal/Pullbacks when the current price of the pair pullback to a predefined horizontal level or trendline on the currency chart. The opening of the position can be immediate after pullback to the drawn trendline or after closing the candle below/above
FREE
Indicator overview   Trend indicator usage Moving averages. Highest quality alerts that need no introduction. It is completely loyal to the original algorithm and uses other useful features. Easy to trade Carry out all kinds of notifications It's not a new paint and it's not a back paint. Setting Indicator WMA50 in Time frame H1 for any pair currency and Gold Spot. EMA200 in Time frame H1 for any pair currency and more than EMA250 for Gold spot. Using it for maximum benefit Set up notification
FREE
Introduction to the use of MT4 platform AI Color Gradient Volume indicators I. Overview of indicators AI Color Gradient Volume is an innovative volume analysis indicator based on artificial intelligence technology for the MT4 platform. By converting the volume data into an intuitive color gradient graph, it helps traders to have a more acute insight into the inflow and outflow of funds in the market and the strength of the buying and selling forces, so as to provide strong support for trading
Gann Recovery Expert Advisor - Advanced Trading System for MT4 Revolutionary Trading Strategy with Built-in Recovery System This sophisticated Expert Advisor combines the power of Gann Hi-Lo technical analysis with an intelligent recovery-based position sizing system to create a robust automated trading solution. The EA is specifically designed to maximize profitability while managing risk through advanced money management techniques. Key Features & Trading Logic Gann Hi-Lo Signal Generati
インディケータを使用すると、現在の価格の方向性と市場のボラティリティを判断できます。このバージョンのTradersDynamic Indexでは、履歴データの再描画が排除され、アルゴリズムの計算速度が最適化され、より正確な調整のための外部パラメーターが増え、その機能が拡張されました。初期オシレーターの選択と平均の平滑化方法が追加されました。 。 パラメーター: Mode Osc - 推定発振器の選択 Period Osc - 使用する発振器の計算期間 Price Osc - 振動計算の適用価格 Osc volatility bands period - オシレーターのボラティリティ期間 Osc volatility bands multiplier - オシレーターのボラティリティ乗数 Smoothing Osc price line period - 本線の平滑化期間 Smoothing Osc price line method - 本線の平滑化方法 Smoothing Osc signal line period - 信号線の平滑化周期 Smoothing Osc signal
A combination of trend, pullback, range breakouts and statistics in one indicator Mainly functions as an Entry indicator. Works in any pair and timeframe. Suggested Combination Cluster Helix with Strength Meter Strategy: Confirm signals with ideal strength levels Watch Video: (Click Here) Features Detects range breakouts on pullback zones in the direction of the trend Analyzes statistics of maximum profits and calculates possible targets for the next signal Flexible tool, can be used in many w
The SPV Body indicator displays the average analysis of the intersection of adjacent bars. The indicator can easily detect unusual market movements which can be used as a filter. For clarity, poke the graphs to the very beginning of the history when the bars were incomplete, and the indicator will easily display this anamaly. A very effective system for building various filters and confirmations of market entry, to exclude anomalies from trading. It also fixes cyclicity, it turns out that the in
Deep Insight Candles is an indicator that brings an entirely new perspective to the price chart. It focuses on revealing hidden structures in market movements, uncovering buyer and seller pressure, thus helping traders to better identify key levels, dynamics, and potential reversals. The indicator conveys deeper market insights, allowing traders to make decisions based on a more accurate perception of market sentiment and pressure at specific price levels. This innovative approach transforms the
AXIOM FVG + Order Block Pro v4.1 Professional ICT/SMC Institutional Trading Indicator Overview AXIOM FVG + Order Block Pro   is a professional non-repainting indicator for MetaTrader 5 that automatically detects and displays   Fair Value Gaps (FVGs)   and   Order Blocks (OBs)   based on ICT (Inner Circle Trader) and SMC (Smart Money Concepts) methodologies. Built with institutional-grade precision, this tool helps traders identify high-probability supply and demand zones where smart money enters
Market Profile with Dashboard Indicator - Complete User Guide indicator Overview The Market Profile with Dashboard is a comprehensive trading analysis tool for MetaTrader 4 that displays market profile data, volume analysis, and key market structure information directly on your chart. This indicator helps traders identify significant price levels, market balance areas, and potential trading opportunities based on market profile theory. Core Components and Features Market Profile Display - Sh
Volume indicator Effect Volume , in the Forex market volumes are unique (tick). This volume indicator demonstrates the level of financial and emotional involvement. When the indicator forms a new top, it indicates that buyers are stronger than sellers over a certain period of time. If the indicator decreases, this indicates that the bears are stronger. Why is it impossible to track normal volumes in Forex? The fact is that this is an over-the-counter market. Consequently, it is practically imp
Características principales: Estrategia de scalping : El Crow Candles Scalping EA se enfoca en aprovechar movimientos rápidos en el mercado . La estrategia se basa en la identificación de patrones de velas y análisis técnico para tomar decisiones de entrada y salida. 2.Gestión de riesgos avanzada: El EA incorpora una gestión de riesgos sólida para proteger tu cuenta de operaciones. Puedes ajustar los parámetros de stop-loss y take-profit para adaptar el nivel de riesgo a tus preferencias. 3.Con
Crypto_Forex MT4用インジケーター「 Trend Flat Pro Histogram 」(リペイント不要) - 「Trend Flat Pro Histogram」インジケーターは非常に高感度で、標準的な移動平均線よりもはるかに効率的です。 - 現在の市場状況(フラット、上昇トレンド、下降トレンド)を表示するように設計されています。 - インジケーターは3色で表示されます。フラット市場状況は黄色、下降トレンドは赤、上昇トレンドは緑です(色は設定で変更できます)。 - モバイルとPCの両方でアラート機能を搭載しています。 - このインジケーターは、プライスアクション、スキャルピング、モメンタムトレード、その他のインジケーターなど、他の取引手法と組み合わせるのに最適です。 - インジケーターには情報ディスプレイが搭載されており、接続された通貨ペアの現在のスプレッドとスワップが表示されます。 - 画面には、口座残高、エクイティ、マージンも表示されます。 - 情報ディスプレイはチャートの任意の場所に配置できます。 高品質のトレーディングロボットとインジケーターをご覧になるには
スピードスカルパープロ  新商品をプレゼントします。  これは宇宙への飛行ではなく、余分な利益の約束でもなく、お金の強要でもなく、詐欺でもありません。 それは私達のチームがずっと長年にわたってしているちょうど何かです。  においては、改善のロボットのためにこれらのロボットを簡単にします。 このロボットは2013年以来、本当に安定しており、私があなたを欺くことには意味がありません。 何人人々が販売で今しているか話しましょう。 あなたはまだ戦略テスターからの美しい写真を信じて、たくさんのお金のために突くで豚を購入する準備ができていますか? このロボットではないです。 あなたはまだ月額パーセントの利益の数百と数千を期待していますか、そしてブローカーはあなたが毎月そのような膨大な量を撤回することができま あなたはまだナイーブです。 あなたは"グリッドではなく、マーチンゲールではなく、実際のダニでテストされた"というような言葉に魅了されていますか? ここに無意味なスローガンはありません。 でも製品を美しいパネルや写真のように見え。 私はあなたを頼む、プロの開発者は、子供の絵を描くための時間が
The Volli v9 indicator is based on the analysis of zones built on volumes. That is, it is based on the analysis of how the price behaves near/in these zones, whether it rebounds, moves further, or does not react.   The indicator also displays the aggregate strength of currencies, recommended stops, trend direction, volume trend and their changes. Also there is EA. https://www.mql5.com/en/market/product/145026?source=Site +Profile Description 1) The arrows. Drawn on the current candle. On the
MT4バージョン: https://www.mql5.com/ja/market/product/125756 MT5バージョン: https://www.mql5.com/ja/market/product/157655 このオールインワンインジケーターは、リアルタイムの「市場構造」(内部およびスイングBOS/CHoCH)、注文ブロック、プレミアムゾーンとディスカウントゾーン、イコールハイとイコールローなどを表示し、トレーダーは広く使用されているプラ​​イスアクション手法でチャートを自動的にマークアップできます。フェアバリューギャップスクリプトのリリース後、コミュニティから同じカテゴリの機能追加を求める多くの要望をいただきました。 「市場構造」は、流動性をより正確に把握し、市場におけるより最適な関心ポイントを見つけたいと考えているプラ​​イスアクショントレーダーの間では、比較的新しい用語ですが、広く使用されています。機関投資家の注文がどこに出されているか(買い側または売り側の流動性)を把握することは、プライスアクションに基づいてより実用的なエントリーとエグジットを見つけるための
Warning: Our product works with 28 symbols. The average accuracy level of the signals is 99%. We see signals below 15 pips as unsuccessful. Technique Signal   indicator is designed for signal trading. This indicator generates trend signals. It uses many algorithms and indicators to generate this signal. It tries to generate a signal from the points with the highest trend potential. This indicator is a complete trading product. This indicator does not need any additional indicators. The indi
このインジケーターは、離散ハートレー変換に基づいています。この変換を使用すると、財務時系列を処理するときにさまざまなアプローチを適用できます。このインジケーターの特徴は、その読み取り値がチャート上の1つのポイントではなく、インジケーター期間のすべてのポイントを参照していることです。 時系列を処理する場合、インジケーターを使用すると、時系列のさまざまな要素を選択できます。フィルタリングの最初の可能性は、このアプローチに基づいています。不要な高周波成分はすべて単に破棄されます。最初の図は、この方法の可能性を示しています。CutOffパラメーターを選択すると、元の時系列の詳細を選択できます(赤い線-主要な情報のみが残りますCutOff = 0、黄色-主要な最低周波数期間CutOff = 1 、青-最も高周波のノイズはすべて破棄されますCutOff = 4)。ただし、これが唯一の可能性ではありません。ノイズ成分は、追加のフィルタリングで抑制できます。 このインジケーターには両方のオプションが実装されています。そのパラメータは次のとおりです。 iPeriod-インジケーター期間 Shift-現
The indicator displays peak levels of activity formed by the maximum volume, tracks the correlation of the candles on all timeframes (from the highest to the lowest one). Each volume level is a kind of key trading activity. The most important cluster is inside a month, week, day, hour, etc. Indicator operation features A volume level receives Demand status if the nearest volume level located to the left and above has been broken upwards. A volume level receives Supply status if the nearest volu
This is the original, simpler version of our core EURUSD algorithm (it calculates and displays 2 lines rather than 3), but it is still capable of detecting levels in the market where EURUSD will likely move to. These levels are indicated by unusual large gaps, formed by the two lines. Detailed guidance is given to users.  All in all it works on the very short term,  and more importantly on the daily chart. The differences between this and our top EURUSD indicator, is that this one only displays
A unique trading strategy is based on controlling trading volumes at various levels of volatility. The trade expert automatically determines the zones of purchases and sales and the degree of mathematical probability of successful forecasting of each transaction. If there are sufficient conditions and a high degree of probability of profit, the adviser starts work. Hazardous trading methods are not used. Each trade is protected by stop loss. Profit control is carried out by a special strategy f
このプロダクトを購入した人は以下も購入しています
Scalper Inside PRO – Since 2020. An exclusive indicator that utilizes an innovative algorithm to swiftly and accurately determine the market trend. The indicator automatically calculates opening, closing, and profit levels, providing detailed trading statistics. With these features, you can choose the most appropriate trading instrument for the current market conditions. Additionally, you can easily integrate your own arrow indicators into Scalper Inside Pro to quickly evaluate their statistics
ご紹介     Quantum Breakout PRO は 、ブレイクアウト ゾーンの取引方法を変革する画期的な MQL5 インジケーターです。 13年以上の取引経験を持つ経験豊富なトレーダーのチームによって開発された Quantum Breakout PROは 、革新的でダイナミックなブレイクアウトゾーン戦略により、あなたの取引の旅を新たな高みに押し上げるように設計されています。 クォンタム ブレイクアウト インジケーターは、5 つの利益ターゲット ゾーンを備えたブレイクアウト ゾーン上のシグナル矢印と、ブレイクアウト ボックスに基づいたストップロスの提案を提供します。 初心者トレーダーにもプロのトレーダーにも適しています。 量子EAチャネル:       ここをクリック MT5バージョン:   ここをクリック 重要!購入後、インストールマニュアルを受け取るためにプライベートメッセージを送ってください。 推奨事項: 時間枠: M15 通貨ペア: GBPJPY、EURJPY、USDJPY、NZDUSD、XAUUSD アカウントの種類: ECN、Raw、またはスプレッドが非
このインジケーターを購入すると、プロ仕様のトレードマネージャーを無料で差し上げます。 まず第一に、このトレーディングシステムがノンリペイント、ノンリドロー、ノンラグのインジケーターであることを強調する価値がある。これにより、手動取引とロボット取引の両方に理想的なものになっています。 オンラインコース、マニュアル、プリセットのダウンロード。 「スマートトレンドトレーディングシステム MT5」は、新規および経験豊富なトレーダー向けにカスタマイズされた包括的なトレーディングソリューションです。10以上のプレミアムインジケーターを組み合わせ、7つ以上の堅実なトレーディング戦略を備えており、多様な市場状況に対応する多目的な選択肢となっています。 トレンドフォロー戦略:トレンドを効果的に乗り越えるための正確なエントリーとストップロス管理を提供します。 リバーサル戦略:潜在的なトレンドの反転を特定し、トレーダーがレンジ相場を活用できるようにします。 スキャルピング戦略:高速で正確なデイトレードおよび短期取引のために設計されています。 安定性:すべてのインジケーターはノンリペイント、ノンリドロー、ノ
これはほぼ間違いなく、MetaTraderプラットフォームで見つけることができる最も完全な調和価格形成自動認識インジケーターです。 19種類のパターンを検出し、フィボナッチプロジェクションをあなたと同じように真剣に受け止め、潜在的逆転ゾーン(PRZ)を表示し、適切なストップロスとテイクプロフィットレベルを見つけます。 [ インストールガイド | 更新ガイド | トラブルシューティング | よくある質問 | すべての製品 ] 19の異なる調和価格形成を検出します プライマリ、派生および補完フィボナッチ投影(PRZ)をプロットします 過去の価格行動を評価し、過去のすべてのパターンを表示します この指標は、独自の品質とパフォーマンスを分析します 適切なストップロスとテイクプロフィットのレベルを表示します ブレイクアウトを使用して適切な取引を通知します すべてのパターン比をグラフにプロットします 電子メール/音声/視覚アラートを実装します スコット・M・カーニーの本に着想を得て、この指標は最も純粋で急を要するトレーダーのニーズを満たすように設計されています。ただし、トレードを容易にする
Please send me Direct message on MQL5 CHAT after purchasing the Indicator for Training and Installation Support There are some additional files that is important to use with the Indicator . So be sure to contact me after purchasing the Indicator So that I can add you for training and support . If you find any difficulty with installation then send me Direct message here So that I can connect with you via Anydesk or Teamview for the product installation. " Smart Order Block Indicator " to find m
ゴールドラッシュ・トレンド・アロー・シグナル ゴールドラッシュ・トレンド・アロー・シグナル 指標は、XAU/USDにおける高速・短期スキャルパー向けに最適化された、正確でリアルタイムのトレンド分析を提供します。 1分足専用に設計されたこのツールは、明確なエントリーポイントを示す方向矢印を表示し、スキャルパーが変動の激しい市場状況でも自信を持って取引できるよう支援します。 この指標は、PRIMARY(主要)とSECONDARY(補助)のアラート矢印で構成されています。PRIMARYシグナルは、トレンドの方向転換を示す白と黒の方向矢印であり、SECONDARYシグナルは、PRIMARY矢印が示す方向を確認し、潜在的なエントリーポイントを示す青と赤の矢印です。 注意:トレンド方向の変化後にPRIMARYアラート矢印が1つだけ表示される場合、複数のSECONDARY青/赤矢印が表示される点に注意が必要です。SECONDARYシグナルは、シグナル基準を満たす任意のローソク足後に表示されます。したがって、長期的なトレンド移動の場合、画面に多くのSECONDARY矢印が表示されます(添付の
「 Dynamic Scalper System 」インジケーターは、トレンド波の中でスキャルピング取引を行う手法のために設計されています。 主要通貨ペアと金でテスト済みで、他の取引商品との互換性があります。 トレンドに沿った短期的なポジションオープンのシグナルを提供し、追加の価格変動サポートも提供します。 インジケーターの原理 大きな矢印はトレンドの方向を決定します。 トレンド波の中では、小さな矢印の形でスキャルピングシグナルを生成するアルゴリズムが機能します。 赤い矢印は強気方向、青い矢印は弱気方向です。 トレンドの方向には敏感な価格変動ラインが描かれ、小さな矢印のシグナルと連動します。 シグナルは次のように機能します。適切なタイミングでラインが現れるとエントリーシグナルが形成され、ラインが開いている間はポジションが保持され、完了すると取引が終了します。 推奨される動作時間枠はM1~H4です。 矢印は現在のローソク足に形成され、次のローソク足が開いている場合は、前のローソク足の矢印は再描画されません。 入力パラメータ Trend Wave Period - トレンド方向
トレンドトレーディング は、タイミングのプルバックとブレイクアウトにより、市場で起こっているトレンドから可能な限り利益を得るように設計された指標です。確立されたトレンドの中で価格が何をしているかを分析することにより、取引の機会を見つけます。 [ インストールガイド | 更新ガイド | トラブルシューティング | よくある質問 | すべての製品 ] 自信を持って効率的に金融市場を取引する むち打ちにならずに確立されたトレンドから利益を得る 収益性の高いプルバック、ブレイクアウト、早期の逆転を認識する この指標は、独自の品質とパフォーマンスを分析します 複数時間枠のダッシュボードを実装します インジケーターは再描画されていません 電子メール/音声/視覚アラートを実装します 確立されたトレンドは多くの取引機会を提供しますが、ほとんどのトレンド指標はそれらを完全に無視しています。インジケーターの解釈はかなり簡単です: (1) トレンドの変化 (2) トレンドの方向への後退 (3) トレンドの方向へのブレイクアウト 赤いダッシュ は下降トレンド中の修正です 青いダッシュ は上昇トレンド中
GOLD Impulse with Alert
Bernhard Schweigert
4.67 (12)
このインディケータは、当社の2つの製品 Advanced Currency IMPULSE with ALERT  +   Currency Strength Exotics . のスーパーコンビネーションです。 このインジケーターは全ての時間枠で作動し、8つの主要通貨と1つのシンボルの強弱のインパルスをグラフで表示します。 このインジケータは、金、エキゾチックペア、商品、インデックス、先物など、あらゆるシンボルの通貨強度の加速度を表示することに特化されています。金、銀、原油、DAX、US30、MXN、TRY、CNHなどの通貨強度の加速度(インパルスまたは速度)を表示するために、任意のシンボルを9行目に追加できる、この種の最初のものです。 新しいアルゴリズムに基づいて構築され、潜在的な取引の特定と確認がさらに容易になりました。これは、通貨の強さや弱さが加速しているかどうかをグラフィカルに表示し、その加速の速度を測定するためです。加速すると物事は明らかに速く進みますが、これはFX市場でも同じです。つまり、反対方向に加速している通貨をペアリングすれば、潜在的に利益を生む取引を特定
Advanced Supply Demand
Bernhard Schweigert
4.91 (300)
現在40%オフ 初心者にもエキスパートトレーダーにも最適なソリューション このインジケーターは独自の機能と新しい公式を多数内蔵しており、ユニークで高品質かつ手頃な取引ツールです。このアップデートでは、2つの時間枠ゾーンを表示できるようになります。より長いTFだけでなく、チャートTFとより長いTF(ネストゾーンを表示)の両方を表示できます。すべてのSupply Demandトレーダーの皆さんのお気に召すはずです。:) 重要情報の公開 Advanced Supply Demandの可能性を最大化するには、 https://www.mql5.com/ja/blogs/post/720245 にアクセスしてください。   エントリーまたはターゲットの正確なトリガーポイントを正確に特定できれば取引がどのように改善されるか想像してみてください。新しい基盤となるアルゴリズムに基づいて構築されているため、買い手と売り手の間の潜在的な不均衡をさらに簡単に特定できます。これは、最も強い需要と供給のゾーンと、過去のパフォーマンス(古いゾーンを表示)がグラフィカルに表現されるためです。これらの機能は、最適な
このインディケータは、異なる期間のフラクタルの価格構造を調べて、市場で起こり得る反転ポイントを決定し、すでに基本的または技術的な評価モデルを持っているポジショントレーダーにタイミングを提供します。弟の リバーサルフラクタル とは異なり、このインジケーターは選択された期間のためにリバーサルを逃すことはなく、ジグザグ形式でリバーサルフラクタルを見つけます。 [ インストールガイド | 更新ガイド | トラブルシューティング | よくある質問 | すべての製品 ] ターニングポイントは長いトレンドを開始できます インジケーターは再描画されていません あらゆる種類のアラートを実装します カスタマイズ可能な色とサイズ フラクタルは奇数番目のバーのフォーメーションであり、フォーメーションの最上位または最下位の中間バーであり、フラクタル内のすべてのバーが閉じるとインディケーターが描画されるため、このインジケーターはリアクティブまたは遅れ信号です。ただし、既存の方向バイアスを持つトレーダーは、この指標が非常に有用であり、早期のエントリポイントを取得します。 このインディケーターは、ボイルダウンされた
サポート線と抵抗線のプロットにうんざりしていませんか? サポートレジスタンス は、非常に興味深いひねりを加えてチャート内のサポートとレジスタンスラインを自動検出およびプロットするマルチタイムフレームインジケーターです。価格レベルは時間とともにテストされ、その重要性が高まるにつれて、ラインは太くなり、暗くなります。 [ インストールガイド | 更新ガイド | トラブルシューティング | よくある質問 | すべての製品 ] 一晩でテクニカル分析を強化 チャートを閲覧せずに重要な価格レベルを検出 一目ですべての価格レベルの相対的な強さを認識する すべての取引で最大30時間のプロットラインを節約 インジケーターは、すべての価格レベルの年齢を表示します インジケーターは再描画されていません 過去および現在の価格レベルは近接によって崩壊し、現在の市場行動に合わせて調整されます。動作は、必ずしもピークではない場所に線が引かれます。 価格レベルは、時間とともに拒否されるにつれて、より暗く、より広くなります ノイズを避けるために、重要でない価格レベルは定期的にクリアされます カスタマイズ可能な時間枠の
They say history repeats itself. What if you could prove it in real-time? The Propfolio Ghost Pattern is an advanced algorithmic pattern-matching engine. It empowers you to select any current price action structure on your chart and instantly scan thousands of historical candles to find the exact moment in the past where the market did the exact same thing. Once it finds the highest probability match, it projects the historical outcome into the future as "Ghost Candles"—giving you a highly calcu
まず第一に、この取引インジケーターは再描画されず、再描画されず、遅延しないことを強調する価値があります。これにより、手動取引とロボット取引の両方に理想的なものになります。 ユーザーマニュアル:設定、入力、戦略。 アトミックアナリストは、価格の強さとモメンタムを利用して市場でより良いエッジを見つけるためのPA価格アクションインジケーターです。ノイズや誤ったシグナルを除去し、取引ポテンシャルを高めるための高度なフィルターを備えています。複雑なインジケーターの複数のレイヤーを使用して、アトミックアナリストはチャートをスキャンし、複雑な数学的計算をシンプルなシグナルと色に変換します。これにより、どのような初心者トレーダーでも理解して使用し、一貫した取引の決定を行うことができます。 「アトミックアナリスト」は、新規および経験豊富なトレーダー向けにカスタマイズされた包括的な取引ソリューションです。プレミアムインジケーターとトップノッチの機能を1つの取引戦略に組み合わせ、すべてのタイプのトレーダーにとって汎用性のある選択肢にします。 デイリートレーディングとスキャルピング戦略:高速で正確な
現在26%OFF! このインディケータは、当社のメインインディケータ( Advanced Currency Strength 28   &  Advanced Currency IMPULSE with ALERT )の両方のスーパーコンビネーションです。28の外国為替ペアのTICK-UNITSとアラートシグナルの通貨強度の値を示しています。11種類のTick-Unitが使用可能です。1、2、3、4、5、6、10、12、15、20、30秒の11種類です。サブウィンドウのTick-Unitバーは、秒単位のタイマーに1ティック以上含まれる場合に表示され、左側にシフトされます。 たった1枚のチャートで、28のFXペアをスキャルピングできます。スキャルピングのチャンスとなるトリガーポイントを正確に把握することで、スキャルピングが上達することを想像してみてください。 1分足よりも短い期間で動作する市場初の通貨強度インジケーターです! このインジケータは、素早いインとアウトを行い、小さなピップを切り取ることを望む高速スキャルパーのためのものです。 ユーザーマニュアル: ここをクリック h
KURAMA GOLD SIGNAL PRO(MT4版)— 7層フィルター・自動TP/SL・品質スコア搭載 XAUUSD完全トレードシステム リペイントなし。リドローなし。ラグなし。すべてのサインは確定後に変わりません。見たままが結果です。 特典:買い切りライセンスをご購入いただいた方に、AI Zone Radar($59相当)+PDFマニュアルを無料プレゼント。購入後にMQL5でメッセージをお送りください。 AI Zone Radar: https://www.mql5.com/en/market/product/175834 トレーダーから信頼されています:ゴールドトレーダーのコミュニティで実際に使用され、精度と使いやすさで高く評価されています。 あなたの問題 — そしてその解決策 ゴールドは1日$30〜$50動く。チャンスがあるのは分かっている。でもこういう経験はないか: - エントリーが早すぎて、$10逆行してから思った方向に動く - MAタッチのたびに入って、半分は負ける - TP/SLの基準がないから、持ちすぎるか早すぎる決済をする - 動かない時間帯にトレ
現在40%オフ 初心者やエキスパートトレーダーに最適なソリューション! このインジケーターは、独自の機能と新しい計算式を取り入れた、ユニークで高品質、かつ手頃な価格のトレーディングツールです。たった1枚のチャートで28の為替ペアの通貨強度を読み取ることができます。新しいトレンドやスキャルピングチャンスの引き金となるポイントを正確に特定することができるので、あなたのトレードがどのように改善されるか想像してみてください。 ユーザーマニュアルはこちら  https://www.mql5.com/en/blogs/post/697384 これが最初の1本、オリジナルだ! 価値のないクローンを買わないでください。 特別な サブウィンドウの矢印で強い通貨の勢いを表示 GAPがあなたのトレードを導く! 基準通貨や気配値が売られすぎ・買われすぎのゾーン(外相フィボナッチレベル)にあるとき、個別チャートのメインウィンドウに警告表示。 通貨がレンジの外側から反落した場合、プルバック/リバーサルのアラート。 クロスパターンの特別なアラート 複数の時間枠を選択可能で、トレンドを素早く確認できます
チャートを構成し、周期的な価格変動を識別するテクニカル指標。 どのチャートでも動作します。 いくつかの種類の通知。 グラフ自体に追加の矢印があります。 履歴を再描画せずに、キャンドルのクローズに取り組みます。 M5以上のTFを推奨します。 パラメータの使用と設定が簡単です。 異なるパラメータを持つ 2 つのインジケーターを使用する場合、他のインジケーターなしで使用できます。 入力パラメータは2つあります 周期性と信号持続時間 これら 2 つのパラメータは、チャート構造の処理を扱います。 Cyclicity - 反転サイクルが変化する頻度を調整し、サイクルを滑らかにします。 Signal duration - 最小数では価格変動の衝動を検出し、最大数では長期的なトレンドの動きを検出します。
The indicator is built on a non-standard Zig Zag, it draws accumulations after which if the price leaves this zone and a test of this zone occurs, then a sound signal is given and an arrow appears - after the test candle closes.The indicator does not redraw its signals, it is very easy to use, there are only three settings 1- this is the zig zag parameter 2- this is the minimum price exit from the zone 3- this is the maximum price exit from the zone. The lower the parameter for Zig Zag, the more
Delta Fusion Pro – 日中取引のための高度なオーダーフロー分析 Delta Fusion Pro は MetaTrader 4 用のプロフェッショナル指標で、アグレッシブな注文フローを明らかにし、機関投資家の圧力の強度と方向をリアルタイムで表示します。従来のボリューム指標とは異なり、Ask と Bid のボリューム差(デルタ)を分析し、反転の予測、トレンドの確認、プロフェッショナルな関心ゾーンの特定を可能にします。 主な特徴 インテリジェント自動調整システム 以下に基づき、すべてのパラメータを自動調整: 銘柄タイプ(FX、暗号資産、指数、コモディティ、株式) 運用タイムフレーム 市場のボラティリティ(ATR) 最近の平均ボリューム 初心者トレーダー向けに手動設定不要 — インジケーターが自動でキャリブレーション! 機能概要 NetDelta と累積デルタ Ask/Bid のアグレッシブボリューム差を計算、カスタマイズ可能な EMA スムージング リアルタイムで方向性圧力を表示 ヒストグラムの色をカスタマイズ(買い/売り) 価格/ボリュームのダイバージェンス 通常お
現在40%オフ! 初心者やエキスパートトレーダーに最適なソリューション! このインジケータは、独自の機能と秘密の数式を組み込んだ、ユニークで高品質かつ手頃な価格のトレーディングツールです。たった1枚のチャートで28の通貨ペアのアラートを表示します。新しいトレンドやスキャルピングチャンスの引き金となるポイントを正確に把握することができるので、あなたのトレードがどのように改善されるか想像してみてください! 新しい基本的なアルゴリズムに基づいて構築されているため、潜在的な取引の特定と確認がより簡単になります。これは、通貨の強さや弱さが加速しているかどうかをグラフィカルに表示し、その加速のスピードを測定するためです。加速すると物事は明らかに速く進みますが、これはFX市場でも同じです。つまり、反対方向に加速している通貨をペアにすれば、利益を生む可能性のある取引を特定することができるのです。 通貨の勢いを示す縦の線と矢印は、あなたの取引の指針となるでしょう。 ダイナミックマーケットフィボナッチ23レベルはアラートトリガーとして使用され、市場の動きに適応します。もしインパルスが黄色のトリガ
Send us a message after your purchase to receive more information on how to get your  BONUS  for FREE  that works in great combination with Bull vs Bear ! Bull versus Bear is an easy-to-use Forex indicator that gives traders clear and accurate signals based on clear trend retests . Forget about lagging indicators or staring at charts for hours because  Bull vs Bear provides real-time entries with no lag and no repaint, so you can trade with confidence. Bull vs Bear  helps you enter trades during
Gold PL MTF - これは優れた株式テクニカル指標です。指標アルゴリズムは、資産価格の動きを分析し、フィボナッチ法 (黄金比) を使用して、指定された時間枠 (TF) の重要なピボット レベルを自動的に反映します。 指標は、選択した時間枠 (日、週、月、年) の価格軌道を完全に表し、トレンドの開始と、逆のトレンドに発展する可能性のある修正の開始を決定します。 指標はまた、価格マグネットとして機能する、さまざまな時間枠の現在の未処理のピボット レベルを表示します。これにより、市場の状況をすばやく評価し、取引の開始または終了を決定できます。各取引の潜在的可能性は、平均 50 ~ 1000 ポイントです。 指標を使用すると、さまざまな時間枠での価格変動の可能性のある方向を評価でき、最も可能性の高いターゲットと価格変動の可能性も示します。 指標の利点: 1. 指標は、高精度で信号を生成します。 2. ピボット レベルは消えず、再描画されません。FPバッファーの確認された矢印シグナルは、トレンドが強い場合にのみ再構築できます。 3. どのブローカーのMetaTrader 4取引
Gold Venamax   - これは最高の株式テクニカル指標です。 指標アルゴリズムは資産の価格変動を分析し、ボラティリティと潜在的なエントリーゾーンを反映します。 インジケーターの機能: これは、快適で収益性の高い取引のためのマジックとトレンド矢印の 2 つのブロックを備えたスーパー インジケーターです。 チャート上にブロックを切り替えるための赤いボタンが表示されます。 マジックはインジケーター設定で設定されているため、異なるブロックを表示する 2 つのチャートにインジケーターをインストールできます。 Gold Venamax は、異なる矢印バッファー (GV と SD) を備えた 2 つのチャートに配置できます。 これを行うには、設定で異なる Magic を選択する必要があります。たとえば、あるマジック = 999、別のマジック = 666 を選択します。次に、チャート上の赤いボタンで矢印バッファを選択できます。 インジケーター設定の各矢印バッファー (GV および SD) には、快適で収益性の高い取引のための個別の矢印フィルターがあります (UseFiltrGV = tru
このインジケーターは、反転ポイントと価格戻りゾーンを正確に表示します。     主要プレーヤー 。新たなトレンドが形成される場所を把握し、最大限の精度で意思決定を行い、すべての取引をコントロールします。 TREND LINES PRO インジケーターと組み合わせることで、その潜在能力を最大限に発揮します。 VERSION MT5 インジケーターが示す内容: 新しいトレンドの始まりに活性化する反転構造と反転レベル。 リスクと報酬の比率を最小限に抑えた利益 確定 と 損失停止の レベルの表示     RR 1:2   。 インテリジェントな削減ロジックによるストップロス。 指定されたインジケーターから 2 つのトレンド タイプの反転パターンを表示します。 指標: トレンドを追う   TREND LINES PRO   (世界的なトレンドの変化) TREND PRO   (クイックトレンド変更) シンプルで効果的   スキャナー   リアルタイムトレンド(新機能)。 マルチタイムフレームのインストゥルメント フィルタリング。 画面   利益     LOGIC AI信号の後。 当日プラス方
まず第一に、この取引ツールはノンリペイント、ノンリドロー、ノンラグの指標であり、プロの取引に理想的ですことを強調する価値があります。 オンラインコース、ユーザーマニュアル、デモ。 スマートプライスアクションコンセプトインジケーターは、新米から経験豊富なトレーダーまで、非常 に強力なツールです。Inner Circle Trader AnalysisやSmart Money Concepts Trading Strategiesなど、20以上の有用な指標を1つに組み合わせています。このインジケーターはスマートマネーコンセプトに焦点を当て、大手機関の取引方法を提供し、彼らの動きを予測するのに役立ちます。 特に、流動性分析に優れており、機関がどのように取引しているかを理解しやすくしています。市場のトレンドを予測し、価格の動きを慎重に分析するのに優れています。機関の戦略とトレードを合わせることで、市場の動向についてより正確な予測ができます。このインジケーターは多目的であり、市場構造を分析し、重要な注文ブロックを特定し、さまざまなパターンを認識するのに優れています。 このインジケーターは
NAM Divergences
NAM TECH GROUP, CORP.
5 (1)
MT4マルチタイムフレームの発散と売られ過ぎ/売られ過ぎの検出インジケーター。 特徴 -チャートコントロールパネルで完全にカスタマイズ可能で、完全な相互作用を提供します。 -必要な場所でコントロールパネルを表示および非表示にします。 -資本化されていない発散に関するリアルタイムの情報。 -売られ過ぎ/売られ過ぎの状況に関するリアルタイム情報。 -定期的な発散に関するリアルタイムの情報。 -隠れた発散に関するリアルタイム情報。 -発散検出に使用できる発振器:AO、RSI、CCI、MACD、STOCH、RMI、TDI、RSIOMA。 -通知サービス(画面アラート|プッシュ通知)。 概要 発散取引を使用すると、弱体化傾向や勢いの逆転を見つけるのに役立ちます。トレンドが続くためのシグナルとして使用できる場合もあります。私たちのツールは、チャートを可能な限りクリーンに保つために、表示と非表示の可能性を備えた驚くほど快適で直感的なコントロールパネルで、すべての時間枠で同時に発散検出を提供します。 選択した履歴期間に、買われ過ぎと売られ過ぎの状況、通常の相違、隠れた相違
Super Signal – Skyblade Edition プロ仕様のノンリペイント / ノーラグ・トレンドシグナルシステム。卓越した勝率を実現 | MT4 / MT5 対応 1分足、5分足、15分足などの低い時間足で最も効果を発揮します。 主な特徴: Super Signal – Skyblade Edition は、トレンド取引に特化したスマートなシグナルシステムです。マルチレイヤーのフィルターロジックを用いて、明確な方向性と実際のモメンタムに支えられた強力なトレンドのみを検出します。 このシステムは 天井や底を予測するものではありません 。次の3つの条件がすべて満たされた場合にのみシグナルを発生させます: 明確なトレンド方向 モメンタムの増加 健全なボラティリティ構造 市場セッションに基づく流動性分析と組み合わせることで、シグナルの精度とタイミングがさらに向上します。 シグナルの特性: すべての矢印シグナルは 100% 非リペイント / 遅延なし 一度出現したシグナルは固定され、点滅・消失しません チャート上の矢印、情報パネル、ポップアップ通知、音声アラート、プッシュ通知
地震計マーケット クエイク検出器。 Description in English : https://www.mql5.com/en/market/product/113869?source=Site+Market+Product+Page#description How to use the Seismograph : https://www.mql5.com/en/market/product/113869#!tab=comments&page=2&comment=52806941 Create an EA : https://www.mql5.com/en/market/product/113869#!tab=comments&page=3&comment=52816509 どのような取引方法であれ、流動性の低い市場への参入は避けたいものです。 地震計は、市場が上昇する前に市場に参入する適切なタイミングに役立ちます。 しかし、忙しいはずの市場時間帯にエントリーするようにしたにもかかわらず、流動性の低い市場に閉じ込められてしまう人が多いのが実情です。 数時間待った後、
RelicusRoad Pro: 定量的市場オペレーティングシステム 【期間限定】無制限アクセス 70% OFF - 2,000人超のトレーダーと共に なぜ多くのトレーダーは「完璧な」インジケーターを使っても失敗するのでしょうか? それは、文脈を無視して 単一の概念 だけでトレードしているからです。文脈のないシグナルは単なるギャンブルです。勝ち続けるには、 根拠の重なり(コンフルエンス) が必要です。 RelicusRoad Proは単なる矢印インジケーターではありません。完全な 定量的市場エコシステム です。独自のボラティリティモデリングを用いて、価格が推移する「適正価値の道(Fair Value Road)」をマッピングし、ノイズと真の構造的ブレイクを判別します。 推測はやめましょう。機関投資家レベルの「ロード・ロジック」でトレードを。 コアエンジン:「Road」アルゴリズム システムの中心となる Road Algo は、市場環境にリアルタイムで適応するダイナミックなボラティリティチャネルです。 安全ライン(平衡点) と、価格が数学的に反転しやすい 拡張レベル を投影します。 Si
作者のその他のプロダクト
Этот индикатор основан на концепции "Дивергентных баров" из торговой системы "Торговый Хаос" Билла Вильямса. Он предназначен для автоматического выявления на графике специфических ценовых паттернов, которые могут указывать на потенциальные точки входа или смены тренда. Что такое Дивергентный бар (BDB)? Дивергентный бар - это свеча или бар на графике, который имеет определенные характеристики относительно предыдущего бара и линий индикатора Alligator (Челюсть, Зубы, Губы). В системе Билла Уильямс
FREE
Williams' Market Dynamics Compass: Ваш навигатор в хаосе рынка! Устали от множества индикаторов и запутанных графиков? Williams' Market Dynamics Compass — это комплексный инструмент, который объединяет классические и проверенные временем стратегии Билла Уильямса в одном удобном решении. Индикатор поможет вам видеть рынок как единую, динамичную систему, а не набор случайных движений. Что внутри? Мультитаймфреймовый анализ AO (Awesome Oscillator): Получайте информацию о трендах на разных таймфре
Версия на английском языке  https://www.mql5.com/ru/market/product/148576?source=Site +Profile+Seller Это руководство создано, чтобы помочь начинающим трейдерам понять, как работает и настраивается индикатор "Sunday Open", а также как правильно интерпретировать его сигналы для принятия взвешенных торговых решений. Часть 1: Что такое индикатор Sunday Open и как его использовать? Основная идея В основе индикатора лежит простая, но мощная концепция: цена открытия недели является ключевым уровнем по
フィルタ:
レビューなし
レビューに返信