Gann Fan and Fibonacci Indicator MT4
Gann Fan and Fibonacci Indicator MT4
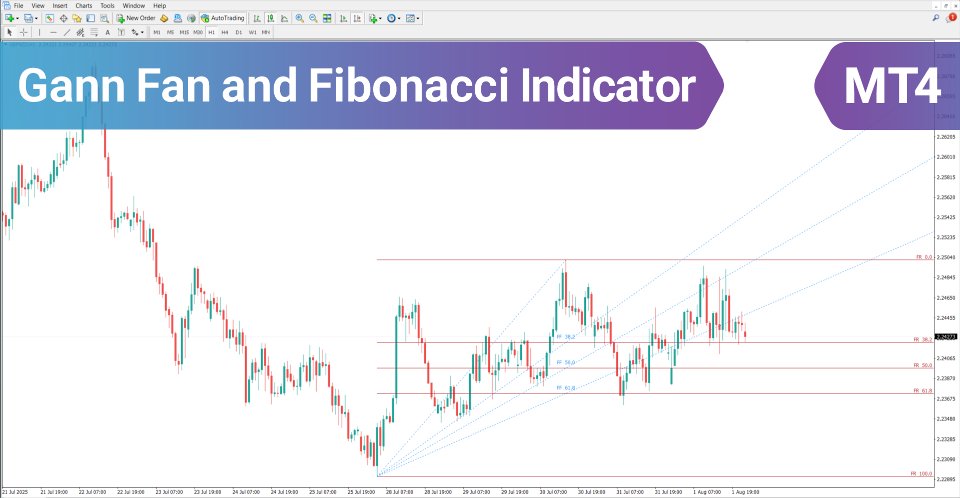
The Gann Fan and Fibonacci Indicator MT4 is an advanced analytical tool that merges two classical techniques in technical analysis. By integrating Gann’s angle-based methodology with Fibonacci retracement ratios, it provides traders with precise mapping of critical price and time zones across markets such as Forex, crypto, and equities.
Unlike indicators that rely solely on price fluctuations, this tool studies the balance between time and price by combining diagonal Gann lines with horizontal Fibonacci levels.
«Indicator Installation & User Guide»
MT4 Indicator Installation | Gann Fan and Fibonacci Indicator MT5 | ALL Products By TradingFinderLab | Best MT4 Indicator: Refined Order Block Indicator for MT4 | Best MT4 Utility: Trade Assistant Expert TF MT4 | TP & SL Tool: Risk Reward Ratio Calculator RRR MT4 | Prop Firm Protector: Prop Draw Down Protector Expert Advisor MT4 | Money Management: Easy Trade Manager MT4
Gann Fan and Fibonacci Indicator Table
| Category | Trading Tool – Momentum – Levels & Zones |
| Platform | MetaTrader 4 |
| Skill Level | Intermediate |
| Indicator Type | Continuation – Reversal |
| Timeframe | Multi-Timeframe |
| Trading Style | Intraday |
| Trading Market | All markets |
Gann Fan and Fibonacci Overview
On the MT4 terminal, the Gann Fan and Fibonacci indicator helps traders highlight areas of support, resistance, and potential turning points.
- Gann angles show the proportion between price movement and time progression, drawn as diagonal trend lines.
- Fibonacci retracements plot horizontal levels where market pullbacks or continuations may occur.
When both align, the probability of a reaction increases, giving traders more reliable entry and exit opportunities.
Indicator in an Uptrend
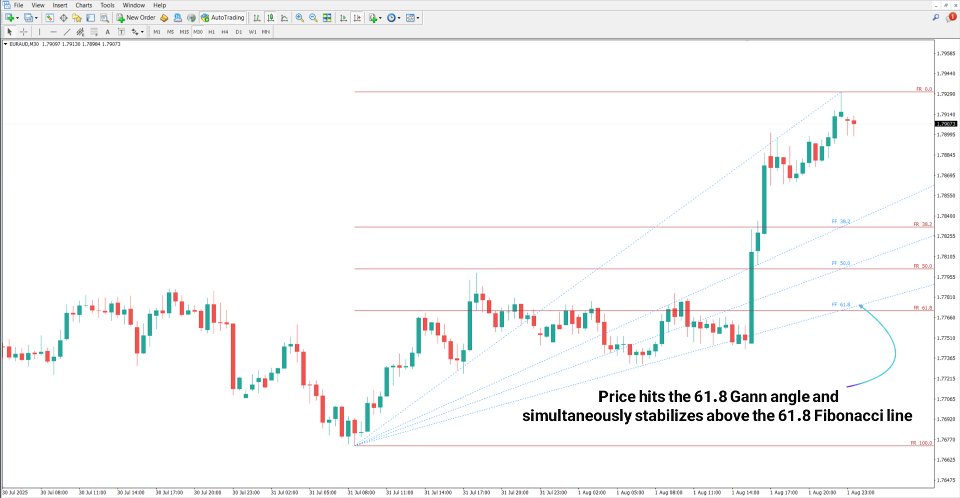
Example: On the EUR/AUD 30-minute chart, a bullish opportunity arises when price touches a Gann support angle while coinciding with a Fibonacci retracement (e.g., 61.8%). If price rebounds upward from that cluster, it is validated as a long trade entry.
Indicator in a Downtrend
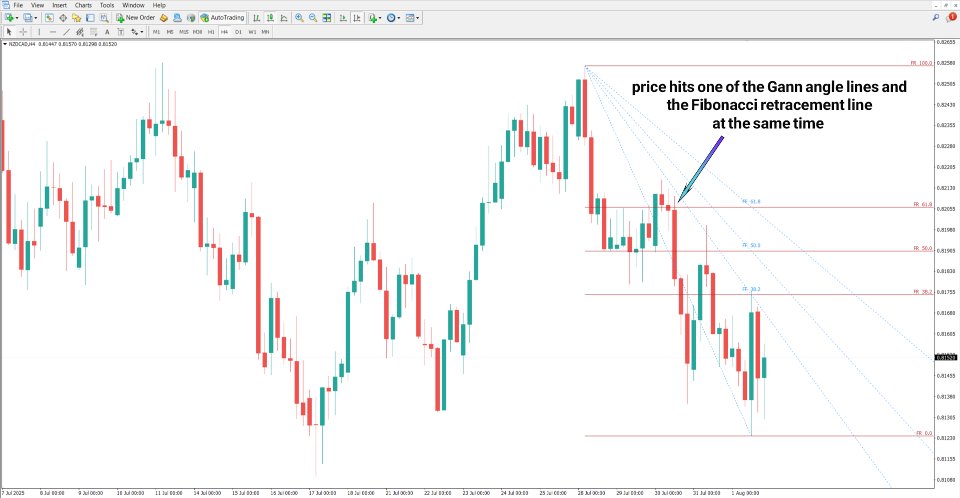
Example: On the NZD/CAD 4-hour chart, a bearish setup forms when price meets a Gann resistance angle overlapping with a Fibonacci retracement level. A stall in buying pressure at that area strengthens the signal for entering a short trade.
Gann Fan and Fibonacci Indicator Settings
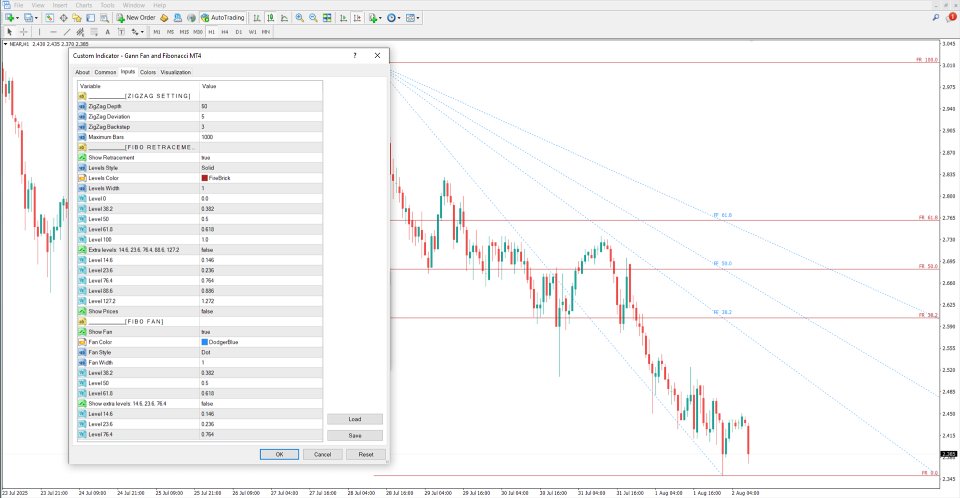
ZIGZAG SETTINGS
- ZigZag Depth – defines depth
- ZigZag Deviation – sets deviation
- ZigZag Backstep – minimum bar distance
- Maximum Bars – candles to analyze
FIBONACCI RETRACEMENT
- Show Retracement Levels
- Levels Style, Color, Width
- Key Levels: 0%, 38.2%, 50%, 61.8%, 100%
- Additional Levels: 14.6%, 23.6%, 76.4%, 88.6%, 127.2%
- Show Prices – display value labels
FIBONACCI FAN
- Show Fan – enable/disable fan lines
- Fan Color, Style, Width
- Core Levels: 38.2%, 50%, 61.8%
- Extra Levels: 14.6%, 23.6%, 76.4%
Conclusion
The Gann Fan and Fibonacci Indicator MT4 combines two time-tested methods—Gann angles and Fibonacci retracements—into one robust system. By overlaying price with time projections, it highlights high-probability reaction zones, offering traders an efficient way to spot reversals, support, and resistance levels in any market.
