Pause Manager Indicator

Pause Manager Indicator (for EA Pause Manager)

What It Is:

This is a lightweight chart indicator that works together with the EA Pause Manager utility. It displays the current status of your EAs and sends that information to the EA Pause Manager so it can pause/resume them correctly.  Required for proper functioning of EA Pause Manager.

Features:

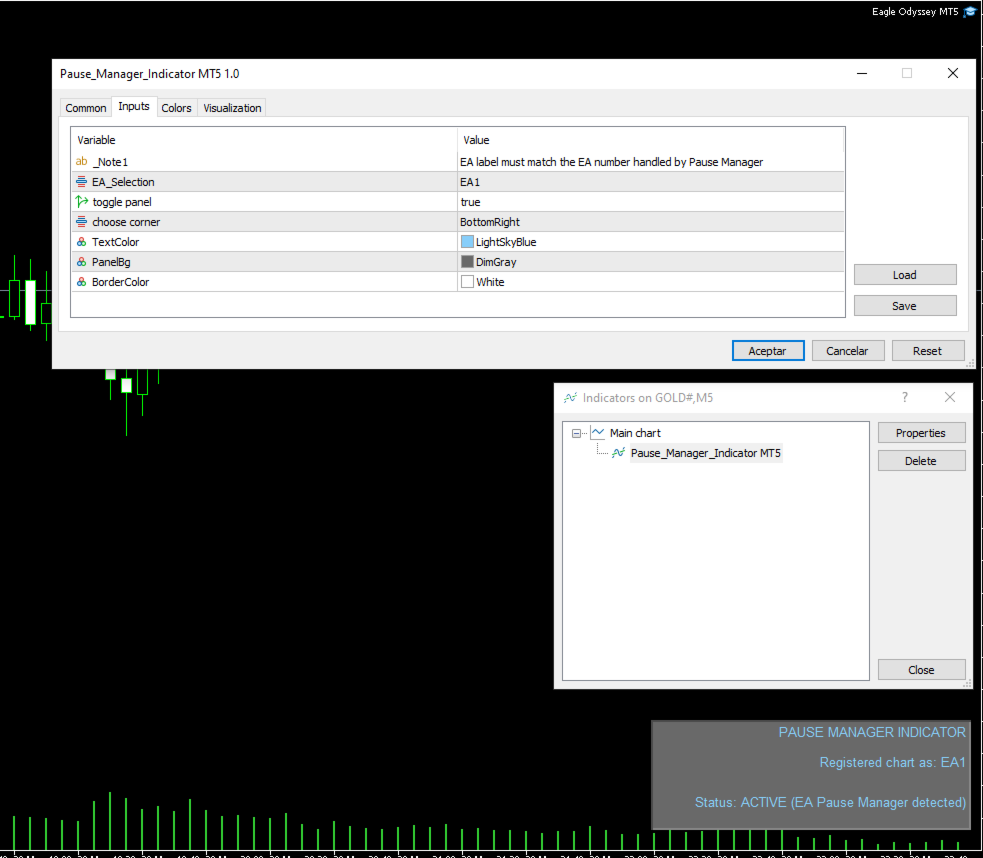
  • Shows real-time status (ACTIVE / PAUSED) of the EA on the chart
  • Displays EA ID (EA1–EA4), customizable via settings
  • Minimal resource usage
  • No input setup required
  • Simple visual panel with green/red state indicators
Installation:
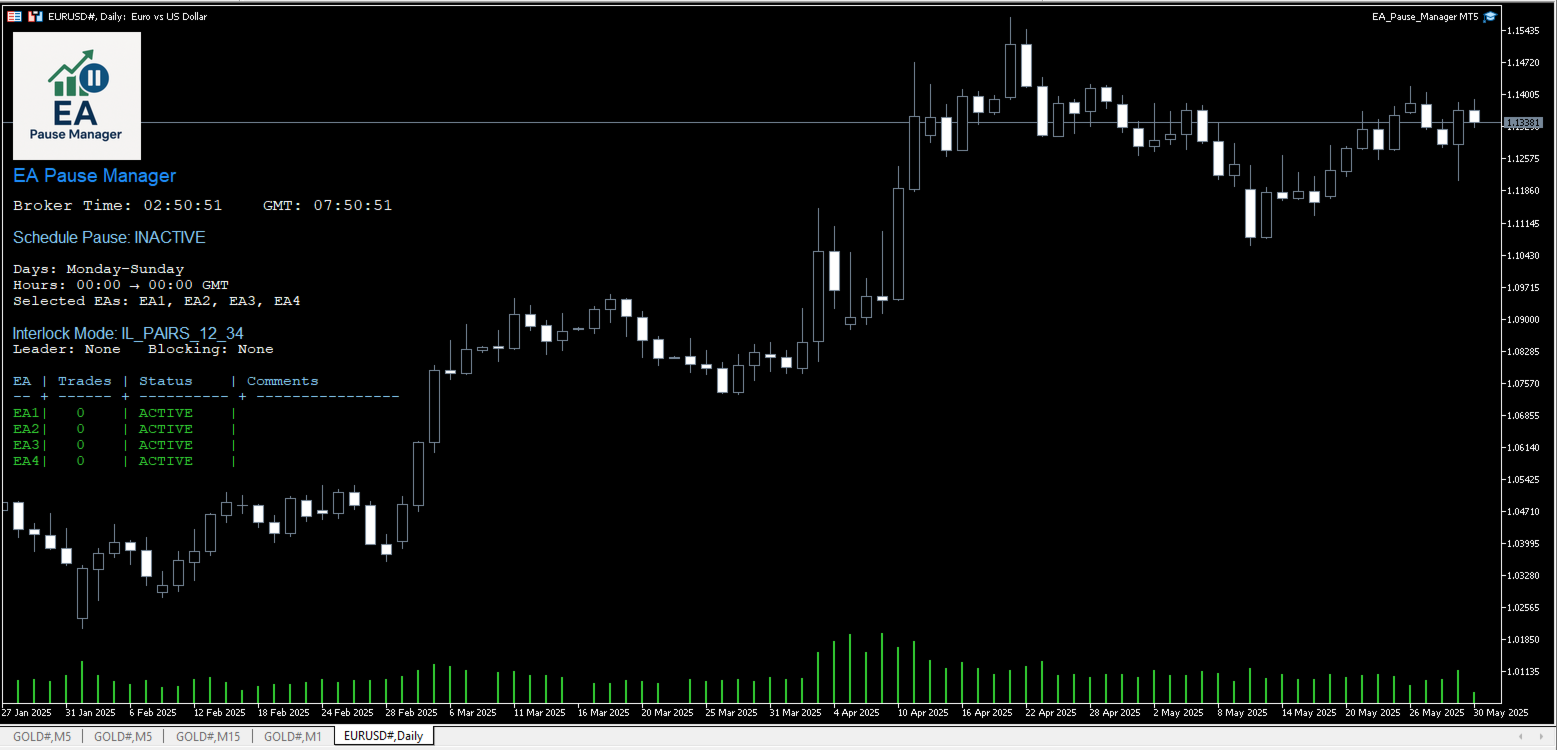
Attach the indicator to every chart that runs an EA managed by EA Pause Manager.
Once attached, it will detect the EA activity on that chart and communicate with the manager automatically.

This indicator does not perform market analysis or generate signals.
It is only used for internal status tracking and visualization in multi-EA setups.

Recommended:
Use with EA Pause Manager – a tool that automatically pauses/resumes your EAs based on Interlock criterias  or time-based rules.


Thank you for using EA Pause Manager!

おすすめのプロダクト
マルチタイムフレーム対応、カスタマイズ可能なビジュアル信号、設定可能なアラートシステムを備えた相対力指数(RSI)インジケーター。 フリーランスプログラミングサービス、アップデート、その他のTrueTL製品は私の MQL5プロフィール からご利用いただけます。 フィードバックとレビューを心よりお待ちしております! RSIとは? 相対力指数(RSI)は、価格変化の速度と大きさを測定するモメンタムオシレーターです。このインジケーターは0から100の間で振動し、指定された期間にわたって最近の上昇幅と最近の下落幅の大きさを比較します。 RSIは主に買われすぎと売られすぎの状態を識別するために使用されます。高い値は買われすぎ状態を示し、低い値は売られすぎ状態を示します。トレーダーはまた、RSIと価格動作の間のダイバージェンスにも注目しており、これは潜在的なトレンド転換を示す可能性があります。 機能: 矢印と垂直線を使用したビジュアルシグナルマーカー 設定可能なトリガー付きの3つの独立したシグナルバッファ(方向変化、レベル交差、ピーク/谷、極端ゾーン) 時間帯フィルタリング付きの設定可能なア
FREE
Swing Detector — When You Think You Know Swings, Think Again One of the key reasons many traders fail is their inattention to seemingly simple details they believe they’ve mastered. One such critical detail is the accurate identification of market swings (Swing Highs / Lows) on the chart. If you ask a group of traders to manually and consistently mark swing points on a chart, you'll find that more than half struggle to do it correctly . Not due to lack of knowledge, but because of mental fatigu
FREE
Midas VWAP
Paulo Henrique Faquineli Garcia
4 (2)
Volume Weighted Average Price (VWAP) is a trading benchmark commonly used by Big Players that gives the average price a Symbol has traded throughout the day. It is based on both Volume and price. This indicator contains Daily VWAP and MIDAS' VWAP, which means you are able to anchor the beggining of MIDAS' calculations and, therefore you will be able to use this methodology to study price versus volume moves after anchor point. You will be able to anchor up to 3 HIGH MIDAS VWAP's and 3 LOW. Wish
FREE
Simple Weis Wave
Jean Jacques Huve Ribeiro
3.67 (3)
One of the best tools for analyzing volume, Weis Wave was idelized by David Weis, to facilitate the reading of directional flow. For the VSA method disciples it is an evolution of the practices created by Richard Wycoff, facilitating a predictive reading of the market, always seeking an accumulation and distribution of the negotiated contracts. Cumulative wave volume  Range of wave ( removed) Average Wave volume Ref "Tim Ord lectures" ( removed)
FREE
Stackable VWAP
Flavio Javier Jarabeck
3.5 (4)
Volume Weighted Average Price (VWAP) is a trading benchmark commonly used by Big Players that gives the average price a Symbol has traded throughout the day. It is based on both Volume and price. Additionally we put in this indicator the MVWAP (Moving Volume Weighted Average Price). For those who do not know the usage and the importance od this indicator I recommend a great article about this subject at Investopedia ( https://www.investopedia.com/articles/trading/11/trading-with-vwap-mvwap.asp
FREE
Weis Waves
Flavio Javier Jarabeck
2.83 (18)
The original author is David Weis, an expert in the Wyckoff Method. The Weis Wave is a modern adaptation of the 1930's Wyckoff Method, another expert in Tape Reading techniques and Chart Analysis. Weis Waves takes market volume and stacks it into waves according to price conditions giving the trader valuable insights about the market conditions. If you want to learn more about this subject you can find tons of videos in YouTube. Just look for "The Wickoff Method", "Weis Wave" and "Volume Spread
FREE
MIDAS Super VWAP
Flavio Javier Jarabeck
4.27 (11)
Imagine VWAP, MVWAP and MIDAS in one place... Well, you found it! Now you can track the movement of Big Players in various ways, as they in general pursue the benchmarks related to this measuring, gauging if they had good execution or poor execution on their orders. Traders and analysts use the VWAP to eliminate the noise that occurs throughout the day, so they can measure what prices buyers and sellers are really trading. VWAP gives traders insight into how a stock trades for that day and deter
FREE
The Hammer and Doji Scanner is a powerful technical analysis tool designed for MetaTrader platforms, such as MetaTrader 4 (MT4) and MetaTrader 5 (MT5), to detect and highlight key candlestick patterns, specifically the Hammer and Doji . These patterns are widely used by traders to identify potential trend reversals or periods of indecision in the market. Hammer: The Hammer is a bullish reversal candlestick pattern that appears after a downtrend. It is characterized by a small body near the top o
FREE
White Weis Volume This indicator shows the sum of the volume in each wave, bulish or bearish, as idealized by David Weis , but it brings an important addition , which is the marking of the bar with the highest volume of the wave (White Bar)! In coding the indicator, it was sought to optimize the code to require minimal processing during use and not to overload mt5. The indicator can be used for pre-trading analysis and study, where the trader analyzes possible points of support and resistance
Rule Plotter Scanner
Francisco Gomes Da Silva
5 (1)
すべてのストラテジーをスキャンし、選択したアクティブのすべてのタイムフレームでの買いポイントと売りポイントを表示するスキャナーをお持ちになったことはありますか? それがまさにこのスキャナーが行うことです。このスキャナーは、 Rule Plotter: プログラミング不要のストラテジー作成ツール で作成した買いシグナルと売りシグナルを表示し、さまざまなアクティブとタイムフレームで実行するために設計されています。 Rule Plotterのデフォルトストラテジーは陽線と陰線だけです。つまり、Rule Plotter内に何のストラテジーも描かない場合、このスキャナーは選択したアクティブのすべてのタイムフレームでのキャンドルの色を表示します。キャンドルが陰線の場合は赤で、陽線の場合は緑です。 好きなだけストラテジーを作成 標準のストラテジーに制限されることはありません。Metatraderで利用可能なすべての指標を使用して従来のストラテジーを構築するか、お好きな指標を使用してカスタムストラテジーを構築できます。 このスキャナーはRule Plotterが提供するもののほんの一部であり、Rule
FREE
Volume Doji
Ricardo Almeida Branco
Hey guys. This indicator will show you, in the volume histogram, if the candle was a Doji, a bullish candle, or a bearish candle. The construction of this indicator was requested by a trader who uses other indicators from my catalog, and I decided to release it free to help traders who think that the indicator can contribute to their operations. The parameters are: Volume Type: Real Volume or Tick Volume. Color if the candle is bearish: select the color. Color if the candle is high: select
FREE
Wikirobo | Smart Entry Zone Indicator for All Timeframes Wikirobo is a powerful indicator that automatically highlights potential entry zones as   Buy Limit   and   Sell Limit   orders across all timeframes. Highlights Suggested entry zones for every timeframe ️ Clear, timeframe-specific   Stop Loss   levels shown on the chart for better risk management and position sizing Suitable for   scalpers, day traders, and swing traders —flexible for any trading style How to Use Instea
FREE
Non Lag Ma
Juan Manuel Rojas Perez
El indicador técnico Non Lag MA (Non-Lagged Moving Average) es una variante de la media móvil que busca reducir el retraso inherente a las medias móviles tradicionales. Pros: - Menos retraso: Al estar diseñado para reducir el retraso, el Non Lag MA puede proporcionar señales más rápidas que las medias móviles tradicionales. - Tendencias claras: Las líneas del Non Lag MA muestran claramente las tendencias alcistas y bajistas, lo que facilita la interpretación de la dirección del mercado. - Pers
FREE
This simple indicator paints with a darker color on the volume bar when the quantity traded is above the average of select number of periods of the volume itself, highlighting the moments when there was a large volume of deals above the average. It is also possible to use a configuration of four colors where the color tone shows a candle volume strength. The indicator defaults to the simple average of 20 periods, but it is possible to change to other types of averages and periods. If you like t
FREE
Velas MTF
Juan Manuel Rojas Perez
5 (3)
Velas Multi Time Frame Las velas multi time frame, también conocidas como "MTF candles" en inglés, son un indicador técnico que permite visualizar velas japonesas de un marco temporal diferente al marco temporal principal en el que estás operando. Este enfoque ofrece una perspectiva más amplia del comportamiento del precio, lo que resulta especialmente útil para los traders que emplean estrategias de acción del precio. A continuación, se detallan los conceptos clave relacionados con este indic
FREE
Swing High & Low Trendline Indicator is a professional tool that automatically identifies swing points on your chart and draws trendlines for easy visualization. No need to manually scan candles, the indicator highlights key highs and lows based on your chosen settings, helping you analyze market structure and trade with confidence. Features: Automatically detects swing highs & swing lows Draws clean trendlines directly on the chart Works on all symbols (forex, indices, crypto, stocks,
FREE
GDXM Killzones
Gustavo Barros Alexandre D Almeida
4 (1)
KillZones Pro: Smart Institutional Levels KillZones Pro is a professional-grade trading tool designed for traders who rely on institutional timing and key liquidity levels. Unlike standard session indicators that merely shade the background, KillZones Pro identifies the precise High and Low of the Asia, London, and New York sessions and projects them as "Smart Lines" that react to price action. The indicator is optimized for the ICT (Inner Circle Trader) and SMC (Smart Money Concepts) methodolog
FREE
Timer Pro
Juan Pablo Sanchez Correa
Timer PRO Candle timer with real-time gain/loss display. FUNCTIONS: - Exact countdown to candle close - Floating profit/loss display updated every second - Green for gains, red for losses - Automatic sum of all positions for the symbol - Works on all timeframes (M1 to MN) - Customizable position and colors IDEAL FOR: - Scalping and day trading - Trading with precise timing - Visual position management - Instant profit and loss monitoring INSTALLATION: Download → Drag to the chart → Done Com
FREE
Weis Wave Double Side
Eduardo Da Costa Custodio Santos
The Weis Wave Bouble Side Indicator for MT5 is part of the toolkit (Wyckoff Academy Wave Market) The Weis Wave Bouble side Indicator for MT5 was created based on the already established Weis Wave created by David Weis. The Weis Wave Double Side indicator reads the market in waves as it was done by R. Wyckoff in 1900. It helps in the identification of effort x result, cause and effect, and Supply and demand Its differential is that it can be used below the zero axis, further improving plus operat
RSI abcd
Francisco Gomes Da Silva
4.33 (3)
RSI ABCDパターンファインダー:テクニカル戦略 1. インジケーターの仕組み 古典的RSI と ABCD調和パターン の自動検出を組み合わせたものです。 主要コンポーネント 標準RSI (調整可能な期間) 高値・安値マーカー (矢印) ABCDパターン (緑/赤の線) 過買(70)・過売(30)フィルター 2. MT5設定 period = 14 ; // RSI期間 size = 4 ; // 最大パターンサイズ OverBought = 70 ; // 過買水準 OverSold = 30 ; // 過売水準 Filter = USE_FILTER_ YES ; // 確認フィルター 3. 取引戦略 3.1. 買いエントリー(強気ABCD) 条件: RSIが以下を形成: 谷( A )→ 山( B )→ より高い谷( C ) D が過売域(30)より上だが C より下 確認:A-B-C-Dを結ぶ緑色の線 目標: TP1: B-Cの61.8% TP2: B-Cの100% ストップロス: D より下 3.2. 売りエントリー(弱気ABCD) 条件: RSIが以下を形成: 山( A
FREE
We at Minions Labs love to study, challenge and discover new facts about Price Behavior in current markets. We would NOT call it Price Action because today this is a word totally overused and means, thanks to the False Prophets out there, absolutely NOTHING. The study hypothesis we propose is this: Some Assets, in certain Timeframes, present a behavior of Price continuity when the candlesticks close without a Wick on them... So the purpose of this indicator is to "color" those candlesticks who
FREE
Swing BOS Structure is a market structure indicator for MetaTrader 5. The indicator automatically detects: • Swing High (SH) • Swing Low (SL) • Break of Structure (BOS) • Change of Character (CHoCH) Swings are confirmed only after a defined number of candles, ensuring no repainting. BOS signals indicate trend continuation. CHoCH signals indicate a potential change in market structure and may appear less frequently depending on market conditions and timeframe. The indicator is lightweight, fa
FREE
Indicador Maestro del Trader Características Principales: Spread del Mercado en Tiempo Real : Visualiza el diferencial entre el precio de compra y venta directamente en tu gráfico.  Cuenta Regresiva del Cierre de Vela : No más sorpresas al final de la vela. El indicador muestra un cronómetro que te informa cuánto tiempo queda antes de que se cierre la vela actual. ¡Actúa con precisión en los momentos cruciales! Ganancias o Pérdidas en Tiempo Real : ¿Estás en verde o en rojo? El Indicador Maest
FREE
Cipher B Divergences
Alberto Gauer Borrego
4.8 (5)
Finally a Metatrader version of the very popular (and expensive) Market Cipher B indicator, or the Vumanchu Cipher B + Divergences very popular on Tradingview platform. This tool is very heavy on calculations, total are 31 plots using 97 buffers from several indicators. On my mid end computer, timeframes below M15 start getting a bit laggy, so it would require a powerful computer to run it properly at very low timeframes. It's still usable here, but somewhat sluggish response in Metatrader (lik
FREE
The Weis Waves RSJ Indicator sums up volumes in each wave. This is how we receive a bar chart of cumulative volumes of alternating waves. Namely the cumulative volume makes the Weis wave charts unique. It allows comparing the relation of the wave sequence characteristics, such as correspondence of the applied force (expressed in the volume) and received result (the price progress). If you still have questions, please contact me by direct message:  https://www.mql5.com/en/users/robsjunqueira/
FREE
Qstick is a way to objectively quantify candlestick analysis and improve the interpretation of candlestick patterns. Qstick was developed by Tushar Chande and published in his book " The New Technical Trader - Boost Your Profit by Plugging Into the Latest Indicators (1994) ". Qstick is built based on a moving average of the difference between the Open and Close prices. The basis of the idea is that the Opening and Closing prices are the heart of candlestick analysis. We strongly recommend the re
FREE
Weis Wave Double Side Alert
Eduardo Da Costa Custodio Santos
The Weis Wave Bouble Side Indicator for MT5 is part of the toolkit (Wyckoff Academy Wave Market) The Weis Wave Bouble side Indicator for MT5 was created based on the already established Weis Wave created by David Weis. The Weis Wave Double Side indicator reads the market in waves as R. Wyckoff did in 1900. It helps in the identification of effort x result, cause and effect, and Supply and demand Its differential is that it can be used below the zero axis and has a breakout alert showing Who is s
VWAP and MVWAP
Flavio Javier Jarabeck
3.88 (8)
Volume Weighted Average Price (VWAP) is a trading benchmark commonly used by Big Players that gives the average price a Symbol has traded throughout the day. It is based on both Volume and price. Additionally we put in this indicator the MVWAP (Moving Volume Weighted Average Price). For those who do not know the usage and the importance od this indicator I recommend a great article about this subject at Investopedia ( https://www.investopedia.com/articles/trading/11/trading-with-vwap-mvwap.asp )
FREE
Best SAR MT5
Ashkan Hazegh Nikrou
4.33 (3)
説明 :  外国為替市場(PSAR)で専門的で人気のあるインジケーターの1つに基づいた新しい無料インジケーターをご紹介します。このインジケーターは元のパラボリックSARインジケーターの新しい変更です。プロSARインジケーターでは、ドットと価格チャートのクロスオーバーを見ることができます。クロスオーバーはシグナルではありませんが、動きの終わりの可能性について話します。新しい青いドットで購入を開始し、最初の青いドットの1 atr前にストップロスを配置し、最後にドットが価格チャートを横切るとすぐに終了できます。 売買シグナルを開く方法は? 最初の青い点によるオープンバイトレードと最初の赤いドットによるオープンセルトレード 正しいストップロスはどこにありますか? 安全なストップロスは最初のドットにある可能性があります(最初の青いドットの買いの場合と最初の赤い点の売りの場合) 正しいテイクプロフィットはどこにありますか? テイクプロフィットはストップロス距離とRRに基づいて調整できるので、私の提案は2 RRで、ストップロスの2倍です。 利益を上げているのにtpを達成できなかった場合
FREE
PROMETHEUS TECHNICAN VERSION Free | By THE SONS A gift from The Sons — no strings, no trial, no expiry. Every trader deserves access to professional-grade market intelligence. That belief is why Prometheus Technical Version exists, and why it costs nothing. Consider it our handshake to the trading community. What You're Getting This is not a simplified tool dressed up as a gift. Prometheus Technican Version is a fully built, institutional-quality technical analysis indicator running a dual-model
FREE
このプロダクトを購入した人は以下も購入しています
SuperScalp Pro
Van Minh Nguyen
4.53 (19)
SuperScalp Pro — 高度なマルチフィルター対応スキャルピングインジケーターシステム SuperScalp Pro は、クラシックな Supertrend と複数のインテリジェントな確認フィルターを組み合わせた高度なスキャルピング用インジケーターシステムです。M1〜H4 のすべての時間足で効率的に機能し、特に XAUUSD、BTCUSD、および主要なFX通貨ペアに適しています。単体のシステムとして、また既存の取引戦略へ柔軟に統合して使用できます。 本インジケーターは 11 以上のフィルターを統合しており、短期・長期の EMA、トレンド判定に用いる 3 本の EMA、EMA スロープ(EMA slope)、RSI、ADX、出来高、VWAP、ボリンジャーバンドのブレイクアウト、MACD ダイバージェンスフィルターなどを含みます。スマートキャンドルフィルターはローソク足の終値を確認して弱いシグナルを排除し、3 本の EMA と MACD ダイバージェンスを組み合わせたトレンド認識メカニズムにより勝率の高いシグナルの選別を支援します。 SuperScalp Pro は ATR に基
Entry In The Zone and SMC Multi Timeframe is a real-time 2-in-1 market analysis tool that combines market structure analysis and a No Repaint BUY / SELL signal system into a single indicator, built on Smart Money Concepts (SMC) — a widely adopted framework used by professional traders to understand market structure. This indicator helps you see the market more clearly, make decisions based on structure rather than guesswork, and focus on high-probability zones where price is more likely to react
Azimuth Pro
Ottaviano De Cicco
5 (6)
Azimuth Pro V2:MT5向けシンセティック・フラクタル構造分析と確認済みエントリー 概要 Azimuth Pro は Merkava Labs によるマルチレベルスイング構造インジケーターです。4つのネストされたスイングレイヤー、スイングアンカーVWAP、ABCパターン検出、3タイムフレーム構造フィルタリング、そして確定バーでの確認済みエントリー — 1つのチャートで、ミクロスイングからマクロサイクルまでを網羅するワークフロー。 これはブラインドシグナル製品ではありません。ロケーション、コンテキスト、タイミングを重視するトレーダーのための構造ファーストワークフローです。 V2発売記念オファー — Azimuth Pro V2をUSD 399で(次の100本)。最終価格:USD 499。 1. V2での変更点 シンセティック・マルチタイムフレームエンジン 上位タイムフレーム分析をMeridian Proと同じ独自のシンセティックアーキテクチャで一から再構築。よりクリーンなHTFコンテキスト、安定したライブ動作、従来のMTF同期問題なし。シンセティックエンジンは 固定比率タ
Power Candles – あらゆる市場に対応した強度ベースのエントリーシグナル Power Candles は、Stein Investments が長年培ってきた強度分析を価格チャート上に直接反映します。価格だけに反応するのではなく、各ローソク足は実際の市場の強さに基づいて色分けされ、モメンタムの蓄積、強度の加速、明確なトレンド転換を瞬時に把握できます。 すべての市場に共通する単一ロジック Power Candles は すべての取引シンボル で自動的に動作します。現在のシンボルが Forex か非 Forex 市場かを自動判別し、内部で適切な強度モデルを適用します。 Forex および Gold :FX Power のデルタ値を使用(絶対値レンジ最大 100) 指数、暗号資産、CFD :IX Power の強度値を使用(絶対値レンジ最大 50) 必要な強度計算は Power Candles に直接組み込まれています。ローソク足のカラーリングやシグナルロジックに、追加のインジケーターは不要です。 価格ノイズではなく「強度状態」 各ローソク足は、以下の 9 つの明確に定義された強
このインジケーターを購入された方には、以下の特典を 無料 で提供しています: 各トレードを自動で管理し、ストップロスとテイクプロフィットを設定し、戦略ルールに基づいてポジションを決済する補助ツール 「Bomber Utility」 様々な銘柄に合わせたインジケーターの設定ファイル(セットファイル) 「最小リスク」、「バランスリスク」、「待機戦略」 の3つのモードで使用できる Bomber Utility 用の設定ファイル このトレーディング戦略をすぐに導入・設定・開始できる ステップバイステップのビデオマニュアル ご注意: 上記の特典を受け取るには、MQL5のプライベートメッセージシステムを通じて販売者にご連絡ください。 オリジナルのカスタムインジケーター 「Divergence Bomber(ダイバージェンス・ボンバー)」 をご紹介します。これは、MACDのダイバージェンス(乖離)戦略に基づいた 「オールインワン」型のトレーディングシステム です。 このテクニカルインジケーターの主な目的は、価格とMACDインジケーターの間に発生するダイバージェンスを検出 し、将来の価格の動きを示す
Gold Entry Sniper – ゴールドスキャルピング&スイングトレード用プロフェッショナル多時間足ATRダッシュボード Gold Entry Sniper は、XAUUSDや他の銘柄向けに正確な 売買シグナル を提供する、MetaTrader 5用の高度なインジケーターです。 ATRトレーリングストップロジック と 多時間足分析ダッシュボード を搭載し、スキャルピングからスイングトレードまで対応します。 主な特徴と利点 多時間足シグナル分析 – M1、M5、M15 のトレンドを同時表示。 ATRベースのトレーリングストップ – ボラティリティに応じて動的に調整。 プロ仕様のチャートダッシュボード – シグナル状況、ATRレベル、回帰線、売買方向を表示。 明確な売買マーカー – 自動矢印とテキストラベル。 エグジットアラートとトレード管理 – 利益確定のための自動検出。 完全カスタマイズ可能 – パネル位置、色、フォント、ATR/回帰設定を調整可能。 ゴールド(XAUUSD)に最適化 – M1〜M15のスキャルピングに最適、FXや指数、暗号資産にも対応。 Gold Entry
OmniSync Projection
Antonio-alin Teculescu
5 (1)
Chronos Fractal Engine is an innovative price projection indicator for MetaTrader 5, designed to transform your technical analysis by intelligently identifying and projecting historical price patterns. Built upon an advanced correlation algorithm and the fractal principles of the market, this powerful tool visualizes potential future price movements, giving you a unique edge in your trading decisions. What is Chronos Fractal Engine? At its core, the Chronos Fractal Engine employs a sophisticat
このインジケーターを購入すると、プロ仕様のトレードマネージャーを無料で差し上げます。 まず第一に、このトレーディングシステムがノンリペイント、ノンリドロー、ノンラグのインジケーターであることを強調する価値がある。これにより、手動取引とロボット取引の両方に理想的なものになっています。 オンラインコース、マニュアル、プリセットのダウンロード。 「スマートトレンドトレーディングシステム MT5」は、新規および経験豊富なトレーダー向けにカスタマイズされた包括的なトレーディングソリューションです。10以上のプレミアムインジケーターを組み合わせ、7つ以上の堅実なトレーディング戦略を備えており、多様な市場状況に対応する多目的な選択肢となっています。 トレンドフォロー戦略:トレンドを効果的に乗り越えるための正確なエントリーとストップロス管理を提供します。 リバーサル戦略:潜在的なトレンドの反転を特定し、トレーダーがレンジ相場を活用できるようにします。 スキャルピング戦略:高速で正確なデイトレードおよび短期取引のために設計されています。 安定性:すべてのインジケーターはノンリペイント、ノンリドロー、ノ
トレンド スクリーナー インジケーターでトレンド取引の力を解き放ちます。ファジー ロジックと複数通貨システムを活用した究極のトレンド取引ソリューションです。 ファジー ロジックを活用した革新的なトレンド インジケーターである Trend Screener を使用して、トレンド取引を向上させます。 これは、13 を超えるプレミアム ツールと機能、および 3 つの取引戦略を組み合わせた強力なトレンド追跡インジケーターであり、Metatrader をトレンド アナライザーにする多用途の選択肢となります。 期間限定オファー : トレンド スクリーナー インジケーターは、わずか 100 ドルで生涯ご利用いただけます。 (元の価格 50$ ) (オファー延長) Trend Screener の 100% 非再描画精度の揺るぎない精度を体験して、取引の決定が過去の価格変動の影響を受けないようにしてください。 マルチタイムフレームおよびマルチ通貨機能の多用途性を解放し、比類のない自信を持って外国為替、商品、暗号通貨、インデックスの世界を取引できるようにします。 Trend Screener の包括的な
Meridian Pro
Ottaviano De Cicco
5 (1)
Meridian Pro:MT5用プロフェッショナル・マルチタイムフレーム・トレンドマトリックス 概要 Meridian Pro は Merkava Labs が開発したマルチタイムフレーム・トレンドマトリックスで、方向性の状態、強度、モメンタムの状況、マトリックスの合意をひとつのコンパクトなパネルに集約します。ひとつのアダプティブエンジンがM1からW1まで一貫して適用されます。シンボルごとの調整は不要。インジケーターの積み重ねも不要。すべてのアセットとすべてのタイムフレームをカバーするひとつの構造化された読み取りです。 発売キャンペーン — Meridian Proを USD 99 (導入価格)で入手。通常価格:USD 149 。 1. Meridian Proが他と異なる理由 ひとつのエンジン、バラバラなインジケーターのダッシュボードではない 多くのMTFダッシュボードは、タイムフレームごとに生のインジケーター値を繰り返すだけです。Meridian Proはマトリックス全体でひとつのアダプティブ・トレンドエンジンを使用するため、パネルの各行が同じ構造化フレームワークから導出されます
Quantum TrendPulse を ご紹介します。これは、   SuperTrend   、   RSI   、および Stochastic のパワーを 1 つの包括的なインジケーターに組み合わせて、取引の可能性を最大限に引き出す究極の取引ツールです。精度と効率を求めるトレーダー向けに設計されたこのインジケーターは、市場のトレンド、勢いの変化、最適なエントリー ポイントとエグジット ポイントを自信を持って特定するのに役立ちます。 主な特徴: SuperTrend 統合: 現在の市場動向に簡単に追従し、収益性の波に乗ることができます。 RSI精度: 買われすぎと売られすぎのレベルを検出し、市場の反転のタイミングに最適で、SuperTrendのフィルターとして使用されます。 確率的精度: 確率的振動を活用して、変動の激しい市場で隠れたチャンスを見つけます。SuperTrend のフィルターとして使用されます。 マルチタイムフレーム分析:   M5 から H1 または H4 まで、さまざまなタイムフレームで市場を常に把握します。 カスタマイズ可能なアラート: カスタム取引条件が満たされ
FX Trend NG:次世代マルチマーケット・トレンドインテリジェンス 概要 FX Trend NG は、複数の時間足に対応したプロフェッショナル向けトレンド分析およびマーケット監視ツールです。 市場全体の構造を数秒で把握することができます。 複数のチャートを切り替える必要はありません。どの銘柄がトレンド中なのか、どこでモメンタムが弱まっているのか、そしてどの時間足で強い整合性があるのかを瞬時に確認できます。 ローンチ特別オファー – FX Trend NG を $30(6ヶ月) または $80 永久ライセンス でご利用いただけます。 すでに Stein Investments のユーザーですか? -> メッセージを送信 して、プライベートグループへアクセスしてください。 セットアップや詳細情報が必要ですか? -> Stein Investments 公式ページ をご覧ください。 1. FX Trend NG が他と異なる理由 3ステート・トレンドロジック ― Buy と Sell だけではない • 多くのインジケーターは Buy または Sell の2状態のみを表示します。
BTMM State Engine Pro is a MetaTrader 5 indicator for traders who use the Beat The Market Maker approach: Asian session context, kill zone timing, level progression, peak formation detection, and a multi-pair scanner from a single chart. It combines cycle state logic with a built-in scanner dashboard so you do not need the same tool on many charts at once. What it does Draws the Asian session range; session times can follow broker server offset or be set in inputs. Tracks level progression (L
Gann Made Easy   は、ミスター・ギャンの理論を使用した取引の最良の原則に基づいた、プロフェッショナルで使いやすい外国為替取引システムです。 W・D・ガン。このインジケーターは、ストップロスとテイクプロフィットレベルを含む正確な買いと売りのシグナルを提供します。 PUSH通知を利用して外出先でも取引可能です。 ご購入後、取引方法の説明と優れた追加インジケーターを無料で入手するには、私にご連絡ください! おそらく、ギャンの取引手法についてはすでに何度も聞いたことがあるでしょう。通常、ギャンの理論は初心者のトレーダーだけでなく、すでにある程度の取引経験がある人にとっても非常に複雑なものです。なぜなら、ギャンの取引手法は理論的にはそれほど簡単に適用できるものではないからです。私はその知識を磨き、最良の原則を私の外国為替インジケーターに組み込むために数年を費やしました。 このインジケーターは非常に簡単に適用できます。必要なのは、それをチャートに添付し、簡単な取引推奨事項に従うだけです。このインジケーターは常に市場分析の仕事を行い、取引の機会を探します。適切なエントリーポイントを検
ARICoin is a powerful trading companion designed to generate high-probability entry signals with dynamic TP/SL/DP levels based on volatility. Built-in performance tracking shows win/loss stats, PP1/PP2 hits, and success rates all updated live. Key Features: Buy/Sell signals with adaptive volatility bands Real-time TP/SL/DP levels based on ATR Built-in MA Filter with optional ATR/StdDev volatility Performance stats panel (Success, Profit/Loss, PP1/PP2) Alerts via popup, sound, push, or email Cust
Trend Ai indicatorは、トレンドの識別と実用的なエントリポイントと反転アラートを組み合わせることで、トレーダーの市場分析を強化する優れたツールです。 この指標は、ユーザーが自信と正確さで外国為替市場の複雑さをナビゲートすることを可能にします トレンドAiインジケーターは、主要なシグナル以外にも、プルバックやリトレースメント中に発生するセカンダリエントリポイントを識別し、トレーダーが確立されたトレンド内の価格修正を活用できるようにします。 重要な利点: *MT4およびMT5の仕事 *明確な買いまたは売りシグナル *再描画しません ·すべての資産で動作します 私はeaやセットをtelegram it詐欺で販売しないように注意してください。 すべての設定はここでブログで無料です。  重要! 指示とボーナスを得るために購入後すぐに私に連絡してください! 私の他のプロダクトと同様、実質操作の監視はここに見つけることができます: https://www.mql5.com/en/users/mechanic/seller&nbsp ; 設定および入力: すべての
あなたのシンボルでどの戦略が実際に機能するか確認しましょう - リアルマネーをリスクにさらす前に。 Power Barは、あらゆるシンボルとあらゆるタイムフレームで 極端な価格バー を検出し、3つの異なるトレード戦略を即座にバックテストします。勝率、プロフィットファクター、損益を並べて比較できます。すべてが1つのインタラクティブなパネルに集約されています。 推測なし。カーブフィッティングなし。データだけです。 Power Barが特別な理由 ほとんどのインジケーターはシグナルを出すだけで、それが機能するかどうかは推測に任されます。Power Barはさらに先を行きます - すべてのシグナルを 3つの戦略 に対してテストし、統計を表示します。FlipFlop、Momentum、Reversalをワンクリックで切り替え、数値が即座に変化するのを確認できます。 FlipFlop - 常にポジションを保有。シグナルでエントリーし、反対シグナルでイグジット。当社のリサーチでは、US30、US500、DAXなどのトレンドのあるインデックスで最も効果的です。 Momentum - シグナルの方向に
まず第一に、この取引ツールはノンリペイント、ノンリドロー、ノンラグの指標であり、プロの取引に理想的ですことを強調する価値があります。 オンラインコース、ユーザーマニュアル、デモ。 スマートプライスアクションコンセプトインジケーターは、新米から経験豊富なトレーダーまで、非常 に強力なツールです。Inner Circle Trader AnalysisやSmart Money Concepts Trading Strategiesなど、20以上の有用な指標を1つに組み合わせています。このインジケーターはスマートマネーコンセプトに焦点を当て、大手機関の取引方法を提供し、彼らの動きを予測するのに役立ちます。 特に、流動性分析に優れており、機関がどのように取引しているかを理解しやすくしています。市場のトレンドを予測し、価格の動きを慎重に分析するのに優れています。機関の戦略とトレードを合わせることで、市場の動向についてより正確な予測ができます。このインジケーターは多目的であり、市場構造を分析し、重要な注文ブロックを特定し、さまざまなパターンを認識するのに優れています。 このインジケーター
Crystal Heikin Ashi Signals - Professional Trend & Signal Detection Indicator Advanced Heikin Ashi Visualization with Intelligent Signal System for Manual & Automated Trading Final Price: $149 ---------> Price goes up $10 after every 10 sales . Limited slots available — act fast . Overview Crystal Heikin Ashi Signals is a professional-grade MetaTrader 5 indicator that combines pure Heikin Ashi candle visualization with an advanced momentum-shift detection system. Designed for both manual traders
FX Power: 通貨の強弱を分析して、より賢い取引を実現 概要 FX Power は主要通貨と金の実際の強弱をあらゆる市場状況で理解するための必須ツールです。強い通貨を買い、弱い通貨を売ることで、 FX Power は取引の意思決定を簡素化し、高い確率の取引機会を見出します。トレンドを追従する場合でも、極端なデルタ値を使用して反転を予測する場合でも、このツールはあなたの取引スタイルに完全に適応します。ただ取引するだけではなく、 FX Power で賢く取引をしましょう。 1. なぜ FX Power がトレーダーにとって非常に有益なのか 通貨と金のリアルタイム強弱分析 • FX Power は主要通貨と金の相対的な強弱を計算し、マーケットダイナミクスに関する明確な洞察を提供します。 • どの資産がリードしているか、または後れを取っているかを監視して、取引するペアを賢く選びましょう。 マルチタイムフレームの包括的なビュー • 短期、中期、長期のタイムフレームで通貨と金の強弱を追跡し、マーケットトレンドに基づいて取引戦略を調整できます。 • スキャルピングからスイングトレード
Auto Optimized Parabolic RSI: 高度な3Dモメンタムエンジン ほとんどのリテール向けインジケーターは、市場のボラティリティが変化した瞬間に破綻する静的な入力値に依存しているため、失敗に終わります。Auto Optimized Parabolic RSIは、自らの数学的優位性を継続的に再計算することで「インジケーターの陳腐化」問題を解決し、機関投資家レベルの定量的適応力をMT5ターミナルに直接もたらします。 最大の強み: カスタムインメモリ3D最適化 標準的な自動最適化ツールは、インジケーターの呼び出しで端末に過負荷をかけるため、頻繁にMT5プラットフォームをフリーズさせます。本ツールは、このボトルネックを完全に回避しています。RAMベースのカスタムネイティブ計算機を内蔵した内部エンジンは、チャートを読み込んだりタイムフレームを変更したりするたびに、超高速の3Dグリッド探索を実行します。RSI期間(頻度)、SARステップ(加速度)、SAR最大値(制限速度)を同時にスイープし、プラットフォームを遅延させることなく、数万通りものパラメーターの組み合わせを絶対的なミ
まず第一に、この取引インジケーターは再描画されず、再描画されず、遅延しないことを強調する価値があります。これにより、手動取引とロボット取引の両方に理想的なものになります。 ユーザーマニュアル:設定、入力、戦略。 アトミックアナリストは、価格の強さとモメンタムを利用して市場でより良いエッジを見つけるためのPA価格アクションインジケーターです。ノイズや誤ったシグナルを除去し、取引ポテンシャルを高めるための高度なフィルターを備えています。複雑なインジケーターの複数のレイヤーを使用して、アトミックアナリストはチャートをスキャンし、複雑な数学的計算をシンプルなシグナルと色に変換します。これにより、どのような初心者トレーダーでも理解して使用し、一貫した取引の決定を行うことができます。 「アトミックアナリスト」は、新規および経験豊富なトレーダー向けにカスタマイズされた包括的な取引ソリューションです。プレミアムインジケーターとトップノッチの機能を1つの取引戦略に組み合わせ、すべてのタイプのトレーダーにとって汎用性のある選択肢にします。 デイリートレーディングとスキャルピング戦略:高速で正確なデイ
Bill Williams Advanced is designed for automatic chart analysis using Bill Williams' "Profitunity" system. The indicator analyzes four timeframes at once. Manual (Be sure to read before purchasing) Advantages 1. Analyzes the chart using Bill Williams' "Profitunity" system. Signals are displayed in a table in the corner of the screen and on the price chart. 2. Finds all known AO and AC signals, as well as zone signals. Equipped with a trend filter based on the Alligator. 3. Finds "Divergence Bar
Smart Stop Indicator – チャート上で実現するインテリジェントなストップロス精度 概要 Smart Stop Indicator は、ストップロスを勘や感情ではなく、明確で体系的に設定したいトレーダーのために設計されています。本ツールは、クラシックなプライスアクション(高値更新・安値切り下げ)と最新のブレイクアウト認識ロジックを組み合わせ、次に来るべき論理的なストップレベルを正確に特定します。トレンド相場、レンジ、急速なブレイクアウト局面のいずれであっても、最適な SL ゾーンとその状態(“new”、“broken”、“valid”)をチャート上に直接表示します。さらに今回、SL 距離の %ADR 表示も新たに追加されています。 主な特徴 マーケット構造に基づく自動ストップ配置 • 市場構造とリアルタイムの値動きに基づき、意味のあるストップロスレベルを自動検出します。 スマートなブレイクアウト感知 • 急激な方向転換やブレイクアウトにも柔軟に対応し、早すぎるストップ調整を避けます。 SL %ADR の表示 • ストップロスまでの距離を ADR(Averag
Introducing Indicator for PainX and GainX Indices Traders on Weltrade Get ready to experience the power of trading with our indicator, specifically designed for Weltrade   broker's PainX and GainX Indices.  Advanced Strategies for Unbeatable Insights Our indicator employs sophisticated strategies to analyze market trends, pinpointing optimal entry and exit points.  Optimized for Maximum Performance To ensure optimal results, our indicator is carefully calibrated for 5-minute timeframe charts on
RelicusRoad Pro: 定量的市場オペレーティングシステム 【期間限定】無制限アクセス 70% OFF - 2,000人超のトレーダーと共に なぜ多くのトレーダーは「完璧な」インジケーターを使っても失敗するのでしょうか? それは、文脈を無視して 単一の概念 だけでトレードしているからです。文脈のないシグナルは単なるギャンブルです。勝ち続けるには、 根拠の重なり(コンフルエンス) が必要です。 RelicusRoad Proは単なる矢印インジケーターではありません。完全な 定量的市場エコシステム です。独自のボラティリティモデリングを用いて、価格が推移する「適正価値の道(Fair Value Road)」をマッピングし、ノイズと真の構造的ブレイクを判別します。 推測はやめましょう。機関投資家レベルの「ロード・ロジック」でトレードを。 コアエンジン:「Road」アルゴリズム システムの中心となる Road Algo は、市場環境にリアルタイムで適応するダイナミックなボラティリティチャネルです。 安全ライン(平衡点) と、価格が数学的に反転しやすい 拡張レベル を投影します。 Si
Berma Bands
Muhammad Elbermawi
5 (8)
Berma Bands (BBs) インジケーターは、市場のトレンドを特定して活用したいトレーダーにとって貴重なツールです。価格と BBs の関係を分析することで、トレーダーは市場がトレンド段階にあるか、レンジ段階にあるかを判断できます。 詳細については、[ Berma Home Blog ] をご覧ください。 バーマ バンドは、上部バーマ バンド、中部バーマ バンド、下部バーマ バンドの 3 つの異なる線で構成されています。これらの線は価格の周りにプロットされ、全体的な傾向に対する価格の動きを視覚的に表します。これらのバンド間の距離から、ボラティリティや潜在的な傾向の反転についての洞察を得ることができます。 バーマ バンドの線がそれぞれ離れると、市場が横ばいまたはレンジ相場の期間に入っていることを示すことがよくあります。これは、明確な方向性の偏りがないことを示しています。トレーダーは、これらの期間中にトレンドを特定するのが難しいと感じる可能性があり、より明確なトレンドが出現するまで待つ場合があります。 バーマ バンドの線が 1 本の線に収束すると、強いトレンド環境の兆候となること
ARIPoint is a powerful trading companion designed to generate high-probability entry signals with dynamic TP/SL/DP levels based on volatility. Built-in performance tracking shows win/loss stats, PP1/PP2 hits, and success rates all updated live. Key Features: Buy/Sell signals with adaptive volatility bands Real-time TP/SL/DP levels based on ATR Built-in MA Filter with optional ATR/StdDev volatility Performance stats panel (Success, Profit/Loss, PP1/PP2) Alerts via popup, sound, push, or email Cu
現在33%オフ 初心者にもエキスパートトレーダーにも最適なソリューション このインジケーターは独自の機能と新しい公式を多数内蔵しており、ユニークで高品質かつ手頃な取引ツールです。このアップデートでは、2つの時間枠ゾーンを表示できるようになります。より長いTFだけでなく、チャートTFとより長いTF(ネストゾーンを表示)の両方を表示できます。すべてのSupply Demandトレーダーの皆さんのお気に召すはずです。:) 重要情報の公開 Advanced Supply Demandの可能性を最大化するには、 https://www.mql5.com/ja/blogs/post/720245 にアクセスしてください。   エントリーまたはターゲットの正確なトリガーポイントを正確に特定できれば取引がどのように改善されるか想像してみてください。新しい基盤となるアルゴリズムに基づいて構築されているため、買い手と売り手の間の潜在的な不均衡をさらに簡単に特定できます。これは、最も強い需要と供給のゾーンと、過去のパフォーマンス(古いゾーンを表示)がグラフィカルに表現されるためです。これらの機能は、最適な
トレンドトレーディング は、タイミングのプルバックとブレイクアウトにより、市場で起こっているトレンドから可能な限り利益を得るように設計された指標です。確立されたトレンドの中で価格が何をしているかを分析することにより、取引の機会を見つけます。 [ インストールガイド | 更新ガイド | トラブルシューティング | よくある質問 | すべての製品 ] 自信を持って効率的に金融市場を取引する むち打ちにならずに確立されたトレンドから利益を得る 収益性の高いプルバック、ブレイクアウト、早期の逆転を認識する この指標は、独自の品質とパフォーマンスを分析します 複数時間枠のダッシュボードを実装します インジケーターは再描画されていません 電子メール/音声/視覚アラートを実装します 確立されたトレンドは多くの取引機会を提供しますが、ほとんどのトレンド指標はそれらを完全に無視しています。インジケーターの解釈はかなり簡単です: (1) トレンドの変化 (2) トレンドの方向への後退 (3) トレンドの方向へのブレイクアウト 赤いダッシュ は下降トレンド中の修正です 青いダッシュ は上昇トレンド中
作者のその他のプロダクト
EA Pause Manager
David Enrique Barrera Moncayo
3.83 (6)
EA Pause Manager — Your Smart Risk Guard & Scheduler (MT5) What It Does - Stops conflicting trades before they happen (based on active market positions).   - Pauses or resumes your EAs automatically based on:     - A simple “leader” rule: the first EA to trade becomes the leader and blocks the rest.     - A time schedule you set (e.g. no trading in Asian session). - Note : Interlock logic is triggered by executed market orders, not by pending orders (Buy Stop / Sell Stop). Why It Matters - Prot
フィルタ:
レビューなし
レビューに返信