FVG MuskX MTF MT5
- インディケータ
- バージョン: 1.20
- アップデート済み: 18 5月 2025
- アクティベーション: 10
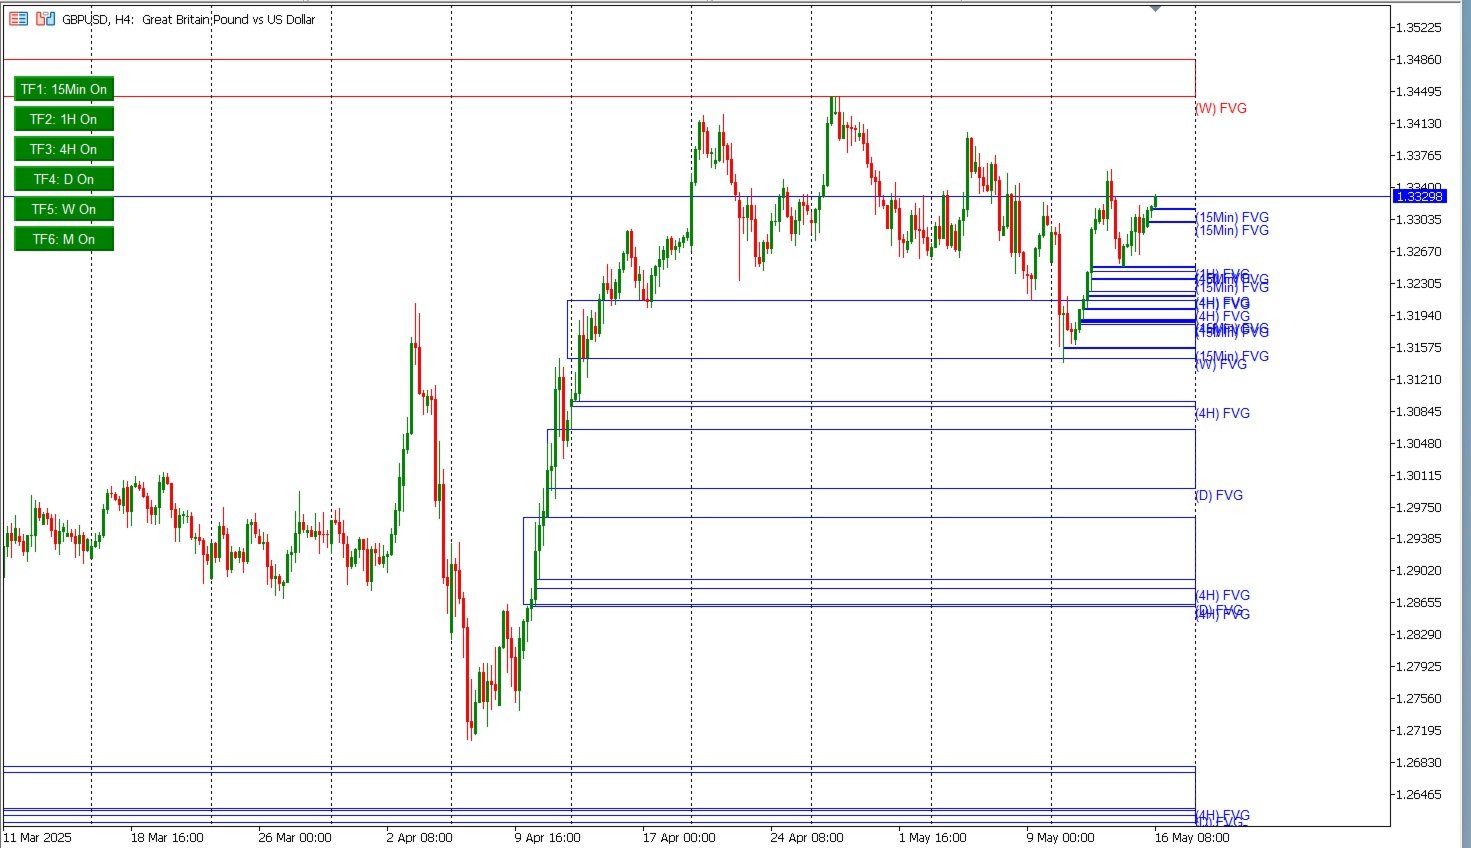
Unlock precision trading with the FVG MUSKX MTF —a next-generation tool engineered to transform your market analysis on MetaTrader 5. Designed with accuracy and usability in mind, this powerful indicator identifies Fair Value Gaps (FVGs) across multiple timeframes, giving traders a clear advantage in spotting institutional footprints and potential price imbalances.
🔍 Key Features
-
🎯 Sharp FVG Detection
Detect Fair Value Gaps with high precision across selected timeframes. Never miss a critical market imbalance again. -
⏱️ Multi-Timeframe Visualization
Instantly visualize FVGs from M15, H1, H4, D1, W1, and MN1—all displayed directly on your active chart. Get a layered market perspective without switching timeframes. -
🎛️ Interactive Toggle Controls
Clean up your workspace and focus on what matters. Intuitive ON/OFF buttons allow you to show or hide FVGs for each timeframe with a single click.
💡 Why Choose FVG MUSKX MTF?
Whether you're a scalper, swing trader, or long-term investor, the FVG MUSKX MTF Indicator adapts to your strategy. Its clean design, customizable controls, and advanced detection logic make it an essential tool for traders looking to harness the power of market structure.
✅ Boost Your Edge. Stay Ahead.
With the FVG MUSKX MTF Indicator, you're not just observing the market—you’re understanding it. Equip yourself with clearer signals, smarter visual cues, and time-saving functionality that lets you trade with confidence.