OldTimeFrame
- インディケータ
- バージョン: 1.1
- アップデート済み: 23 4月 2025
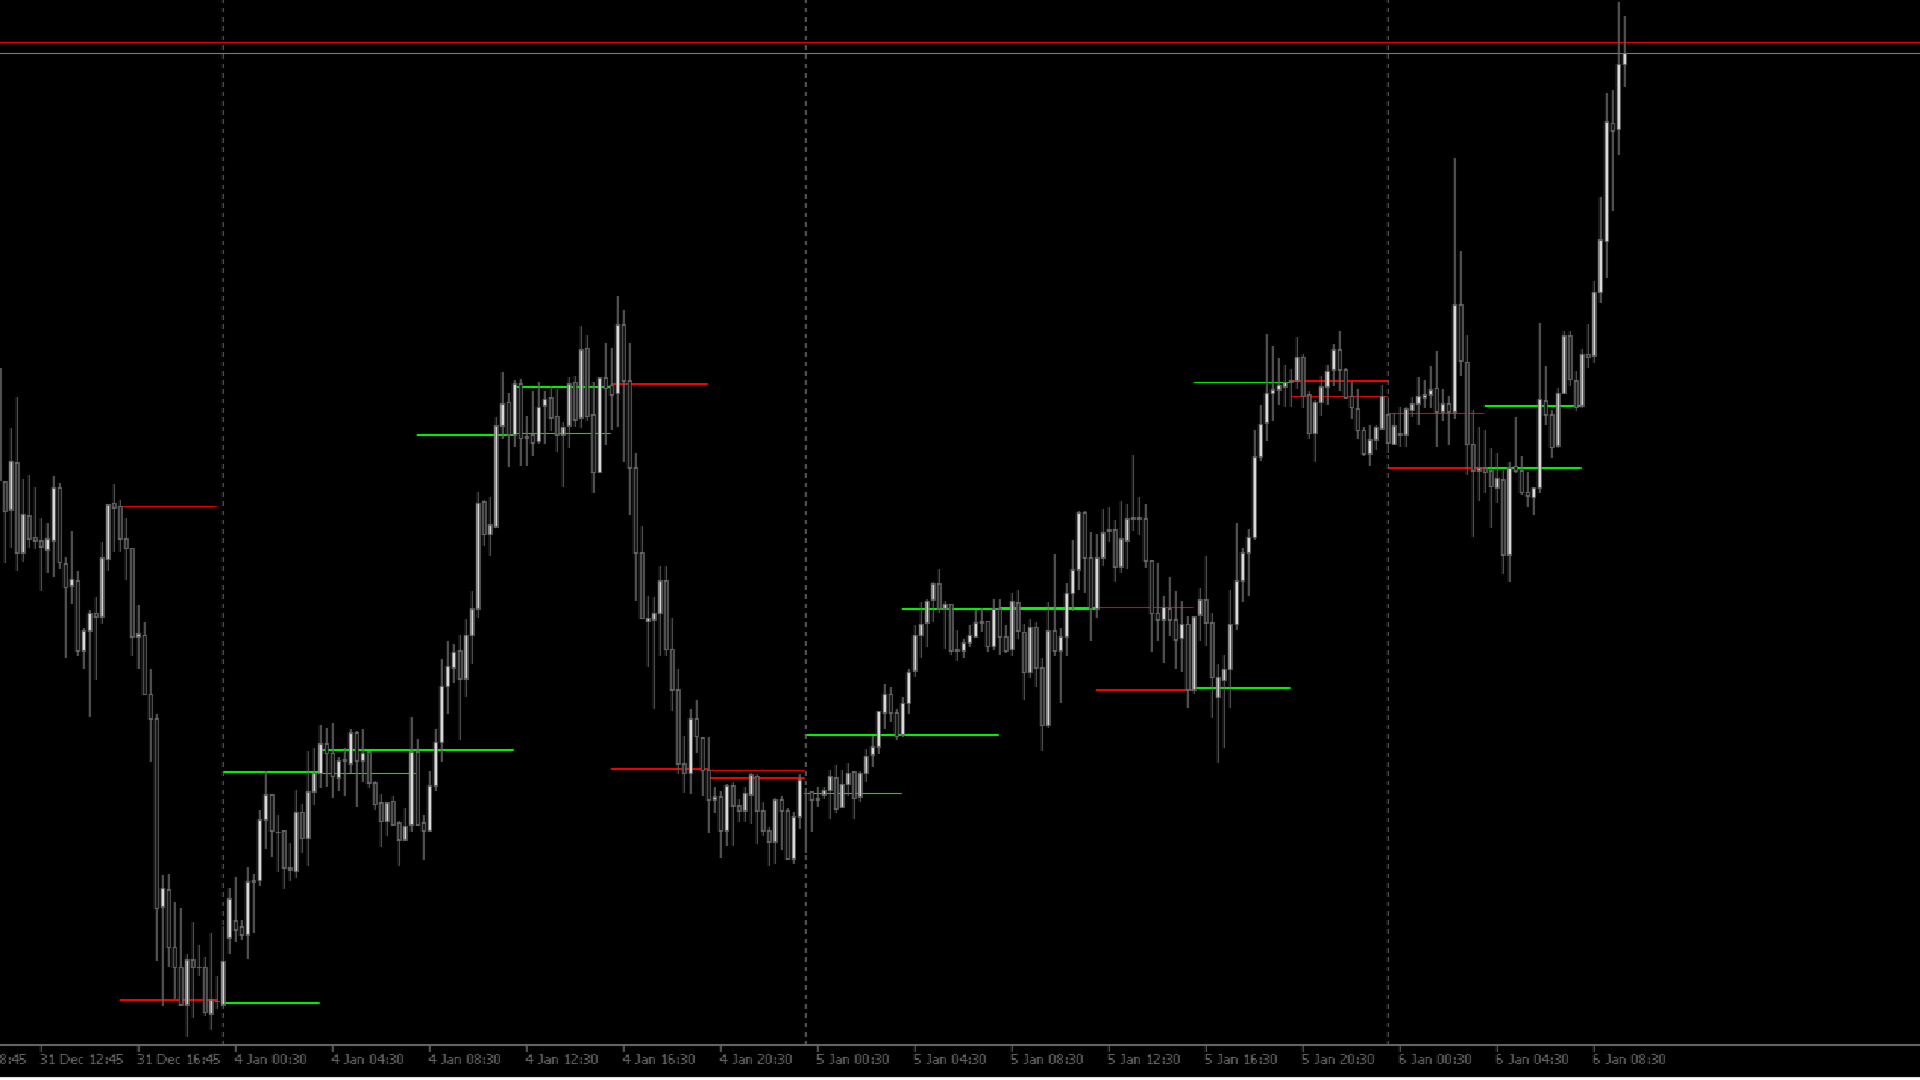
Indicator "HTF Candles Overlay"
This indicator is designed to display higher timeframe candles directly on the working chart. It allows traders to quickly analyze higher periods without switching charts, significantly facilitating trading decisions.
Key Features:
-
Higher Timeframe Candles Visualization:
-
Displays candles from higher periods as horizontal lines of opening and closing directly on the current chart.
-
Supports any timeframe higher than the current one.
-
-
Customizable Historical Depth:
-
Ability to choose the number of days for which historical candles will be displayed.
-
-
Dynamic Updating:
-
Automatically updates when a new candle forms on the higher timeframe.
-
-
Visual Customization:
-
Separately customizable colors for bullish and bearish candles.
-
Adjustable line thickness for better visual perception.
-
Input Parameters:
-
HigherTF — Selection of the higher timeframe (default is H1).
-
DaysBack — Number of historical days to display (default is 5).
-
BullColor — Line color for bullish candles.
-
BearColor — Line color for bearish candles.
-
LineWidth — Line thickness for convenient visualization.
Application:
This indicator is beneficial for traders utilizing multi-timeframe analysis. It can be effectively used for:
-
Identifying major support and resistance levels.
-
Determining the higher timeframe trend.
-
Simplifying visual analysis for strategies based on candle patterns from higher timeframes.
Add "HTF Candles Overlay" to your toolkit and enhance your trading decisions!