Trend variance spectrum indicator

トレーディングの世界では、すべてのティックが新しい物語の始まりとなる可能性があります。信頼できる味方を持つことが重要です。TrendVarianceSpectrumは単なるトレーディングロボットではありません。それはボラタイルな市場におけるあなたのガイドです。長年の経験を基に構築され、25年以上のデータでトレーニングされたこのシステムは、数学の優雅さと現代技術の力を組み合わせています。

TrendVarianceSpectrumの主な利点:

  • 最小限のドローダウン: TrendVarianceSpectrumは非常に低いドローダウンで動作し、信頼性を重視するトレーダーにとって最も安定したソリューションの1つです。

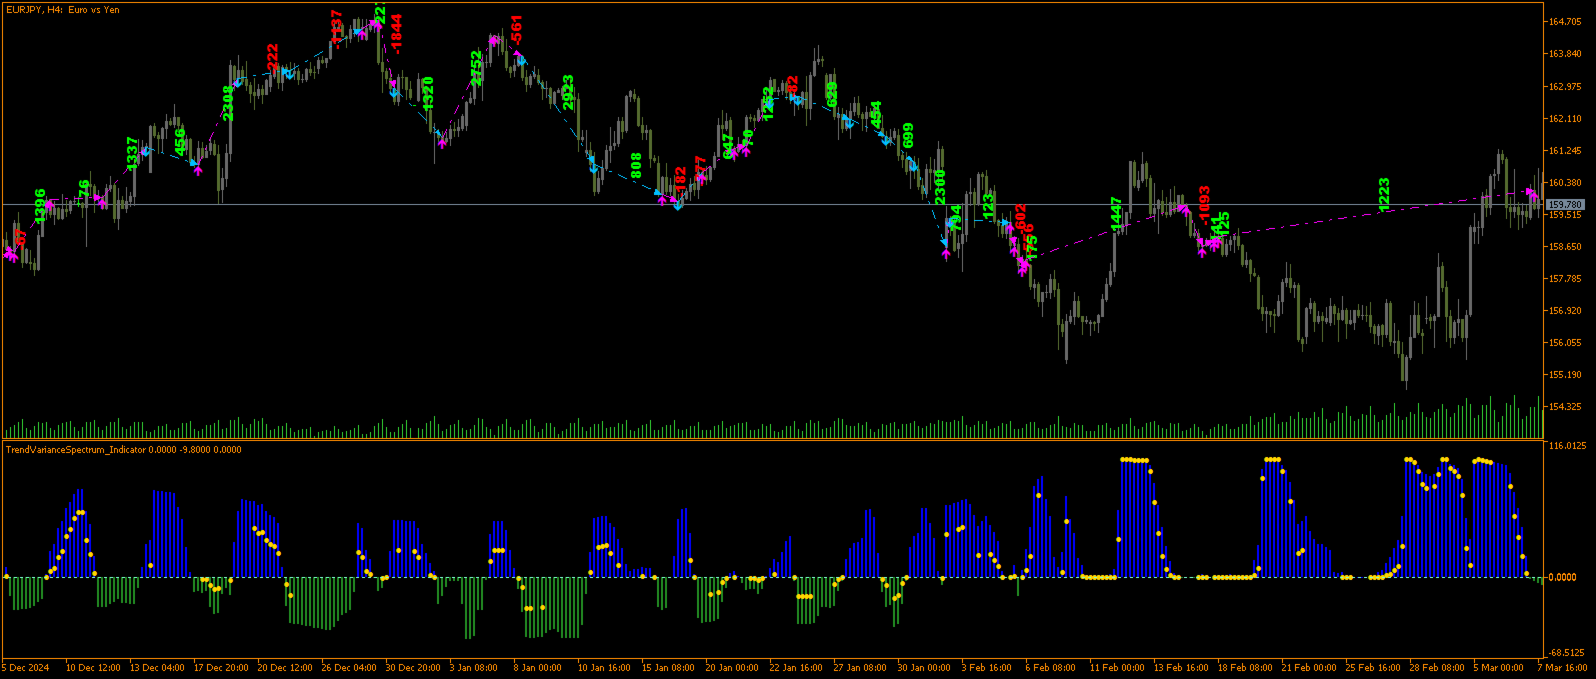
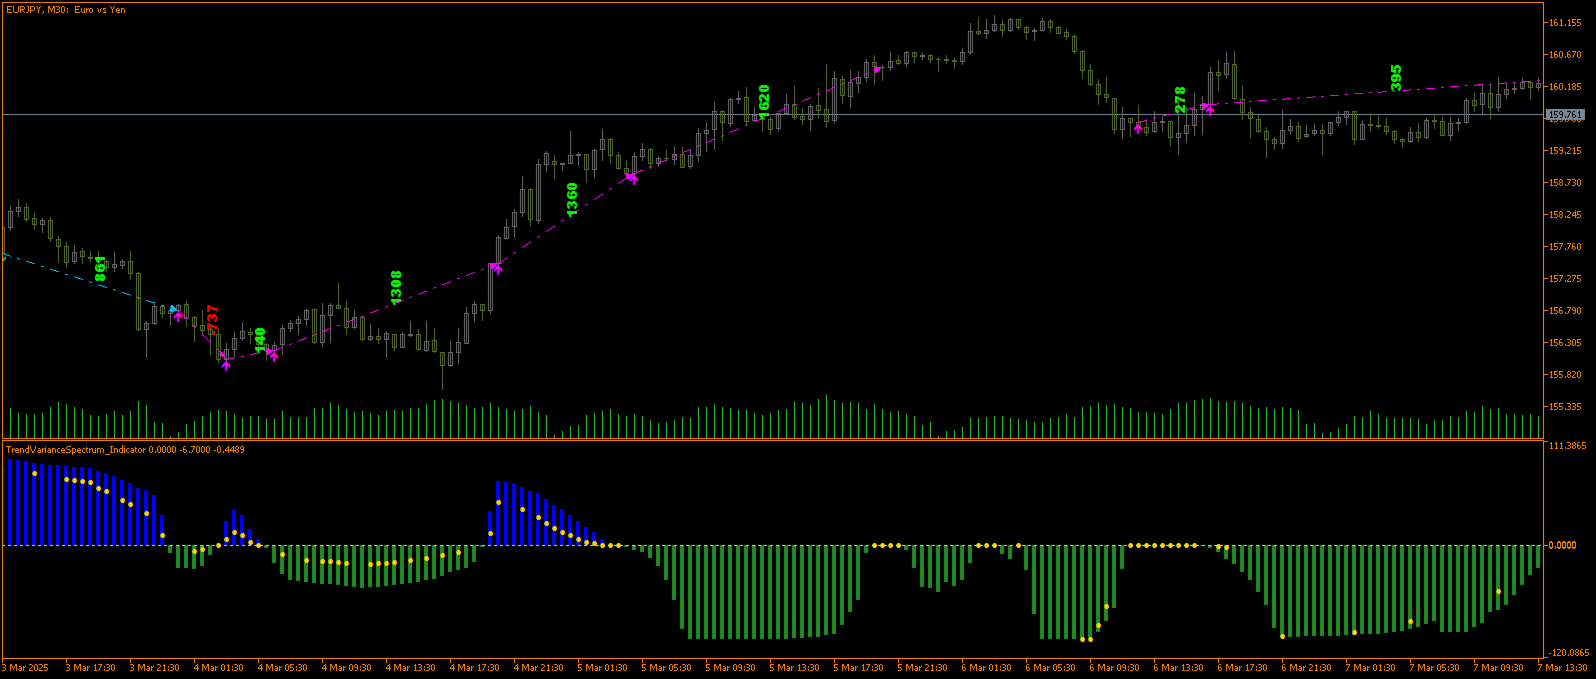
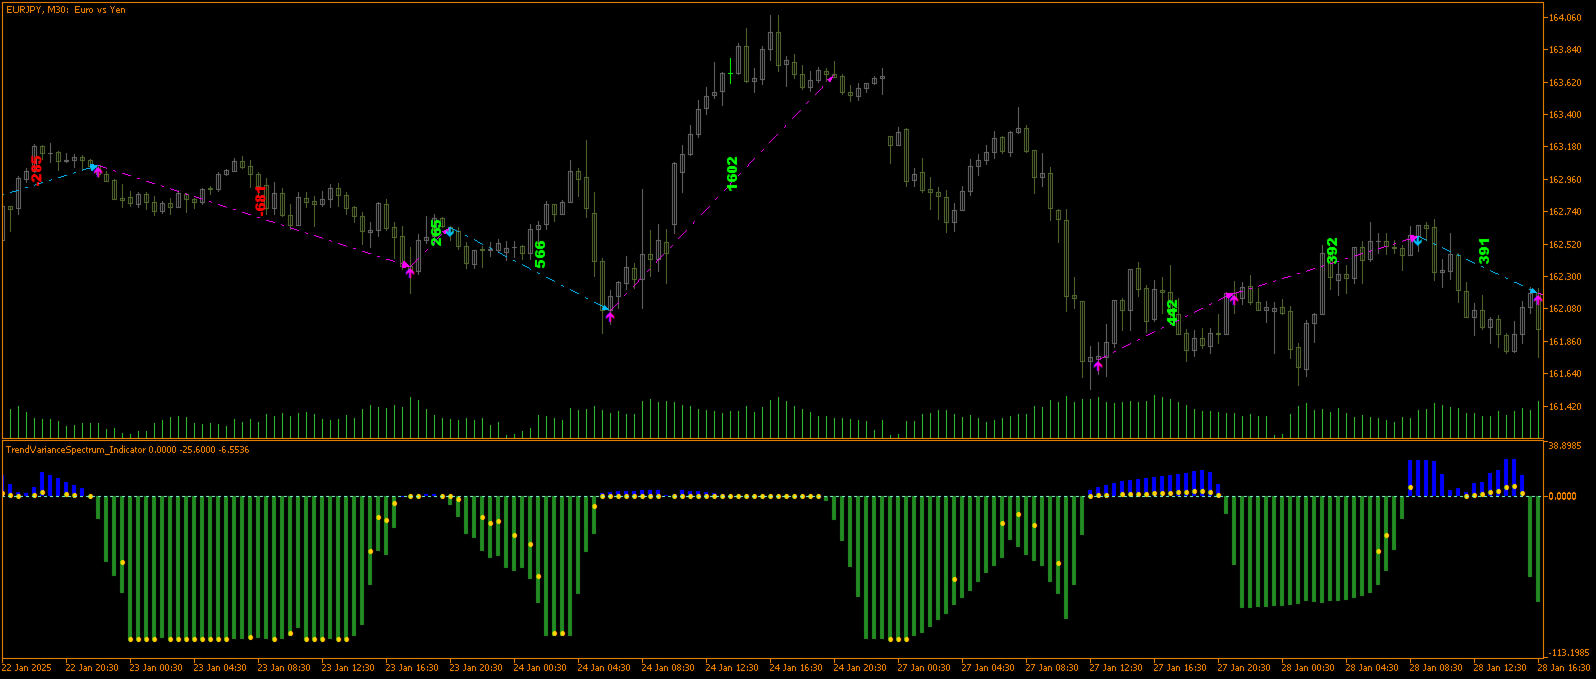
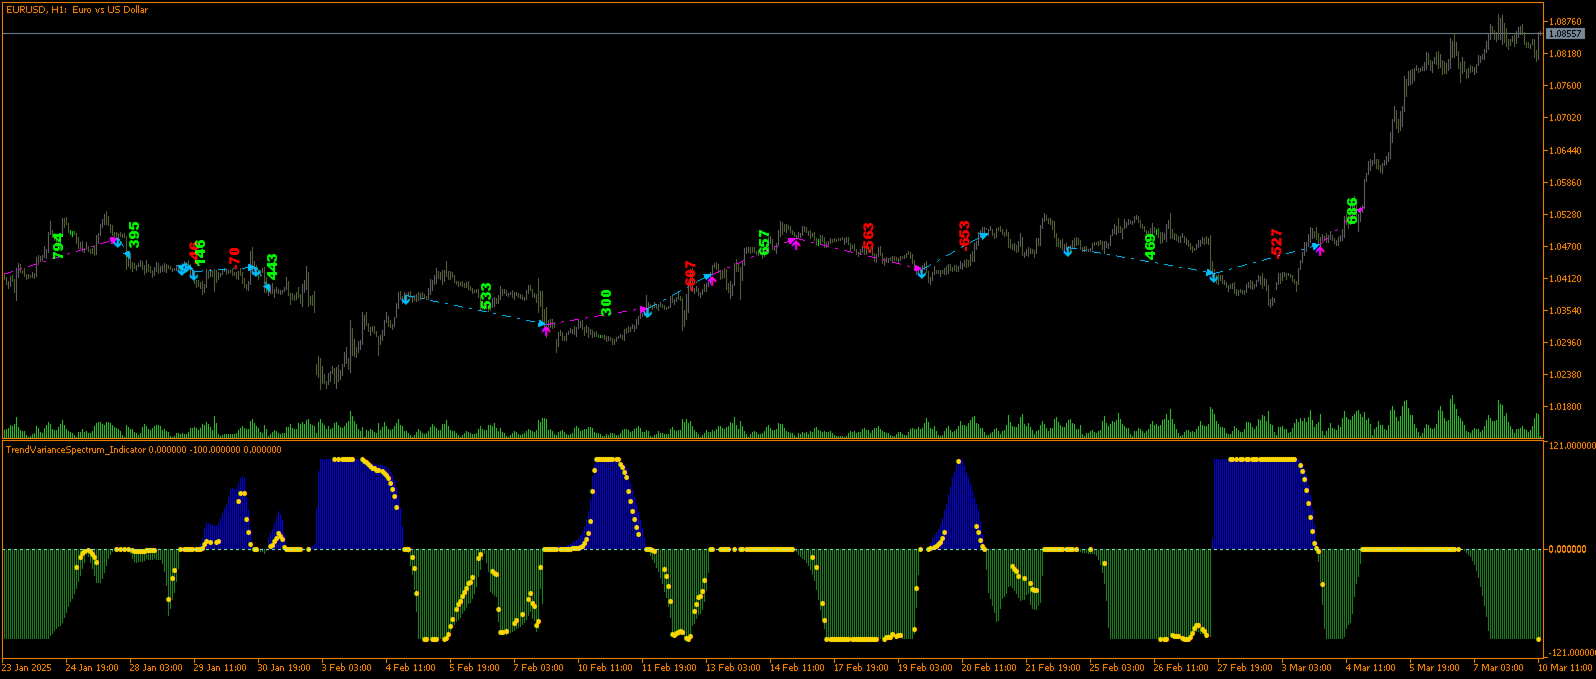
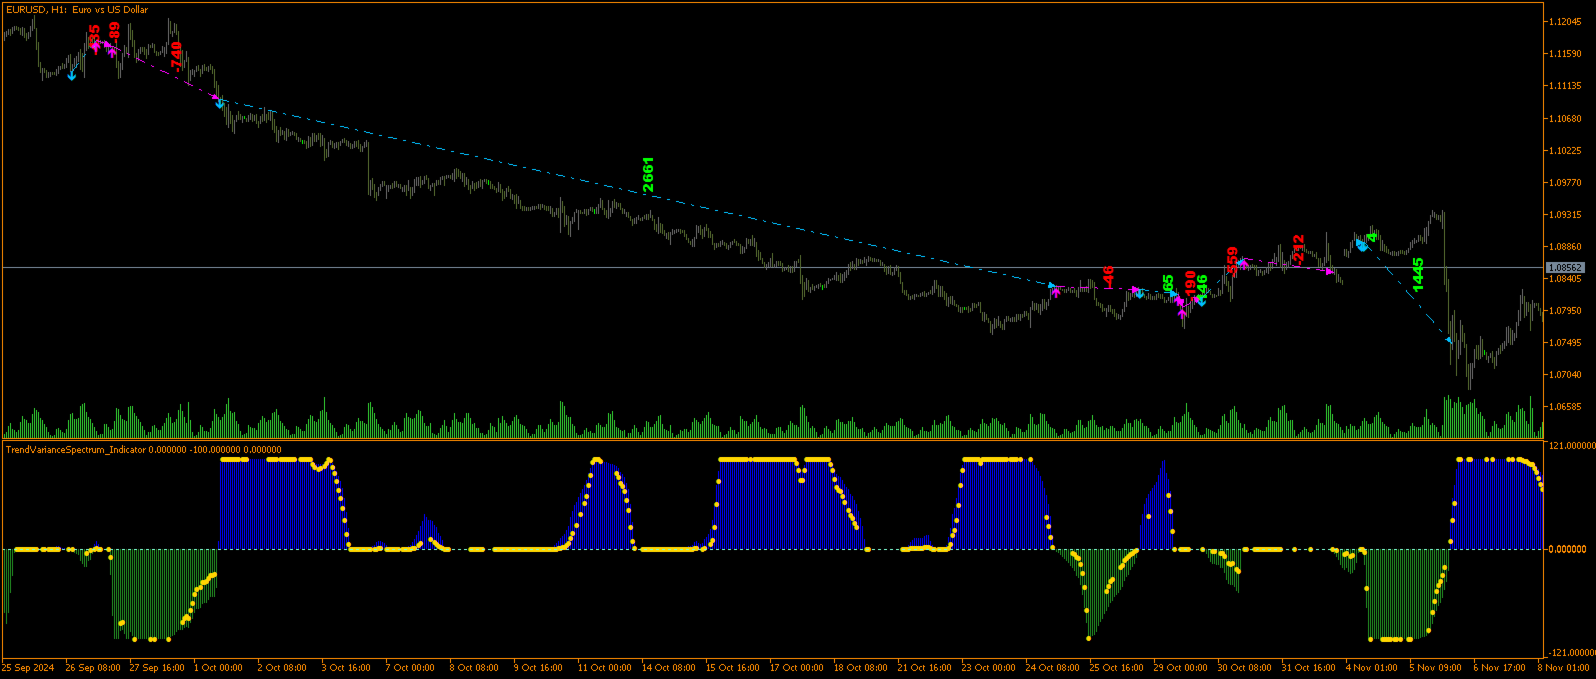
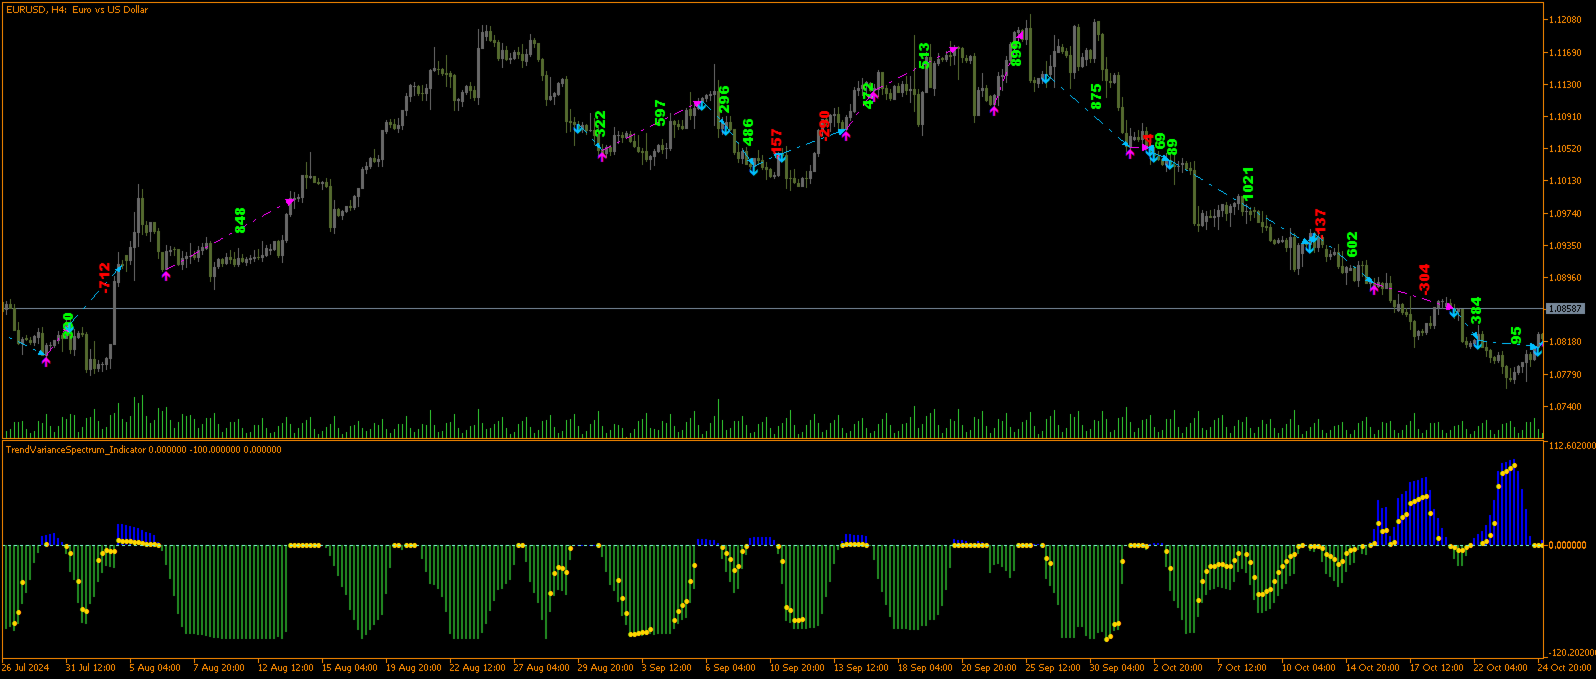
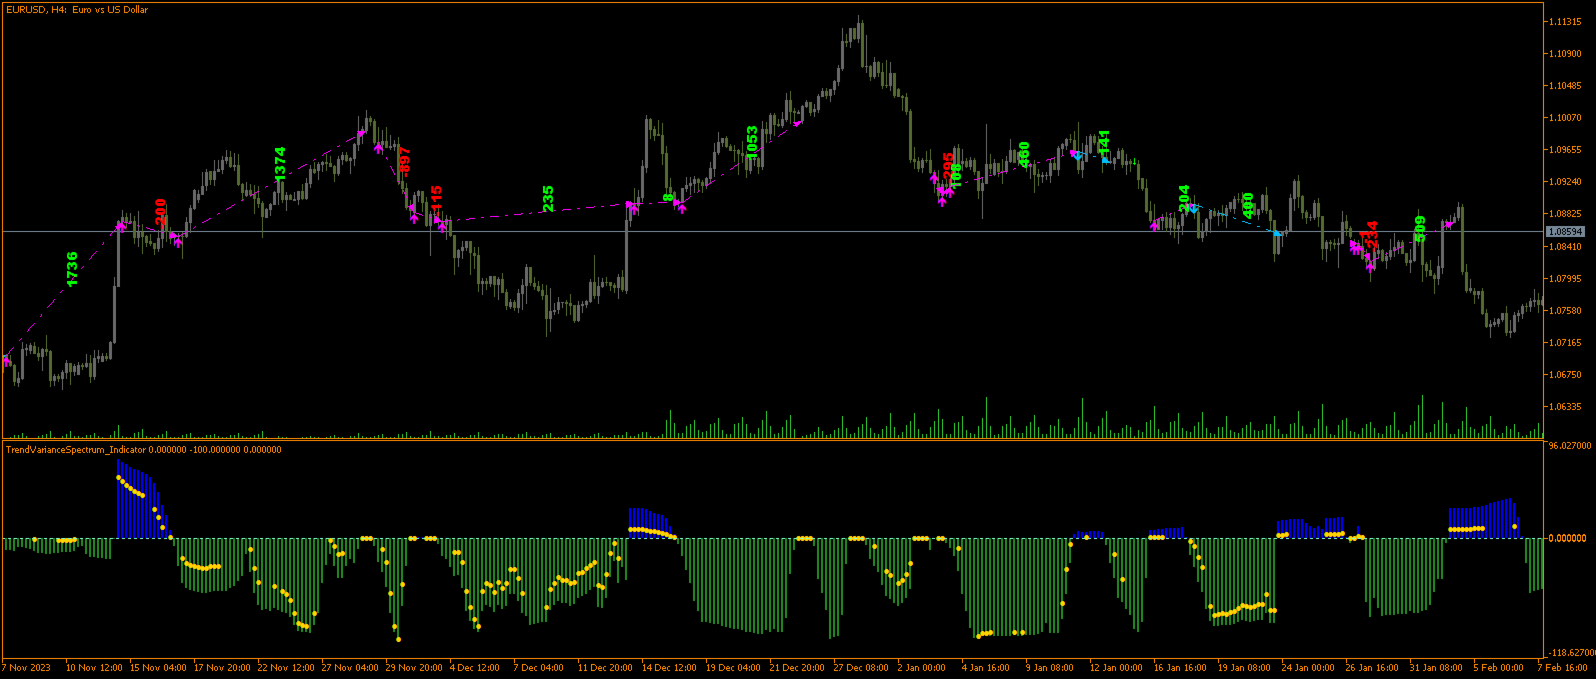
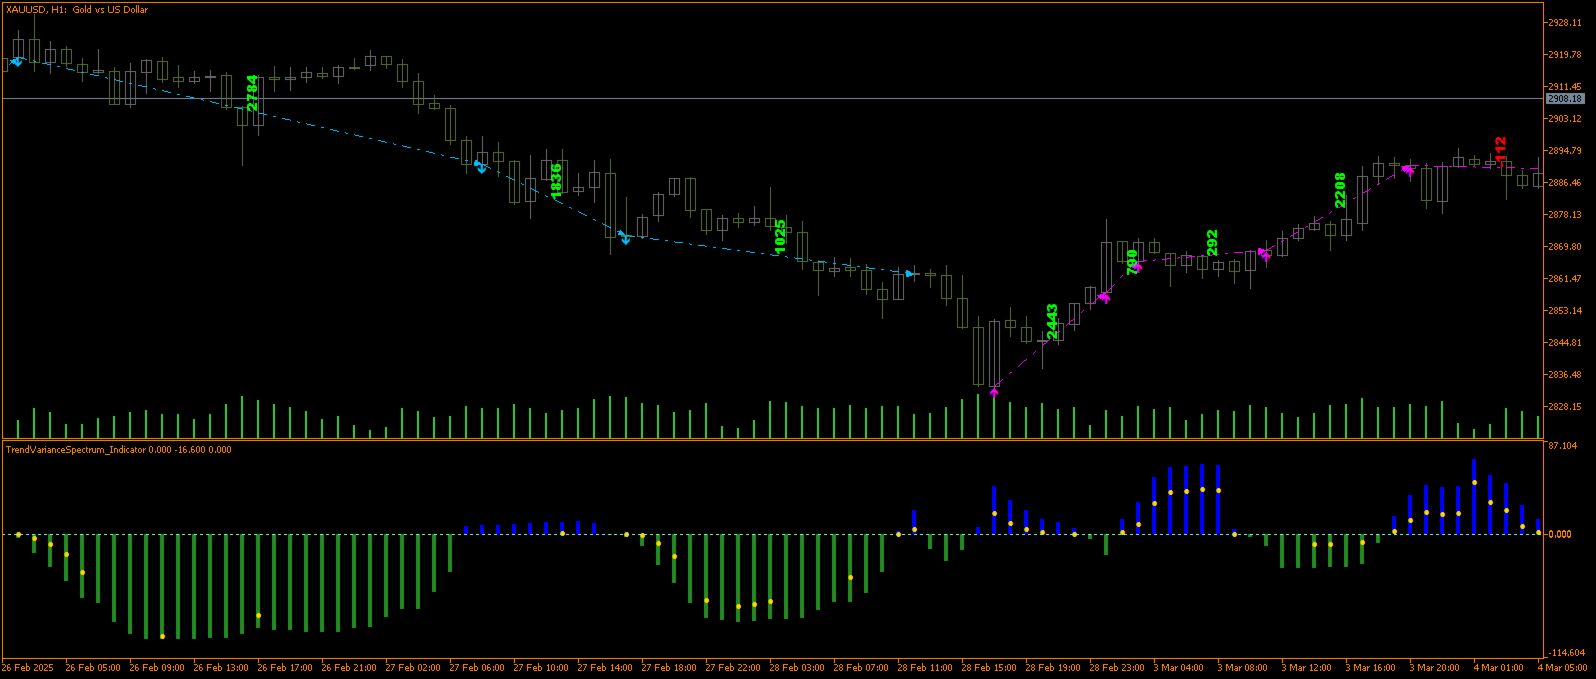
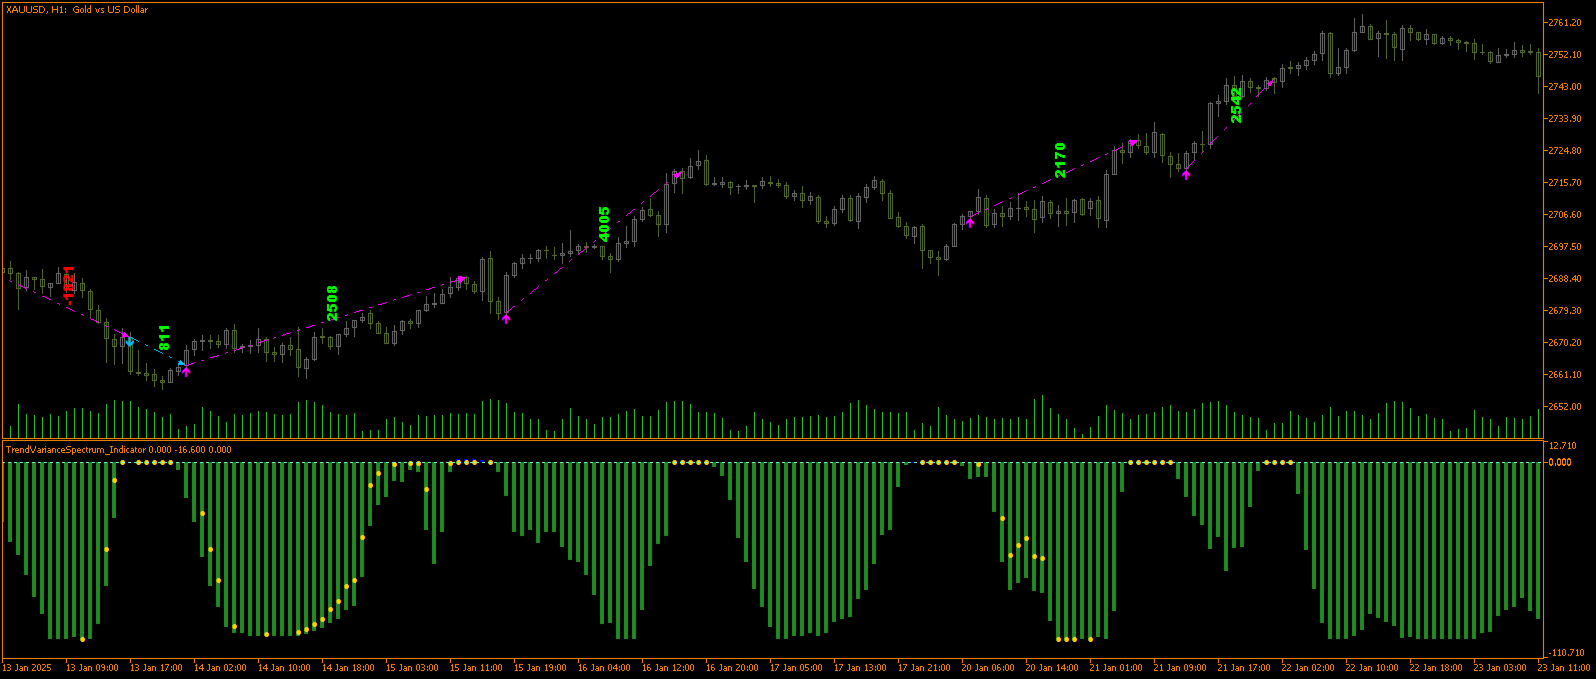
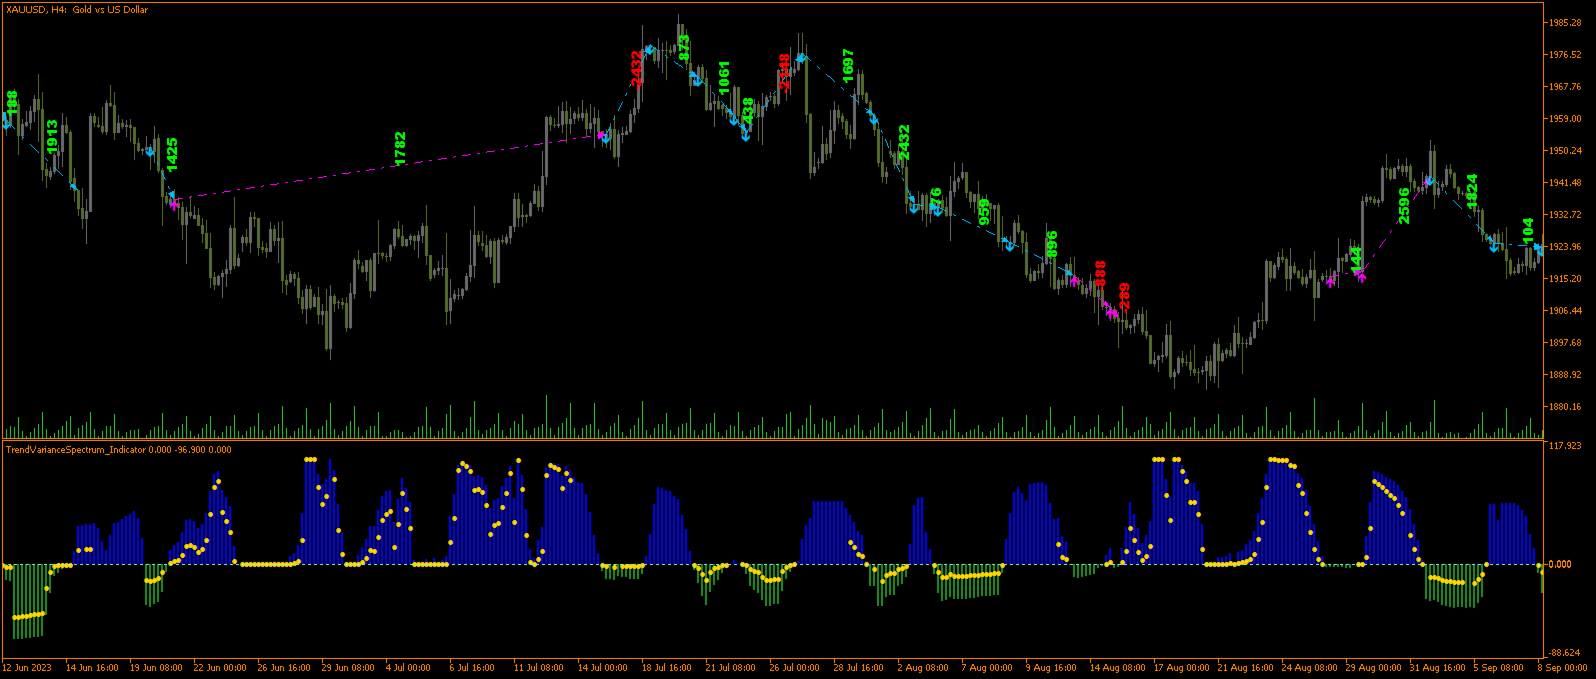
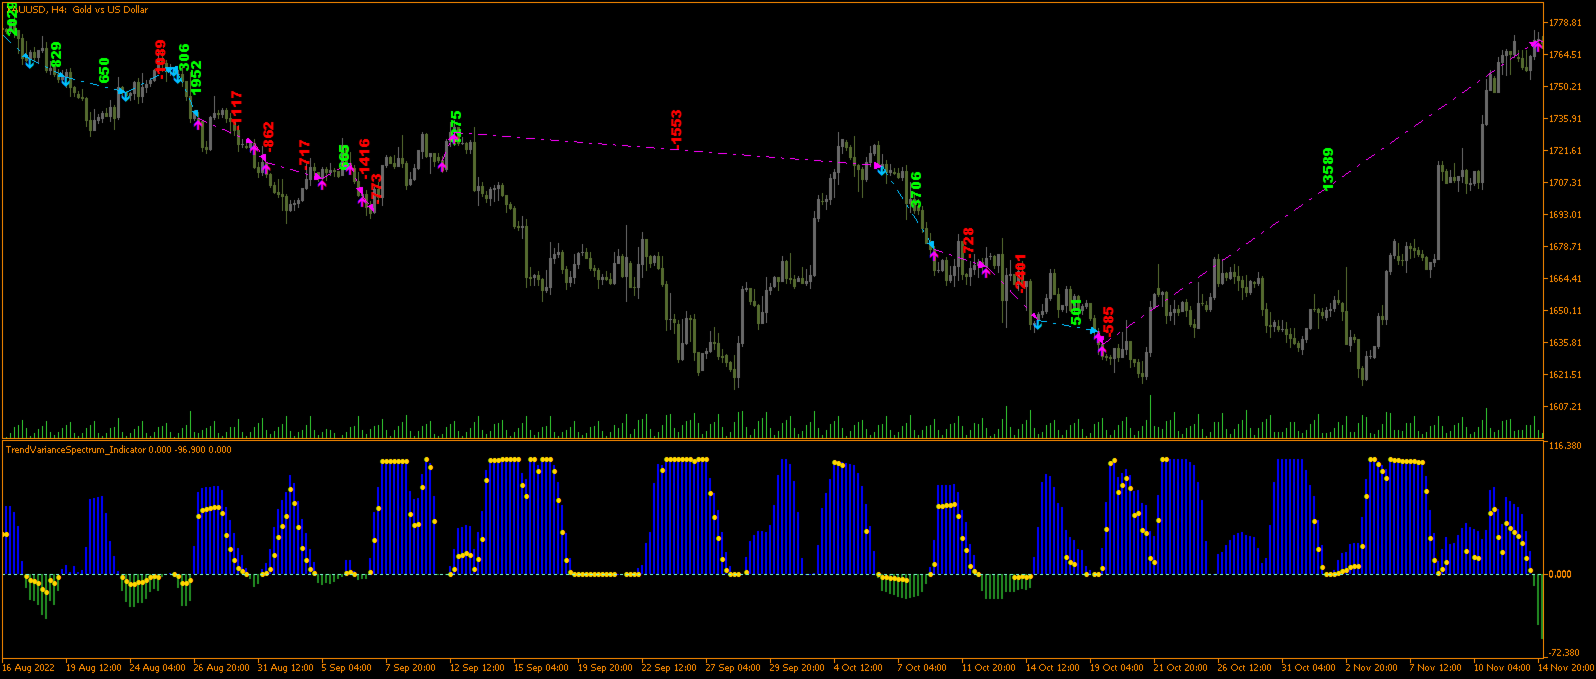
  • ボラティリティへの適応性: このシステムはEURUSD、XAUUSD、EURJPYなどの挑戦的な通貨ペアで優れたパフォーマンスを発揮し、市場の高波動期でも耐性を示します。

  • 複数のタイムフレームでの汎用性: M30、H1、H2、H3、H4のいずれであっても、TrendVarianceSpectrumはあなたのトレーディングスタイルにシームレスに適応します。

  • 最先端のテクノロジー: システムの核心では、セッション開始時の分散の短期分析と長期ボラティリティ指標を組み合わせ、市場のエントリーポイントを正確に特定します。

  • データ駆動型の信頼性: 広範な過去データでトレーニングされたこのシステムは、さまざまな市場シナリオに効果的に対応できます。

TrendVarianceSpectrumは単なるツールではありません。それはあなたのトレーディングパートナーです。精度、安定性、優雅さを兼ね備え、市場での一歩一歩を自信を持って踏み出せるようにします。すべての詳細があなたのために考え抜かれたトレーディングを楽しんでください。TrendVarianceSpectrumは、新たな地平線への鍵です。


おすすめのプロダクト
ElohimTrade Ultimate Confluence Pro — 世界で最も強力なマルチタイムフレーム・コンフルエンスインジケーター ElohimTrade Ultimate Confluence Pro で、あなたのトレーディングの真の可能性を解き放ちましょう。精度・信頼性・市場の深い洞察を追求するトレーダーのために設計された、テクニカル分析ツールの最高峰です。 この最先端インジケーターは、EMA、RSI、MACD、ボリンジャーバンド、ストキャスティクス、ADX などの主要インジケーターを巧みに組み合わせ、M15、H1、H4 といった3つの主要タイムフレームを同時に分析します。その結果、市場ノイズを排除し、最も利益を生むチャンスを明確に示す「コンフルエンススコア」を提供します。 なぜ推測で取引するのですか?次のようにできます: マルチタイムフレームのシナジーを活用: 複数の時間軸を同時に分析し、トレンドや反転の精度を飛躍的に向上させます。 シグナルの品質を最大化: 複数のインジケーターとタイムフレームの確認を統合した高度なスコアリングにより、偽シグナルを大幅に削減。 リアル
トレーディングの世界では、すべてのティックが新しい物語の始まりとなる可能性があります。信頼できる味方を持つことが重要です。TrendVarianceSpectrumは単なるトレーディングロボットではありません。それはボラタイルな市場におけるあなたのガイドです。長年の経験を基に構築され、25年以上のデータでトレーニングされたこのシステムは、数学の優雅さと現代技術の力を組み合わせています。 TrendVarianceSpectrumの主な利点: 最小限のドローダウン : TrendVarianceSpectrumは非常に低いドローダウンで動作し、信頼性を重視するトレーダーにとって最も安定したソリューションの1つです。 ボラティリティへの適応性 : このシステムはEURUSD、XAUUSD、EURJPYなどの挑戦的な通貨ペアで優れたパフォーマンスを発揮し、市場の高波動期でも耐性を示します。 複数のタイムフレームでの汎用性 : M30、H1、H2、H3、H4のいずれであっても、TrendVarianceSpectrumはあなたのトレーディングスタイルにシームレスに適応します。 最先端のテクノロ
NewTest https://backoffice.aurum.foundation/u/DHXP1U 2indtompsonインジケータは、MT4端末用のアナログバージョンから作成されたペア取引または裁定取引のバランスをとるために、ボリュームを決定するための二つの あなたは二つの楽器が重量を量るだろうどのくらい比較する必要があり、あなたがそれを行う方法がわからないのであれば、チャート上のインジケータ さらに、インジケータは、互いに対する楽器の状態を示します-発散/収束。 M5/M15/H1時間枠で使用することをお勧めします 通信のための連絡先777basil@mail.ru あなたの技術的なタスクに従って、expert Advisor/indicator/scriptの書き込み、製造、リワーク、修正を行います。 ありがとう!. https://youtu.be/kgbIgnujuAM
FREE
JESUS CROSS Indicator by Damion Description: The MA Crossover indicator is designed to alert traders when two moving averages cross on a 30-minute chart. It uses a Fast Moving Average (10-period) and a Slow Moving Average (21-period) to detect crossovers, which are commonly used as signals for potential trend changes. Key Features: Fast and Slow MA : The indicator employs a 10-period Fast Moving Average (FastMA) and a 21-period Slow Moving Average (SlowMA). Customizable Settings : Users can req
PHantom N1
Sofya Tselishcheva
PHantom N1 EA – 視覚的市場処理を備えたインテリジェントなエキスパートシステム PHantom N1はデータ駆動型アプローチに基づいており、数年にわたり膨大な過去の市場データを使ってトレーニングされています。 開発環境には、実際の価格変動、ボラティリティフェーズ、構造的な市場変化、外的要因が含まれていました。 使用されたのは従来のテクニカル指標だけでなく、視覚的なチャートパターン、ローソク足形成、オーダーフローなどのマルチモーダルデータも活用されました。 目標は、市場のダイナミクスを認識するだけでなく、予測する能力を持つモデルを開発することでした。 PHantomは継続的に学習を行い、新しい市場環境に適応します。固定的な条件に依存することはありません。 価格は販売されたライセンス数に応じて継続的に上昇します 1. 視覚的市場状況の把握 PHantom N1 EAの特筆すべき機能は、市場の現状を視覚的にスナップショットとして取得する能力です。この視覚的アプローチは、人間のチャート分析行動を模倣しています。 EAは定期的に高品質なチャートのスクリーンショットやデータイメージを
Horizontal volume bars, Cluster analysis, Volume profile Volume in Range gets information about the accumulated volume in a specified vertical range and period in bars. The received data is then plotted on the chart as rectangular boxes with the volume quantity inside. Usage:- The tool acts as a support resistance levels but most importantly it should be used to check in which direction the price breaks out of the significant levels formed by this indicator and then actions to be taken on correc
Manual Killer
Paballo Justice Tsoako
Manual Trade Manager EA - Professional Edition Transform Your Manual Trading with Institutional-Grade Risk Management Are you tired of manually monitoring your trades, constantly adjusting stop losses, and missing opportunities to lock in profits? The Manual Trade Manager EA  is your ultimate hands-off solution for professional trade management, designed to protect your capital and maximize your profits while you focus on finding the best entries. Key Features 1. Intelligent ATR-Based Stop Los
Advanced Fakeout Detection Indicator   Professional Liquidity Sweep & Market Structure Analysis for MetaTrader 5 The Advanced Fakeout Detection Indicator is a sophisticated technical analysis tool designed to identify high-probability market reversal opportunities by detecting liquidity sweeps and structural breaks in price action. What This Indicator Does This indicator automatically identifies and visualizes potential fakeout scenarios where price temporarily breaks through significant level
Outro
Manuel Gonzales
5 (3)
" Outro " is an expert in automated " multi-symbol " trading that requires the trader to test on the pair of his choice and modify the entries according to his convenience. This Expert Advisor has been designed with non-optimized inputs, and   uses a Martingale system   for risk management. It is very important to read the   blog   post before you start. Enter to the private group .  Outro   uses two main indicators,   Relative Strength Index and Stochastic Oscillator , for input decision making
FREE
TPO Profile MT5
Kyra Nickaline Watson-gordon
Definition : TPO is a Time Price Opportunity. Instead of using bars or candles with an Open, High, Low, and Close price, each "bar" in a Market Profile is represented by horizontal bars against the price It is called Market Profile terminology. In other words time-price-opportunity (TPO) profiles are histograms of how much time was spent at each price within the span of the profile. By using a TPO chart, you are able to analyze the amount of trading activity, based on time, for each price level
Equinox Gold
Dmitriq Evgenoeviz Ko
Equinox Gold is a high-tech trading expert advisor (EA) specifically designed for the gold market ( XAUUSD ). The system is based on a unique Market Equilibrium algorithm that identifies areas of imbalance between supply and demand during extreme volatility. Unlike most robots that use dangerous sit-and-wait methods, Equinox Gold relies on mathematical momentum confirmation and strict risk control for every trade. MAIN ADVANTAGES VRP Filter (Volatility Range Filter): The robot automatically ada
Tick Imbalance Bars
Henrique Helmuth Kreutz Pfeifer
Tick imbalance bars (TIB), described in the book Advances in Financial Machine Learning (2018) by Marcos López de Prado. Indicator that show candlestick bars with an different sampling method than time fixed. Real time data is sourced to the indicator and it may be used as substitute of the default graph. Each bar is formed when a predefined tick balance is exceeded, showing in the graph the OHLC of this cluster of ticks. The input variable is the amount of ticks of each bar. The indicator may
FREE
MetaTraderでは、複数の   水平線   を描画し、それぞれの価格レベルを追跡するのは面倒な作業になることがあります。このインジケーターは、価格アラートの設定、サポートとレジスタンスの表示、その他の手動用途のために、等間隔で複数の水平線を自動で描画します。 このインジケーターは、短期間で売買による利益を狙いたい初心者のFXトレーダーに最適です。水平線は、相場がトレンド中またはレンジ相場である場合に、エントリーの可能性があるゾーンを見つける手助けをしてくれます。 機能 入力設定に基づいて、瞬時に複数の水平線を描画可能。 各水平線を区別しやすいように、カラフルなカラーテーマを採用。 複数の取引セッションのレンジを追跡するのに必須のツール。 価格が水平線にタッチした際にアラートを送信。 アラート間に間隔を設定でき、過度な通知を防止。 完全にカスタマイズ可能。 解説 このインジケーターは、入力設定で指定されたデータと指示に従って水平線を描画します。価格がこれらの水平線でどのように反応するかを観察することで、重要なサポート・レジスタンス付近でのトレード機会を見極めることができます。
Nem Nem
Taha Saber Ashour Kamel
Nem Nem is super accurate mt5 indicator it is working with any pair any time frame it will show and provide you with high Winrate signal you can use for forex pairs , gold and any other pairs it is easy to use also you can see the white lines for starting and end of signals it will help you to read the chart and enter and make correct decisions in trades. also it  will be clear for you when to enter and exit from any trades
FREE
SynRhythmic Points Oscillator is an innovative manual trading system based on the combination of two analytical approaches, one focusing on short-term price changes and the other on identifying stable trends and dependencies. This synergy allows for obtaining excellent signals for entering the market while minimizing the influence of random fluctuations and reducing false signals. Additionally, the indicator can easily adapt to various market conditions and be automated, making it convenient for
Stats Summary
Elidio Xavier Guimaraes
Enhance Your Technical Analysis with Stats Summary . The Stats Summary is a robust analytical tool developed for MetaTrader 5 (MT5), providing a detailed statistical overview of price behavior. Unlike traditional indicators, it uses descriptive statistics to map the distribution of prices over a customizable sample period. By defining the sample size, the indicator calculates and displays the following values on the chart: Minimum and Maximum (Min/Max): The complete price range of the selected i
QuantumAlert RSI Navigator is a free indicator available for MT4/MT5 platforms, its work is to provide "alerts" when the market is inside "overbought and oversold" regions in the form of "buy or sell" signals. This indicator comes with many customization options mentioned in the parameter section below, user can customise these parameters as needful. Join our MQL5 group , where we share important news and updates. You are also welcome to join our private channel as well, contact me for the priva
FREE
メタトレーダー用ボリュームプロファイルインジケーターで、ボリューム分析の威力を実感してください! /   MT4バージョン ベーシックボリュームプロファイルは、取引の最適化を目指すマニュアルトレーダーのために特別に設計されたインジケーターです。ボリューム・プロファイル・インジケータは、市場の動きをより深く理解したい本格的なトレーダーにとって不可欠なツールです。当社の革新的なソリューションにより、取引量が価格にどのように分布しているかを明確かつ簡潔に視覚化することができます。これにより、支持線・抵抗線、集積・分配ゾーン、重要なコントロール・ポイントなど、主要な注目エリアを特定することができます。特定の日の取引量を表示する通常の出来高インジケーターとは異なり、ベーシック・ボリューム・プロファイルは特定の価格における取引量を表示します。 当社のインジケータは、直感的でカスタマイズ可能なインターフェイスを備えており、お客様の取引の好みに合わせてカスタマイズすることができます。 特徴 価格チャート上に出来高プロフィールを明確に表示。 出来高の多いエリアと少ないエリアを素早く識別。 取引ス
GoldenFinger MTG  by MidasAlgo  Download the demo of GoldenFinger MTG EA today, then  grab this new release special offer before it expires after 10 purchases to RENT it for just 1 month at only $30/month(N.P.$88.88) – the LOWEST price you can get from MidasAlgo products! This exclusive deal allows investors to  test its robust performance on both DEMO and LIVE accounts before making any further purchase!   REALISTIC GROWTH, NOT HYPE Forget the fantasy results other EAs show. GoldenFinger fo
https://www.mql5.com/en/users/gedeegi/seller    The GEN indicator is a multifunctional technical analysis tool for the MetaTrader 5 (MT5) platform. It is designed to automatically identify and display key Support and Resistance (S&R) levels and detect False Breakout signals, providing clear and visual trading cues directly on your chart. Its primary goal is to help traders identify potential price reversal points and avoid market traps when the price fails to decisively break through key levels
FREE
High Low Open Close
Alexandre Borela
4.98 (43)
このプロジェクトが好きなら、5つ星レビューを残してください。 このインジケータは、指定されたためのオープン、ハイ、ロー、クローズ価格を描画します 特定のタイムゾーンの期間と調整が可能です。 これらは、多くの機関や専門家によって見られた重要なレベルです トレーダーは、彼らがより多くのかもしれない場所を知るために有用であり、 アクティブ。 利用可能な期間は次のとおりです。 前の日。 前週。 前の月。 前の四半期。 前年。 または: 現在の日。 現在の週。 現在の月。 現在の四半期。 現年。
FREE
The new update makes this indicator a complete tool for studying, analyzing and operating probabilistic patterns. It includes: On-chart Multi-asset percentage monitor. Configurable martingales. Twenty-one pre-configured patterns, including Mhi patterns and C3. An advanced pattern editor to store up to 5 custom patterns. Backtest mode to test results with loss reports. Trend filter. Hit operational filter. Martingale Cycles option. Various types of strategies and alerts. Confluence between patter
NeoPips Engine EA – 究極のトレーディング革命が到来! 「トレーディングの真の力は、他者が見逃すものを見抜くことにあります。NeoPips Engineは市場を追うのではなく、市場を掌握します。」 NeoPips Engine EAについて:あなたのインテリジェントなトレーディングの味方 NeoPips Engine EAは、ありきたりなトレーディングロボットではありません。精度、適応性、そして長期的なパフォーマンスを求めるトレーダーのために開発された、AIに最適化された多次元のエキスパートアドバイザーです。 時代遅れの厳格なルールを持つボットとは異なり、NeoPips Engineは生きた戦略です。リアルタイムで市場を思考し、学習し、適応します。 これは単なる自動化ではなく、進化の過程です。 次世代のインテリジェンス:あなたを自由にするコア機能 AIによる意思決定 動的パターン認識 予測トレンド分析 ライブデータに基づくスマートなエントリー/エグジットロジック マルチエンジン戦略コア – 4つのモード。目標はただ
SMC Venom Model BPR インジケーターは、スマート マネー (SMC) コンセプトで取引するトレーダー向けのプロフェッショナル ツールです。価格チャート上の 2 つの主要なパターンを自動的に識別します。 FVG   (フェアバリューギャップ) は、3 本のローソク足の組み合わせで、最初のローソク足と 3 番目のローソク足の間にギャップがあります。ボリュームサポートのないレベル間のゾーンを形成し、価格修正につながることがよくあります。 BPR   (バランス価格範囲) は、2 つの FVG パターンの組み合わせで、「ブリッジ」を形成します。これは、価格がボリュームアクティビティの少ない動きで動くときに、ブレイクアウトしてレベルに戻るゾーンで、ローソク足の間にギャップを作成します。 これらのパターンは、大規模な市場プレーヤーと一般参加者の相互作用が発生するチャート上のボリュームと価格動向の分析に基づいて、トレーダーが主要なサポート/レジスタンス レベル、ブレイクアウト ゾーン、エントリ ポイントを識別するのに役立ちます。 インジケーターは、長方形と矢印の形でパターンを視覚
VectorPrime EA MT5
Maxim Kurochkin
4.2 (15)
VectorPrime — 多層ベクトルロジックを備えたアルゴリズムシステム VectorPrime は、自律的な取引システムとして設計され、マルチタイムフレーム市場環境下での構造化された実行を目的としています。その中核には ベクトル分析 の概念があり、価格のダイナミクスを方向性インパルスとマトリックス構造に分解します。システムは、市場の流れを孤立したシグナルとしてではなく、相互に関連するベクトルの集合として解釈し、一貫した市場マップを形成します。 VectorPrime の主要モジュール: Vector Dynamics Engine — 支配的な方向フローを特定し、短期的なノイズを除去。 Prime Momentum Layer — マイクロインパルスの強さと持続性を評価し、ボラティリティの局面に応じてエントリーを調整。 Matrix Vector Module — 価格挙動をマトリックス的に解釈し、多次元的な市場モデルを構築。 Adaptive Risk Protocol — 構造化されたドローダウン閾値とポジション管理によりエクスポージャーを制御。 実行はあらかじめ定義された構
Mine Farm is one of the most classic and time-tested scalping strategies based on the breakdown of strong price levels. Mine Farm is the author's modification of the system for determining entry and exit points into the market... Mine Farm - is the combination of great potential with reliability and safety. Why Mine Farm?! - each order has a short dynamic Stop Loss - the advisor does not use any risky methods (averaging, martingale, grid, locking, etc.) - the advisor tries to get the most
Rivoluziona il Tuo Trading con l'Indicatore di Segnali Scalping su Timeframe Multipli   Scopri il segreto del successo nel trading con il nostro esclusivo indicatore di SEGNALI scalping su timeframe multipli. Questo strumento avanzato è progettato per trovare segnali efficienti e precisi, aiutandoti a massimizzare i profitti e a ridurre i rischi associati al trading veloce L'indicatore di segnali Alien Scalper MTF è uno strumento di analisi tecnica altamente efficace, progettato per identificare
Quantum Valkyrie
Bogdan Ion Puscasu
5 (32)
クォンタムヴァルキリー - 精密、規律、実行 期間限定で 10% 割引の特別発売価格 - $899.99。 ライブシグナル:   こちらをクリック Quantum Valkyrie MQL5 パブリックチャンネル:   こちらをクリック ***Quantum Valkyrie MT5 を購入すると、Quantum Emperor または Quantum Baron を無料で入手できます!*** 詳細については、プライベートでお問い合わせください! IMPORTANT! After the purchase please send me a private message to receive the installation manual and the setup instructions.      こんにちは、トレーダーの皆さん。 私は Quantum Valkyrie です。正確さ、規律、そして制御された実行で XAUUSD にアプローチできるように構築されています。 数ヶ月間、私のアーキテクチャは舞台裏で洗練され続けました。変動の激しいセッションでテストさ
This Advanced Pivots Point is a   MT5 Indicator and the essence of this technical indicator is to transform the accumulated history data. Pivot Point Indicator provides for an opportunity to detect various peculiarities and patterns in price dynamics which are invisible to the naked eye. Pivot Points Fibonacci retracements Previous day’s open, high, low, and close.
GEN TrendPivot Hunter Developer: Gede Egi Overview GEN TrendPivot Hunter is a multifunctional indicator for MetaTrader 5. It combines Pivot-based Support & Resistance, Fair Value Gaps (FVG), and Trendlines into one analytical tool. The indicator helps visualize possible price reaction areas and market structures directly on the chart. All drawing styles, alerts, and notifications can be customized through the input parameters. The tool does not generate trading signals automatically; it is inte
このプロダクトを購入した人は以下も購入しています
ARIPoint is a powerful trading companion designed to generate high-probability entry signals with dynamic TP/SL/DP levels based on volatility. Built-in performance tracking shows win/loss stats, PP1/PP2 hits, and success rates all updated live. Key Features: Buy/Sell signals with adaptive volatility bands Real-time TP/SL/DP levels based on ATR Built-in MA Filter with optional ATR/StdDev volatility Performance stats panel (Success, Profit/Loss, PP1/PP2) Alerts via popup, sound, push, or email Cu
このインジケーターは、市場で 関心が示されたゾーン をハイライトし、その後に 注文の蓄積ゾーン を表示します。 これは、大規模な**板情報(オーダーブック)**のように機能します。 これは、 巨大な資金 のためのインジケーターです。その性能は卓越しています。 市場にどんな関心が存在していても、 必ず目に見えるようになります 。 (これは 完全に再設計され、自動化されたバージョン です。もはや手動分析は必要ありません。) トランザクションスピード(取引速度) は新しい概念のインジケーターで、市場で大口注文が どこに・いつ 集中しているかを示し、それに基づいたチャンスを提供します。 トレンドの変化を 非常に早い段階 で察知することができます。 FXでは「出来高」と呼ばれているものは誤解されています。実際には、これは 時間あたりの価格変動量 です。したがって、正しい名称は トランザクションスピード です。 考え方・行動・分析の仕方すべてが問われます。 分析パラダイムの転換は非常に重要です。 このインジケーターは、FXにおける出来高の考え方を 根本から再定義 し、論理的な形で正確に活用する、
note: this indicator is for METATRADER4, if you want the version for METATRADER5 this is the link:  https://www.mql5.com/it/market/product/108106 TRENDMAESTRO ver 2.5 TRENDMAESTRO recognizes a new TREND from the start, he never makes mistakes. The certainty of identifying a new TREND is priceless. DESCRIPTION TRENDMAESTRO identifies a new TREND in the bud, this indicator examines the volatility, volumes and momentum to identify the moment in which there is an explosion of one or more of these da
ARIScalp is a powerful trading companion designed to generate high-probability entry signals with dynamic TP/SL/DP levels based on volatility. Built-in performance tracking shows win/loss stats, PP1/PP2 hits, and success rates all updated live. Key Features: Buy/Sell signals with adaptive volatility bands Real-time TP/SL/DP levels based on ATR Built-in MA Filter with optional ATR/StdDev volatility Performance stats panel (Success, Profit/Loss, PP1/PP2) Alerts via popup, sound, push, or email Cus
ARICoin is a powerful trading companion designed to generate high-probability entry signals with dynamic TP/SL/DP levels based on volatility. Built-in performance tracking shows win/loss stats, PP1/PP2 hits, and success rates all updated live. Key Features: Buy/Sell signals with adaptive volatility bands Real-time TP/SL/DP levels based on ATR Built-in MA Filter with optional ATR/StdDev volatility Performance stats panel (Success, Profit/Loss, PP1/PP2) Alerts via popup, sound, push, or email Cust
AriX
Temirlan Kdyrkhan
AriX Indicator for MT5 A powerful trend-following and signal-evaluation tool AriX is a custom MT5 indicator that combines Moving Averages and ATR-based risk/reward logic to generate clear buy/sell signals. It visualizes dynamic SL/TP levels, evaluates past trade outcomes, and displays win/loss statistics in a clean on-chart panel. Key features include: Buy/Sell signals based on MA crossovers ATR-based SL/TP1/TP2/TP3 levels with visual lines and labels Signal outcome tracking with real-time stat
Jita Indicator Pro MT5 | All Timeframes Professional Trend Agreement System – Premium Edition ($500) What Is Jita Indicator Pro? Jita Indicator Pro is a structured trend-confirmation system designed for serious traders who value precision, alignment, and controlled signal behavior. It combines: Advanced band-based trend direction logic ATR-driven structural trigger engine Dual-confirmation agreement system Locked history update design This indicator prints signals only when multiple conditions
Big Player Range
Thalles Nascimento De Carvalho
5 (3)
BigPlayerRange — MT5向け最強インジケーター BigPlayerRange は、MetaTrader 5 で日経ミニやドル先物などの取引において、 最も効果的なインジケーター と評価されています。大口投資家(機関投資家)の行動を可視化し、高精度なテクニカル分析を可能にします。 どのように機能するのか? BigPlayerRangeは、買い圧力ゾーン(緑ライン)と売り圧力ゾーン(赤ライン)を描画し、価格がその範囲を超えるとトレンド方向への動きを示唆します。 緑のライン上で終値: 買いの勢いが強く、上昇トレンドの可能性。 赤のライン下で終値: 売り圧力が優勢で、下落が予想される。 範囲内での価格: レンジ相場でブレイクを待つ段階。 主なメリット: 機関投資家ゾーンの検出: 大口のエントリーポイントを視覚化。 自動ターゲット計算: 利確ポイントを戦略的に設定。 プルバックの可能性分析: リスク管理に役立つ情報提供。 推奨の使い方: Imbalance DOM Pro と併用してゾーンブレイクを確認。 SwingVolum
IVISTscalp5
Vadym Zhukovskyi
5 (6)
iVISTscalp5インジケーターをご紹介します。このインジケーターは、トレーディングにおいて独自でありながら効果的です。時間データに基づくこのインジケーターは、多年にわたる経験と金融市場の深い分析の結果です。iVISTscalp5インジケーターは、手動トレーディングにとって優れたツールです。便利さ、簡単さ、可視化 - すべての複雑さが内部に隠されています。私たちは、iVISTscalp5インジケーターの設定と使用を最大限に簡素化しました。このインジケーターは、MT5ターミナルにあるすべての金融商品に適しています。 稼働時間は、4時から20時(UTC+3)です。 iVISTscalp5インジケーターメニュー(スクリーンショット1を参照): History - 引用を計算する週数 dT_min - 時間間隔の選択(分) TFline - 水平ボリュームの作成(時間枠) BARSline - 水平ボリュームの作成(バー数) TFtrend1 - デイリーチャンネルの作成(時間枠) BARStrend1 - デイリーチャンネルの作成(バー数) TFtrend2 - 週次チャンネルの作成(時
MATADOR SILVER – XAGUSD MT5 M5 Timeframe Scalp Signals MATADOR SILVER is a professional signal and decision-support indicator developed specifically for XAGUSD (Silver) scalping on the M5 timeframe , designed for real market conditions and disciplined execution. This indicator does NOT open, manage, or close trades automatically . It provides structured BUY & SELL signals , intelligent filtering, and alerts, allowing traders to execute trades using their own strategy and risk management rules .
Rtc ML Ai | Predictor CORE MACHINE LEARNING ENGINE Adaptive ML Market Predictor – Multi-Bar Trend & Candle Forecast What This Indicator Does This indicator is a  real-time market prediction engine  designed to analyze price behavior and estimate  future market tendencies . Unlike conventional indicators, this system  does not rely on static parameters or historical curve-fitting , but adapts its internal state dynamically during live market operation. Instead of using static rules, the indic
Recommended TimeFrame >= H1. 100% Non Repainted at any moment.  Use it carefully, only with Trend Direction. Trading Usage: 2 Variants: as Range System or as BreakOut System (Both Only With Trend Direction)::: (Always use StopLoss for minimise Risk); [1] as Range System: (Recommended) in UP TREND:  - BUY in Blue Line , then if price goes down by 50 points (on H1) open Second BUY.   Close in any Profit you wish: TrailingStop(45 points) or Close when Price touches upper Gold Line. in DOWN TREND
This is an advanced indicator used with success rate.Unlock the secrets of trading Boom and Crash spikes with our powerful MT5 indicator! This spike detection tool provides accurate buy and sell signals, trade alerts, and High success rate entries. Perfect for scalping, day trading, and swing trading. Get the best Boom and Crash strategy with our Deriv Boom and Crash spike indicator. Indicator does not redraw or repaint. Recommendation · Use a Virtual Private Server (VPS) for 24/7 alerts on mob
WARNING: This indicator is distributed EXCLUSIVELY on MQL5.com MT4 version:   https://www.mql5.com/it/market/product/160363 MT5 version:   https://www.mql5.com/it/market/product/160410 ============================================================================================= MAX RIBBON ver 1.00 The indicator that shows you the TREND clearly and unambiguously! ============================================================================================= DESCRIPTION MAX RIBBON is an advanced tre
+++++++++++++++++++++++++++++++++++++++++++++++++++++++++++++++++++++++++++++++++++++++++++++++++ +++ Link to EURUSD Only Free Version -->  https://www.mql5.com/en/market/product/156904?source=Unknown +++++++++++++++++++++++++++++++++++++++++++++++++++++++++++++++++++++++++++++++++++++++++++++++++ Hallo Trader, This is a traditional GANN & FIBONACCI strategy based on detection of an impulsive move in the opposite direction. This is called a Breakout. At the moment of Breakout, the indicator draw
##   ONLY GOLD ##   Тiльки Золото ## **Mercaria Professional Trading Zones - Complete Guide** ## **Mercaria Professional Trading Zones - Повний посібник** ### **How Mercaria Zones Work / Як працюють зони Mercaria** **English:** Mercaria Zones is an advanced trading indicator that identifies high-probability support and resistance areas using ZigZag extremes combined with mathematical zone calculations. The indicator works on multiple timeframes simultaneously, providing a comprehensive view
マーケットメーカーのためのツール。 Meravith は次の機能を提供します: すべての時間足を分析し、現在有効なトレンドを表示します。 強気と弱気の出来高が等しくなる流動性ゾーン(出来高均衡)を強調表示します。 異なる時間足のすべての流動性レベルをチャート上に直接表示します。 テキスト形式の市場分析を生成し、参考情報として表示します。 現在のトレンドに基づいて目標値、サポートレベル、ストップロスを計算します。 取引のリスクリワード比を算出します。 口座残高に基づいてポジションサイズを計算し、潜在的な利益を推定します。 また、市場に大きな変化があった場合には警告を表示します。 インジケーターの主要ライン: 強気/弱気の出来高エグゾーストライン ― 目標値として機能します。 市場のトレンドを示すライン。市場が強気か弱気かによって色が変わり、トレンドのサポートとして機能します。主にその色が市場センチメントを示します。 出来高均衡ライン(Eq)。Eq(Volume Equilibrium)ラインはシステムの中核です。これは買い手と売り手の出来高のバランスポイントを表します。市場の流動性を示し
FRONTIER PIVOTS - Geometric Levels Indicator This indicator plots support and resistance levels/ranges on the chart using mathematical calculations. It helps traders identify potential price reaction zones based on geometric patterns. Main Features: Automatically calculates and displays key price levels Plots both support and resistance lines Uses daily price data for level calculation Clean visual presentation with different colors for different level types No repainting - levels remain static
A tool for on-chart strategy backtesting and performance analysis. A utility for developing, debugging, and testing custom trading ideas and indicator functions. An indicator designed to quickly test trading concepts and visualize the effectiveness of different input parameters. An all-in-one sandbox for testing everything from simple crossovers to complex, multi-condition trading systems.
VTrende Pro
Andrii Diachenko
5 (1)
VTrende Pro - MTF indicator for trend trading with a display panel for MT5 *** Videos can be translated into any language using subtitles (video language - Russian) Although the signals of the VTrende Pro indicator can be used as signals of a full-fledged trading system, it is recommended to use them in conjunction with the Bill Williams TS. VTrende Pro is an extended version of the VTrende indicator. Difference between Pro version and VTrende: - Time zones - Signal V - signal 1-2 waves -    S
CGE Trading Suite
Carl Gustav Johan Ekstrom
5 (1)
CGE Trading Suite delivers the analytical edge typically reserved for professional trading desks. The platform integrates a full suite of analytical tools into one seamless workflow: dynamic grid mapping, liquidity behavior analysis, ECM, trend lines, MIDAS, trade cycles, and directional channel projections. Together, these provide a unified view of market structure and momentum. Directional clarity is further enhanced by the capital flow index, which measures currency basket strength to identif
FXLAND Smart Reversal Indicator (MT5) FXLAND Smart Reversal Indicator is a professional technical analysis tool designed to help traders identify potential price reversal zones and key market turning points with clarity and precision. The best reversal indicator and price return by choosing only one ceiling or floor in each time frame A masterpiece of combining mathematics and Gann, fractal matrix, Fibonacci, movement angle and time. Completely intelligent Key Features Detects potenti
A scalping indicator based on mathematical patterns, which on average gives signals with relatively small SL, and also occasionally helps to catch big moves in the markets (more information in the video) This indicator has three main types of notifications: The first type warns of a possible/upcoming signal on the next bar The second type indicates the presence of a ready signal to enter the market/open a position The third type is for SL and TP levels - you will be notified every time price re
MATADOR GOLD – XAUUSD MT5 M5 Timeframe Scalp Signals MATADOR GOLD is a professional signal indicator designed for XAUUSD (Gold) scalping on the M5 timeframe , with optional higher-timeframe confirmation. This indicator does not open or manage trades automatically . It provides structured buy and sell signals, intelligent filtering, and alerts, allowing traders to execute trades using their own strategy and risk management rules. Core Concept (Multi-Concept Architecture) MATADOR GOLD is built
The Expert Advisor and the video are attached in the Discussion tab . The robot applies only one order and strictly follows the signals to evaluate the indicator efficiency. Pan PrizMA CD Phase is an option based on the Pan PrizMA indicator. Details (in Russian). Averaging by a quadric-quartic polynomial increases the smoothness of lines, adds momentum and rhythm. Extrapolation by the sinusoid function near a constant allows adjusting the delay or lead of signals. The value of the phase - wave s
Классификатор силы тренда. Показания на истории не меняет. Изменяется классификация только незакрытого бара. По идее подобен полной системе ASCTrend, сигнальный модуль которой, точнее его аппроксимация в несколько "урезанном" виде, есть в свободном доступе, а также в терминале как сигнальный индикатор SilverTrend . Точной копией системы ASCTrend не является. Работает на всех инструментах и всех временных диапазонах. Индикатор использует несколько некоррелируемых между собой алгоритмов для класси
FFx Universal Strength Meter PRO is more than a basic strength meter. Instead of limiting the calculation to price, it can be based on any of the 19 integrated strength modes + 9 timeframes. With the FFx USM, you are able to define any period for any combination of timeframes. For example, you can set the dashboard for the last 10 candles for M15-H1-H4… Full flexibility! Very easy to interpret... It gives a great idea about which currency is weak and which is strong, so you can find the best pai
The FFx Universal MTF alerter shows on a single chart all the timeframes (M1 to Monthly) with their own status for the chosen indicator. 9 indicators mode (MACD-RSI-Stochastic-MA-ADX-Ichimoku-Candles-CCI-PSAR). Each can be applied multiple times on the same chart with different settings. Very easy to interpret. Confirm your BUY entries when most of the timeframes are showing green color. And confirm your SELL entries when most of the timeframes are showing red color. 2 Alert Options : input to s
The FFx Watcher PRO is a dashboard displaying on a single chart the current direction of up to 15 standard indicators and up to 21 timeframes. It has 2 different modes: Watcher mode: Multi Indicators User is able to select up to 15 indicators to be displayed User is able to select up to 21 timeframes to be displayed Watcher mode: Multi Pairs User is able to select any number of pairs/symbols User is able to select up to 21 timeframes to be displayed This mode uses one of the standard indicators
FFx Patterns Alerter gives trade suggestions with Entry, Target 1, Target 2 and StopLoss .... for any of the selected patterns (PinBar, Engulfing, InsideBar, OutsideBar) Below are the different options available: Multiple instances can be applied on the same chart to monitor different patterns Entry suggestion - pips to be added over the break for the entry 3 different options to calculate the SL - by pips, by ATR multiplier or at the pattern High/Low 3 different options to calculate the 2 TPs -
作者のその他のプロダクト
Trend deviation scalper - is the manual system to scalp choppy market places. Indicator defines bull/bear trend and it's force. Inside exact trend system also defines "weak" places, when trend is ready to reverse. So as a rule, system plots a sell arrow when bull trend becomes weak and possibly reverses to bear trend. For buy arrow is opposite : arrow is plotted on bear weak trend. Such arrangement allows you to get a favorable price and stand up market noise. Loss arrows are closing by common p
Golden section price action indicator - is a trend-scalping complete system with enter and exit points. Indicator is based on most powerfull price action japan patterns that are filtered by volume, volatility, market phase. Pattern is not a simple combinations of candles. Patterns must have "weight" to move market in right direction. "Weight" - is the summary of pattern's volume, the size of pattern candles according to last average volatility and ofcourse pattern must appear in correct market p
SupportResistancePeaks Indicator indicator - is the combination of dynamic support/resitance and price action pattern. As a rule support/resistance indicators uses already calculated, history levels. The most disadvantage of this method - new(incomming) levels always are not the same as were on history, in other words accuracy is not so high as expected. My indicator is looking for dynamic/live levels that are forming right now after trend lost it's power and choppy market starts. As a rule exac
Trend deviation scalper - is the manual system to scalp choppy market places. Indicator defines bull/bear trend and it's force. Inside exact trend system also defines "weak" places, when trend is ready to reverse. So as a rule, system plots a sell arrow when bull trend becomes weak and possibly reverses to bear trend. For buy arrow is opposite : arrow is plotted on bear weak trend. Such arrangement allows you to get a favorable price and stand up market noise. Loss arrows are closing by common p
Trend driver bars is the manual trading system, which defines current trend continue or it's pull-back/reverse. "Driver" bars - are price action patterns that has powerfull affect on market, defining it's near future direction. Generally, driver bars represents trend "skeleton" and often anticipates new market impulse. System plots arrows when market shows 3 pattenrs in a row(most powerfull combo-pattern), and makes fast scalping of incomming movement. Loss positions closes by common profit. Lot
Wave Impulse OmegaScalper - is the manual system for scalping. In many cases Indicator "eats" almost all possible trend wave. System defines up price wave and down price wave. Inside the exact wave - system defines true trend movement and choppy market. Indicator plots signals while market is trending, powerfull and has quiet good volatility. This is complete system with enter and exit points. Main Indicator's Features Signals are not repaint,non-late or disappear(exept cases when system recalcu
Reverse side scalper is the manual trading system, that works on choppy(anti-trend) market. As a rule markets are on 80% choppy and only 20% is trend phase. System is based on custom step Moving and RSI and reverse pattern. System defines up movement, down movement, trend / choppy phases. Indicator plots Buy signal arrow when current direction is down and phase is trend, Sell signal arrow is plotted when currently is up movement and phase is trend. As a rule it allows to "catch" local maximum/mi
Binary step clouds - is the complete trading system with enter and exit points. System is based on double smoothed exponential step moving and volume weighted simple step moving.Generally each movings define trend direction and places when trend is in active phase. Signals plots when both movings approache to active trend phase and market speed is high.  Main Indicator's Features Signals are not repaint,non-late or disappear(exept cases when system recalculates all history datas,refreshing main
Acceleration Force Meter Indicator - is a trend system that join market in trend phase and after trend pull-back. AFM indicator - is the system that watchs market phases from flat to extreme volatility and prefers to enter in market when it's active, more volatility, ignoring most flat places. This is 100% complete trading system including enter and exit points. It works well with profitable trades - maximizing take profit targets(analysis of recent market volatility, its pips range to adapt cur
ImbaTrend Runner - is the trend following manual system for forex/crypto market. It defines medium-term trends and works with it in intraday mode. System shows enter points, profit and loss targets. As a rule profit targets are 2-3 X bigger than loss targets. Indicator is AutoAdaptive and it automatically updates it's settings during trading. Indicator is sensitive to market changes, regular updates helps to stay in relevant trend. Main Indicator's Features Signals are not repaint, late or disap
Early WPR divergence - is the manual system to define trend reverse. Green histogram shows main trend, Orange one - shows "short"/local trend. System is looking for clear divergence between both trends and pick up position(plot buy/sell arrows). When main trend is up, but local trend reverses to bearish trend and get's big power - sell arrow is plotted;    When main trend is down, but local trend reverses to bullish trend and get's big power - buy arrow is plotted;  Main inputs are : mediumTrend
Bull bear pressure indicator - is the manual system which defines bull/bear market. When lines is above zero level - market is strong bullish, and when lines below zero level - market is bearish. First line represents global trend and second one are smoothed and shows local market's mood. Main inputs are : MainPeriod- main indicator's period for global trend calculation; SignalPeriod - period for   smoothed and shows local market's trend; Main Indicator's Features Signals are not repaint,non-la
ROC acceleration-deceleration is the manual system for medium-term scalping. Indicator based on custom ROC system which defines bullish/bearish market and especially  acceleration-deceleration of tendention in the market's main direction. Buy arrow is plotted during bearish market when current trend decelerates and sell  arrow is plotted during bullish market when current trend decelerates. Main Indicator's Features Signals are not repaint,non-late or disappear(exept cases when system recalculat
ASI fractals with DPO filter - is the manual trend-following system. ASI fractals are the base of every trend. System plots an arrow when fractal pattern appears on ASI indcator and DPO direction is same as incomming signal. System has several ways of usage : simply indicator, indicator with suggested arrows, arrows with single targets and arrows with common profit targets. User can simply switch indicator's modes directly from chart. Main Indicator's Features Signals are not repaint,non-late or
Trend reversal index - is the manual trading system that works with overbought , oversold levels and reversal patterns. Sell arrow is plotted when indicator is higher than overbought level and here forms reversal pattern, all pattern points  located higher than overbought level. Opposite with buy arrow : ndicator is lower than oversold level and here forms reversal pattern, all pattern points located lower than overbought level.  Main Indicator's Features Signals are not repaint, late or disapp
Demarker pullback system - is the manual trading system for choppy markets. It show 2 colored histogram.  When histogram is blue - market is quite bullish, when histogram ir orange - market is more bearish. Up arrow is plotted when histogram is in oversold zone but blue color. Down arrow is plotted when histogram is in overbought zone but orange color. These patterns shows false breakout and possible soon reverse(price is overbought but shows bearish signs and price is oversold but shows bullis
TPM Cross (trend power moving cross) - is a trend following strategy based on custom signal points. Indicator consists from main custom moving chart line and trend power line. Indicator defines up and down movements by it's trend power and custom moving direction. When current market's trend looses it's power and opposite trend starts - power trend line  crosses moving and indicator plots an arrow.  Main indicator's adjustable inputs : movingPeriod - period of moving line  trendPeriod  - period
Impulse fractals indicator - is counter-trend oriented complex market fractal pattern.  Market creates bull/bear impulse, trend starts, fractals on impulsed wave are an agressive pullback signals. Buy arrow is plotted when market is bearish and it's impulse showed up-side fractal, and sell arrow is plotted when market is bullish and it's impulse showed dn-side fractal. Main indicator's adjustable inputs : impulsePeriod - main period of impulse histogram  filterPeriod  - smoothes impulse accordi
Floating peaks oscillator - it the manual trading system. It's based on Stochastik/RSI type of oscillator with dynamic/floating  overbought and oversold levels. When main line is green - market is under bullish pressure, when main line is red - market is under bearish pressure. Buy arrow appears at the floating bottom and sell arrow appears at floating top. Indicator allows to reverse signal types. Main indicator's adjustable inputs : mainTrendPeriod; signalTrendPeriod; smoothedTrendPeriod; tre
Trend speed vector - is the oscillator for manual trading. System measures trend direction and it's speed. Histogram shows 4 colors: Lime --> Strong up movement with good gain speed; Green --> Up movement with low gain speed Red --> Strong down movement with good gain speed; Orange --> Down movement with low gain speed Green and Orange histograms show weak market's movements and thуese places excluded from signal points. Buy arrow is plotted during strong down movement when bearish gain speed i
Floating gain meter is the manual trading system that works with local trends and it's scalping. Histogram represents  bull/bear floating trend gain. Green color histogram shows choppy market with bullish pressure, Orange - shows choppy market with bearish pressure. Lime and Red colors shows "boiled" places in market. As a rule buy arrow is placed after strong Down movement when it's power becomes weak and choppy market starts. And sell arrow is plotted after strong Up movement when it's power
Pullback points indicator - is the manual trading system, that shows most popular market prices. Indicator measures bull/bear waves pressure and looks for "consensus" prices. As a rule these points are crossed up and down very often and opened trade has several chances to be closed in positive zone. Mainly, such points is the good base for "common profit" types of strategies. Indicator also represents   "common profit"  scalping method of trading as default one.  Main Indicator's Features Signa
Noize Absorption Index - is the manual trading system that measures the difference of pressure between bears forces and bulls forces. Green line - is a noize free index that showing curent situation. Zero value of index shows totally choppy/flat market.Values above zero level shows how powerfull bullish wave is and values below zero measures bearish forces.Up arrow appears on bearish market when it's ready to reverse, dn arrow appears on weak bullish market, as a result of reverse expectation. S
Looking for EA to automate your trading strategy on the Forex market? TrendRocWaves Robot — your faithful companion in the world of trading! This 100% automated EA offers unique features: - works exclusively on high timeframes (H1 and H4) for confirmed response to market changes. - uses the most popular and liquid currency pairs such as EURUSD,GBPUSD with minimal spreads and fast transaction execution. - applies a scalping method based on a medium-term trend to achieve local goals and reduce r
Introducing the trading system Dynamic Trend Cycles Robot  — a powerful tool for H1-H4 trading with volatility pairs! Technical capabilities - pairs to trade : EURUSD,GBPUSD,XAUUSD;  - timeframes : M30,H1,H4; Why Choose Dynamic Trend Cycles Robot (DTC)? - Accurate Trend Analysis: DTC adapts to current market volatility, providing precise tracking of price trends. This allows you to confidently open positions in line with the main trend and maximize your profits. - Filtering False Signals: In t
Introducing to your attention an innovative expert advisor created specifically for the most juicy and volatility    currency     basket: GBPUSD and XAUUSD. This EA is designed using the main features of this market's movement, making it an ideal choice for dynamic trading on high-trending and medium-volatile pairs. The advisor is focused on minimizing trading risks, aiming to reduce losses to a minimum. Main features: EA is designed to open and close orders at the begginning of trading session
Introducing to your attention unique trading advisor, Squeeze roc xau points, exclusively designed for trading on the XAU/USD pair. We analyzed predominantly all objectively important timeframes and identified unique characteristics of gold movements relative to the dollar to create this product. These insights can be extremely useful in predicting market reversal points on timeframes from M30 to H8 for the XAU/USD pair. You can choose your favorite timeframe to receive signals or use multiple
Introducing to your attention the unique trading advisor "Scaled Vidya Trends", designed for dynamic scalp trading on trend volatility pairs hour timeframe. Main features of Scaled Vidya Trends: - EA works on H1 timeframe; - Uses the most popular currency pairs: EURUSD, GBPUSD, USDCAD. Brokers usually set one of the lowest spreads for these pairs; - Applies a scalping method based on local targets for orders; - Works at the close of the timeframe, waiting for signal confirmation. Signals works
Introducing to your attention a unique trading advisor "Detrended scalper jpy points robot", designed for trading with major JPY crosses. The idea is based on a modified indicator, detrended price oscillator, whose task is to eliminate the influence of the trend on price movements. This greatly simplifies the process of determining overbought/oversold cycles. The focus is on analyzing short cycles: long market cycles consist of several short ones. By analyzing the short components, we can more
Introducing the automated trading system "Flexi trend tracker robot" — a powerful instrument for hour+ timeframe trading with medium/soft volatility pairs! This EA offers unique features:  wide range of applications: This strategy can be used on various time intervals: H1 and H4 timeframes, making the trading advisor a highly versatile tool for trading.  the system works on comfortable USD crosses: USDCAD, USDCAD, and USDCAD pairs where you won't see overwhelming trends that wipe out deposits b
フィルタ:
レビューなし
レビューに返信