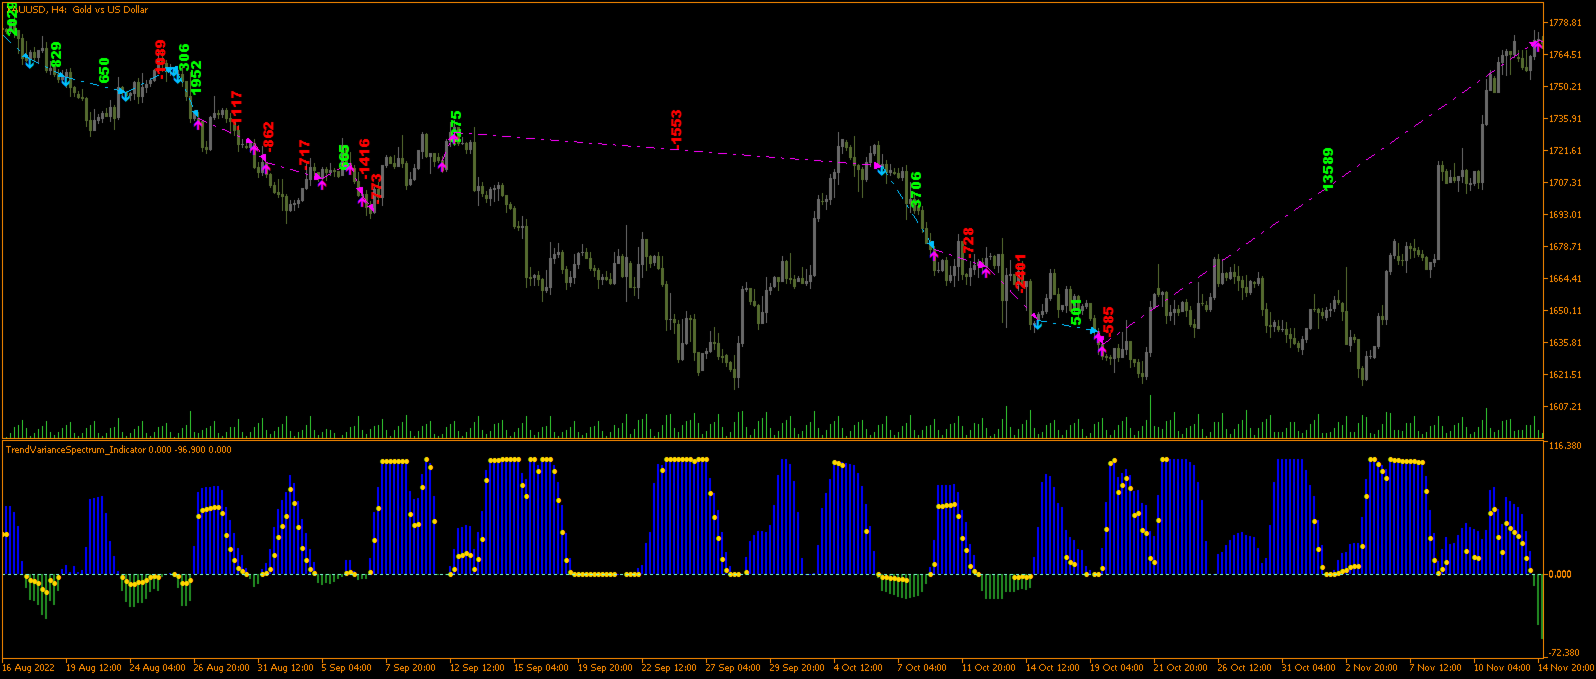
Trend variance spectrum indicator

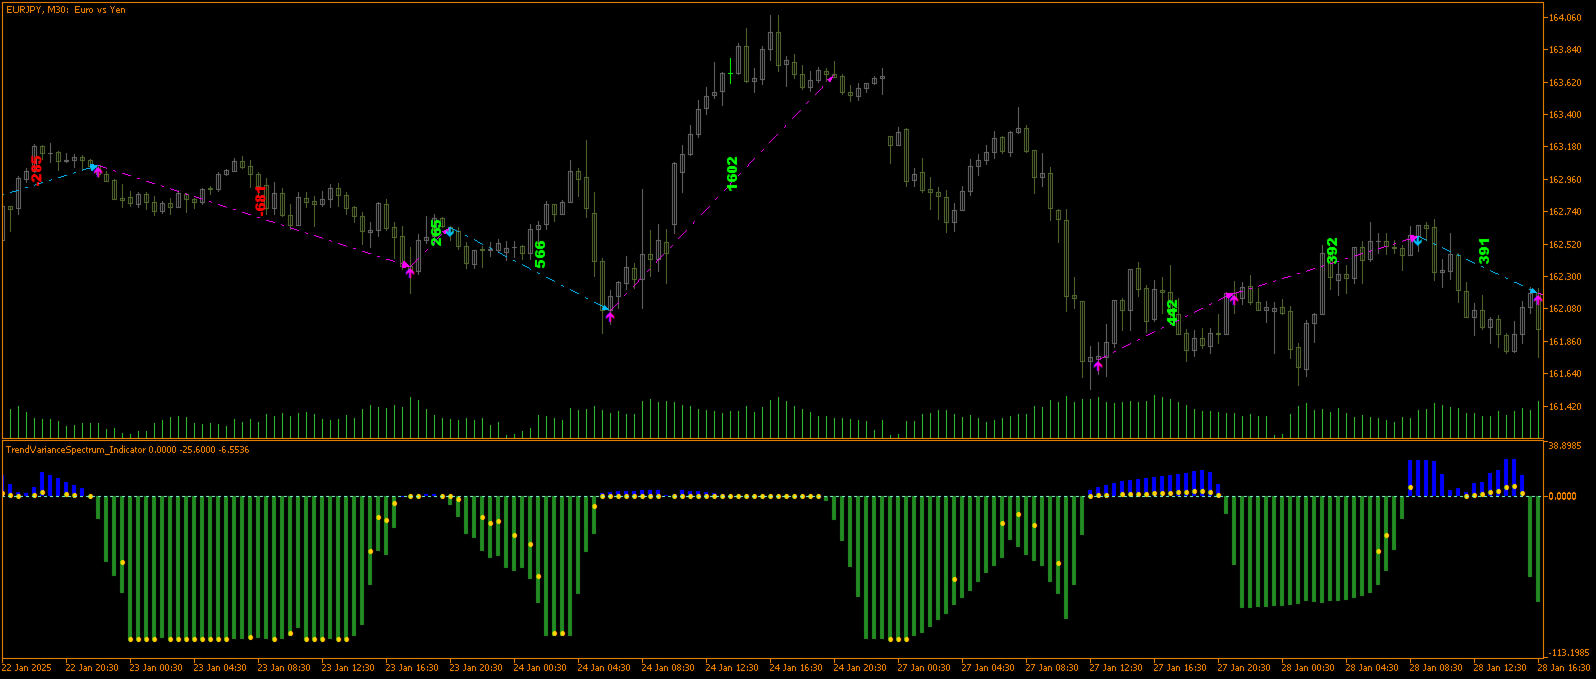
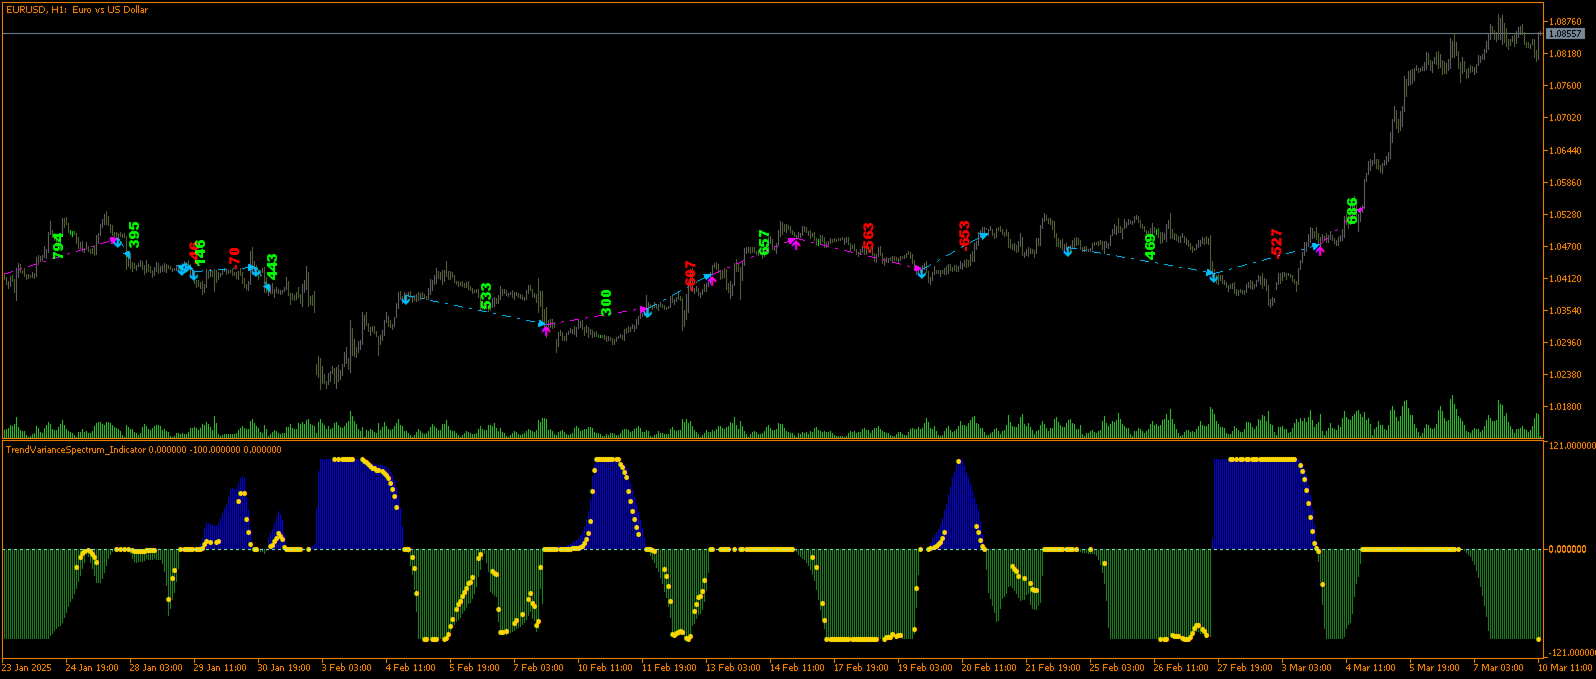
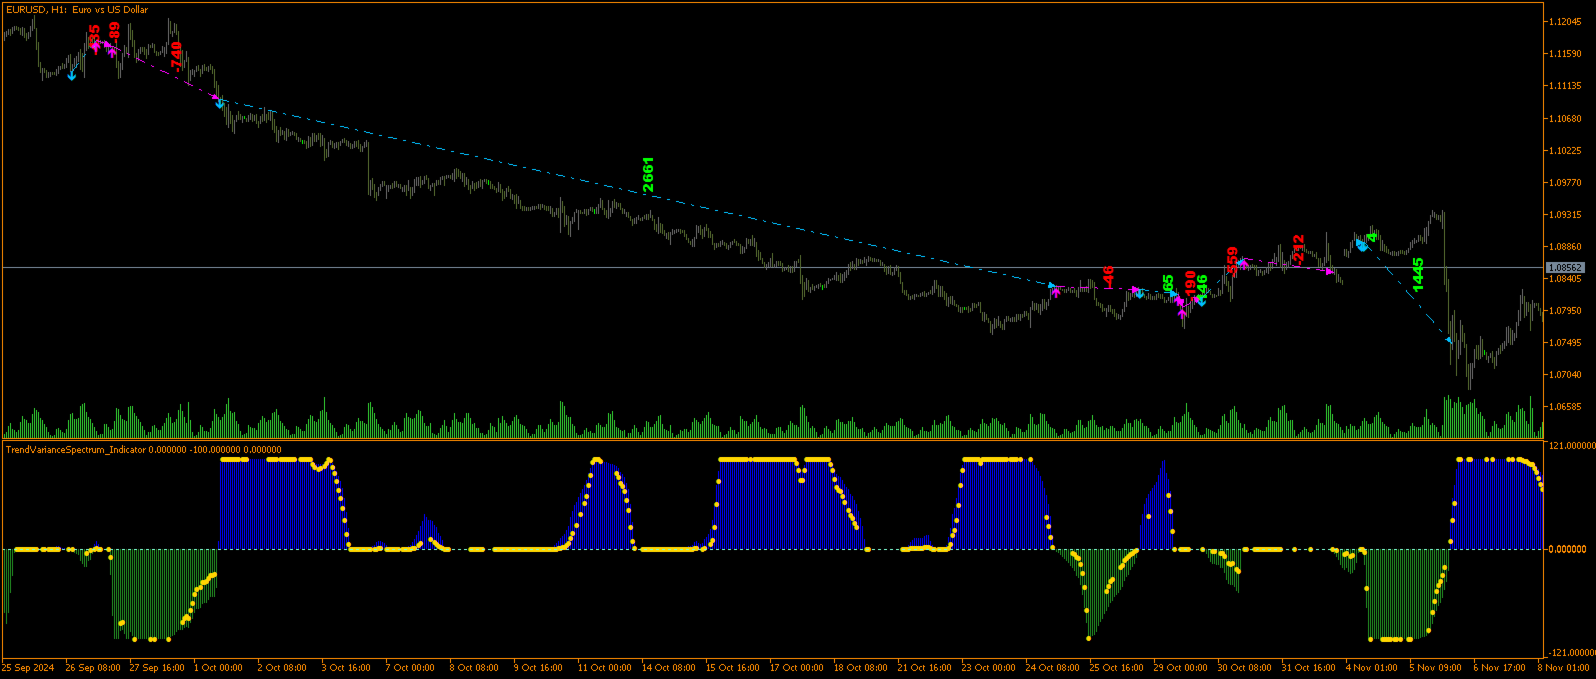
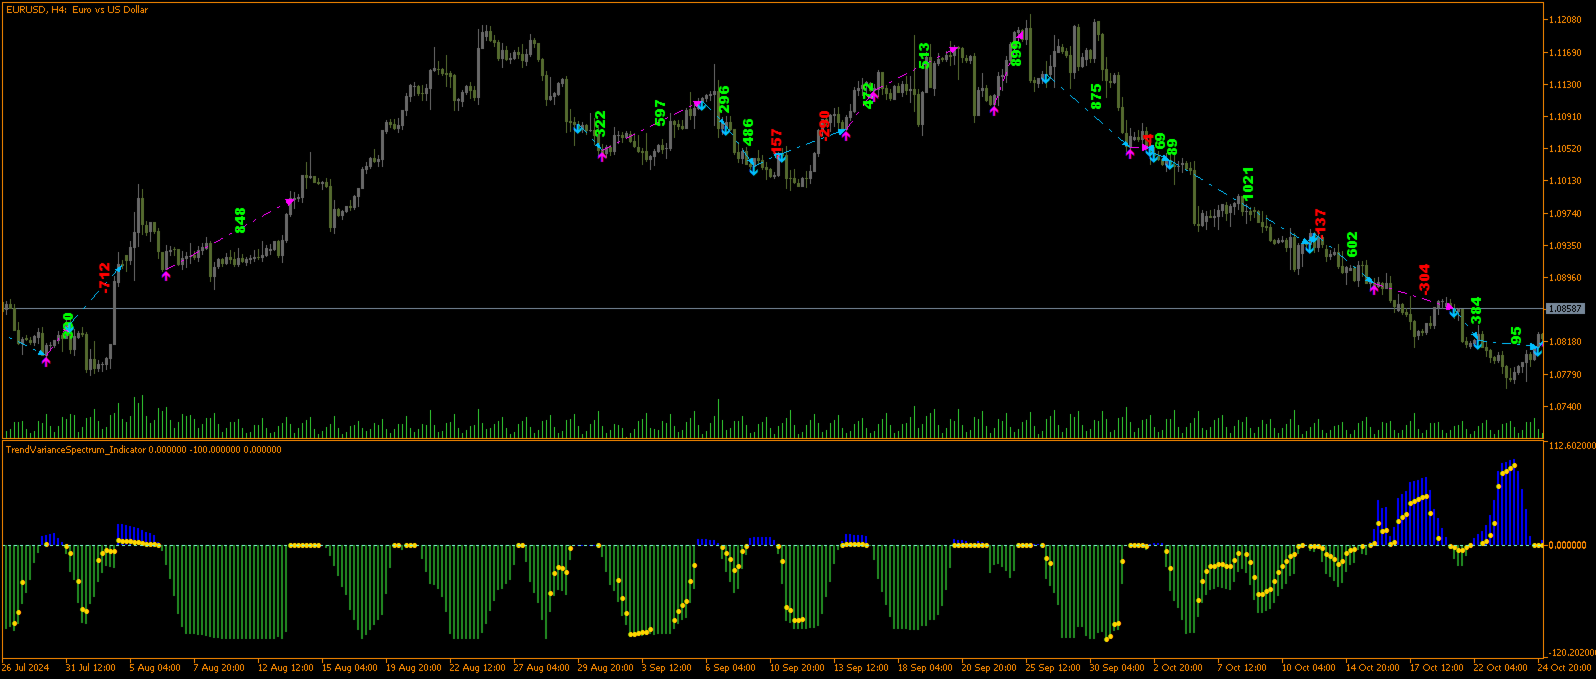
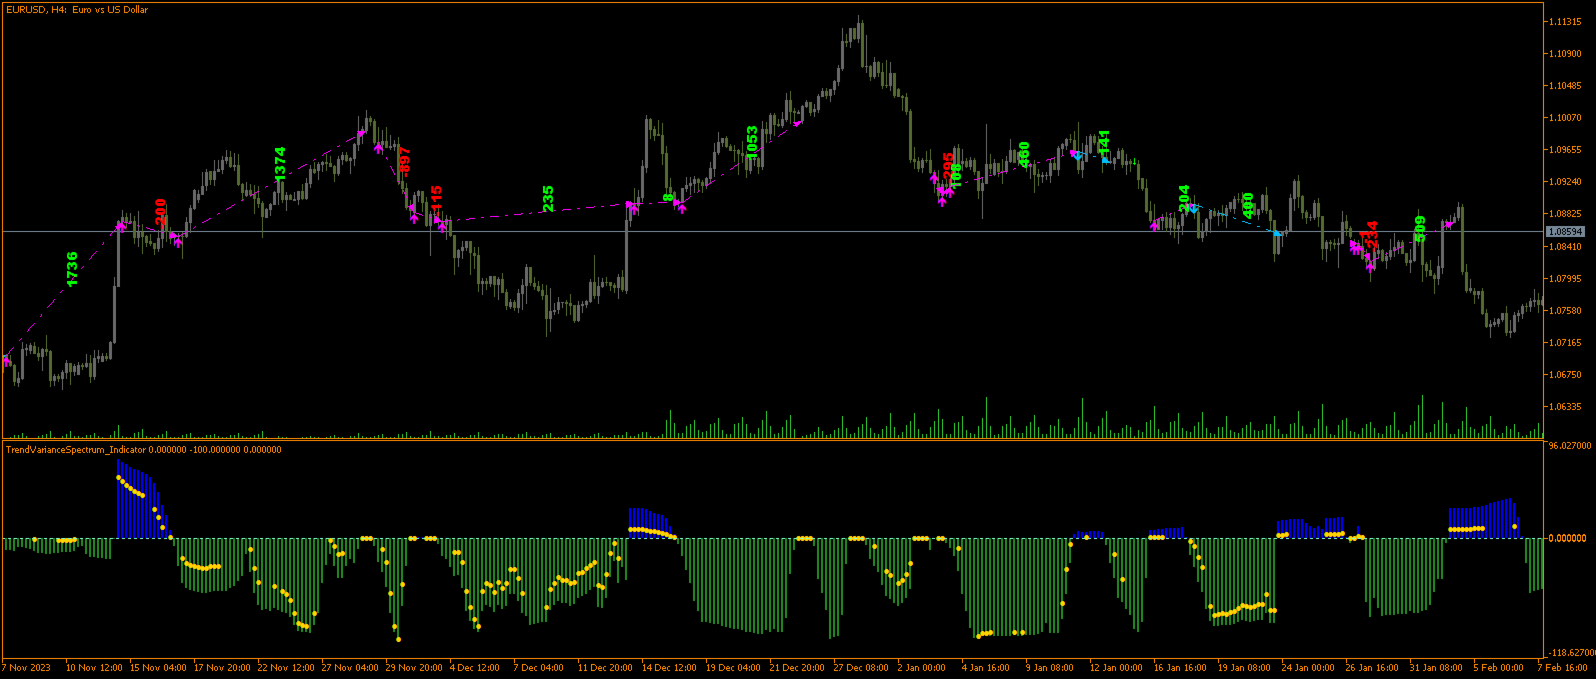
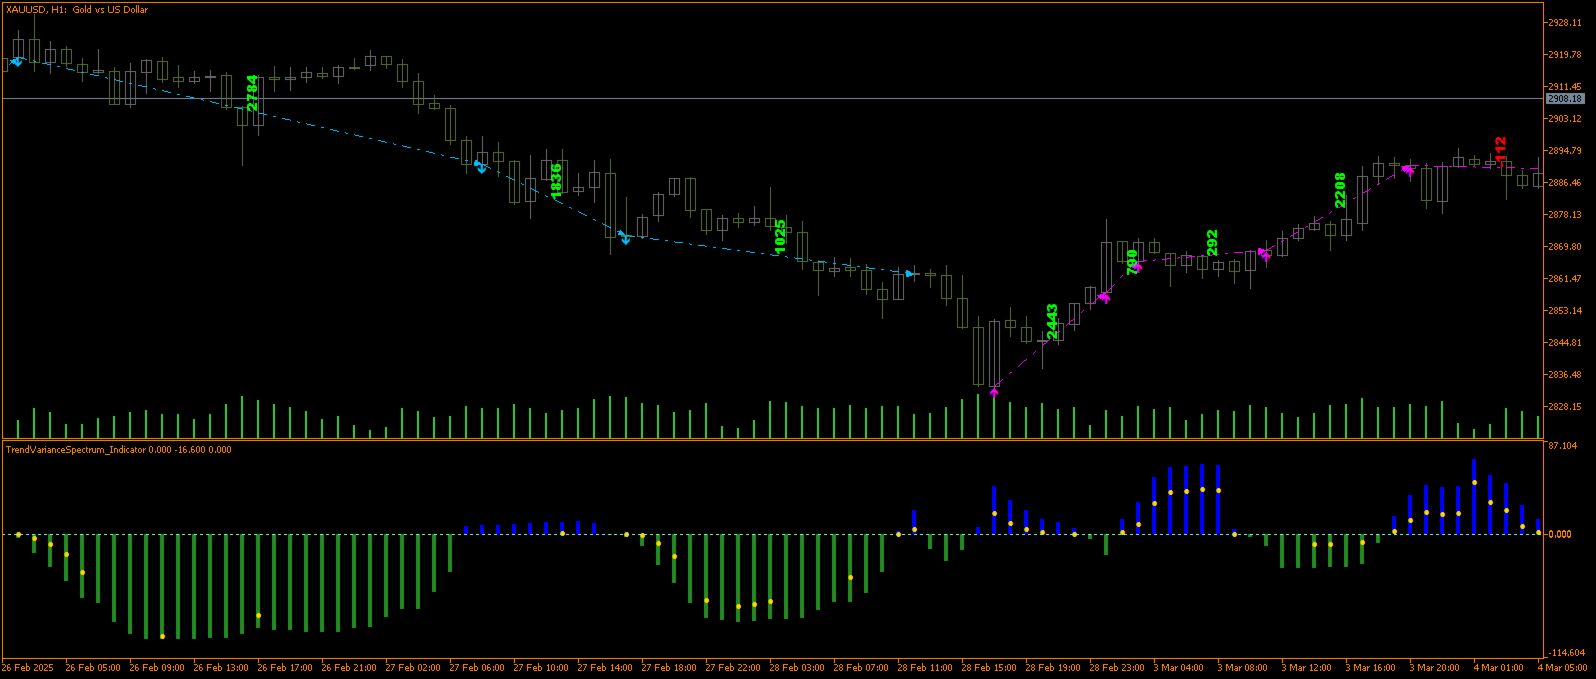
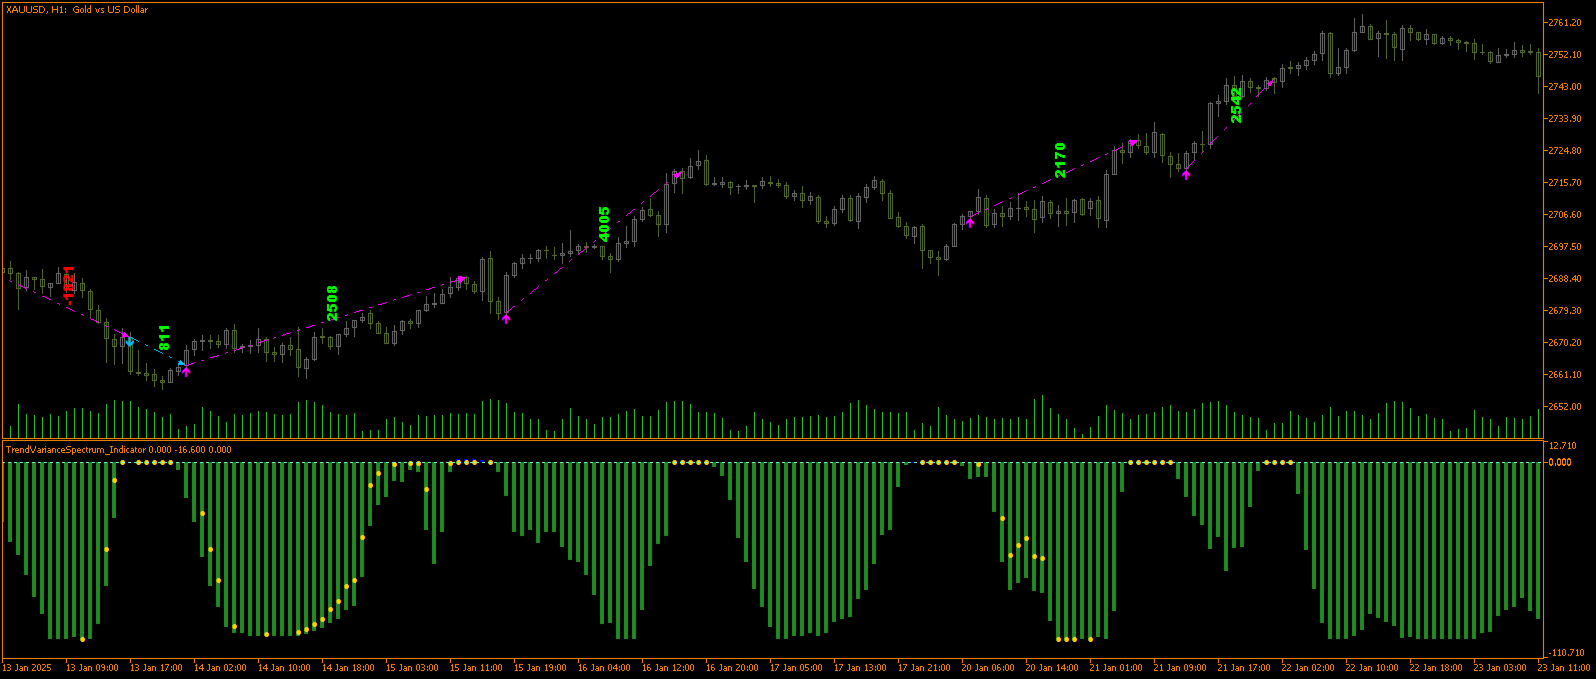
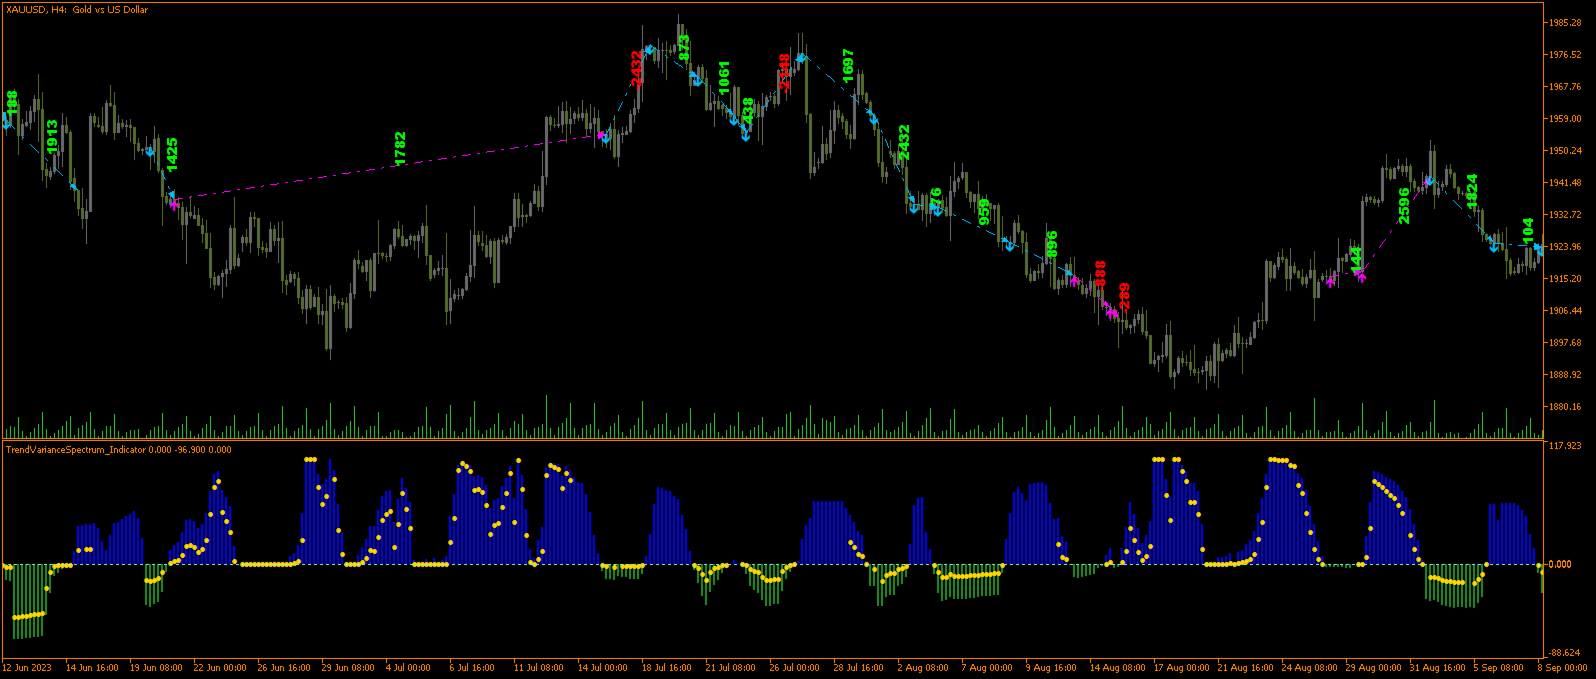
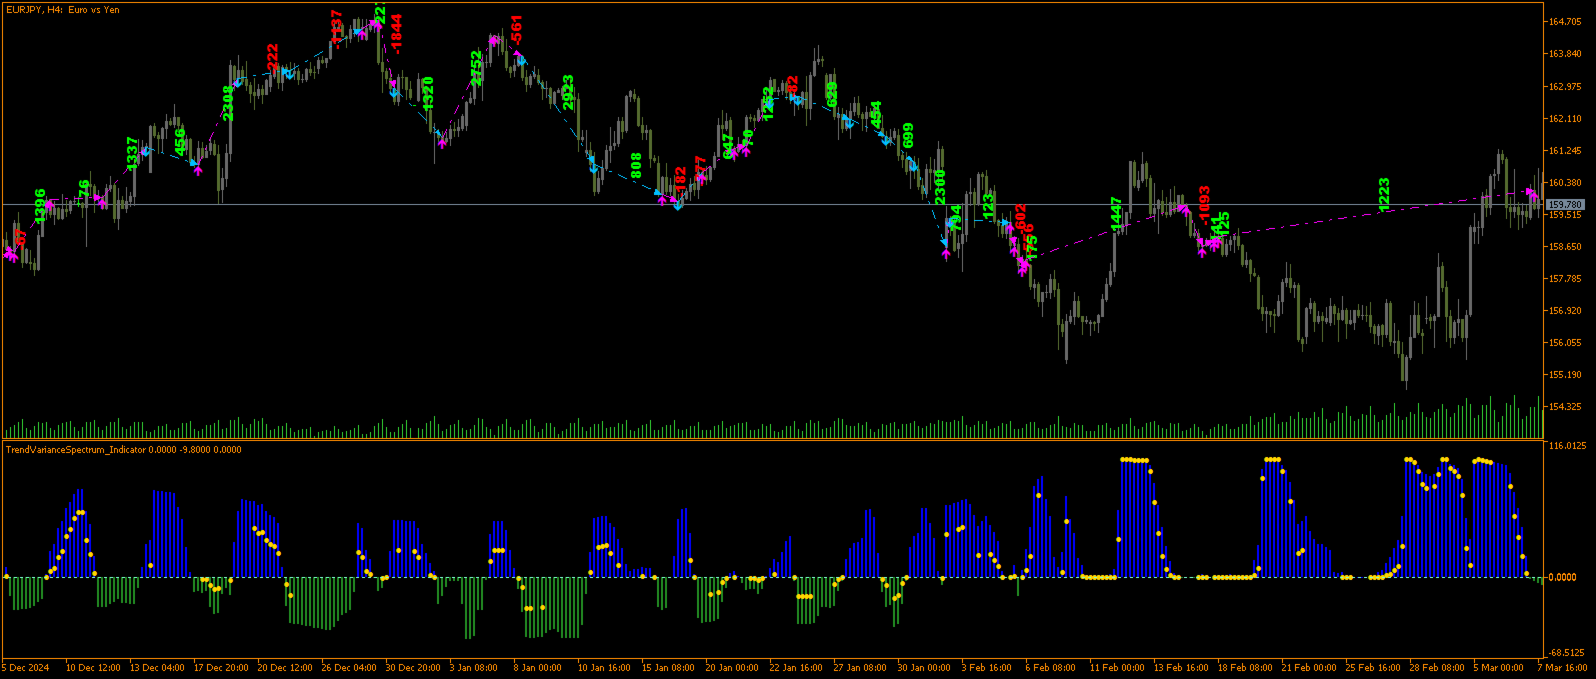
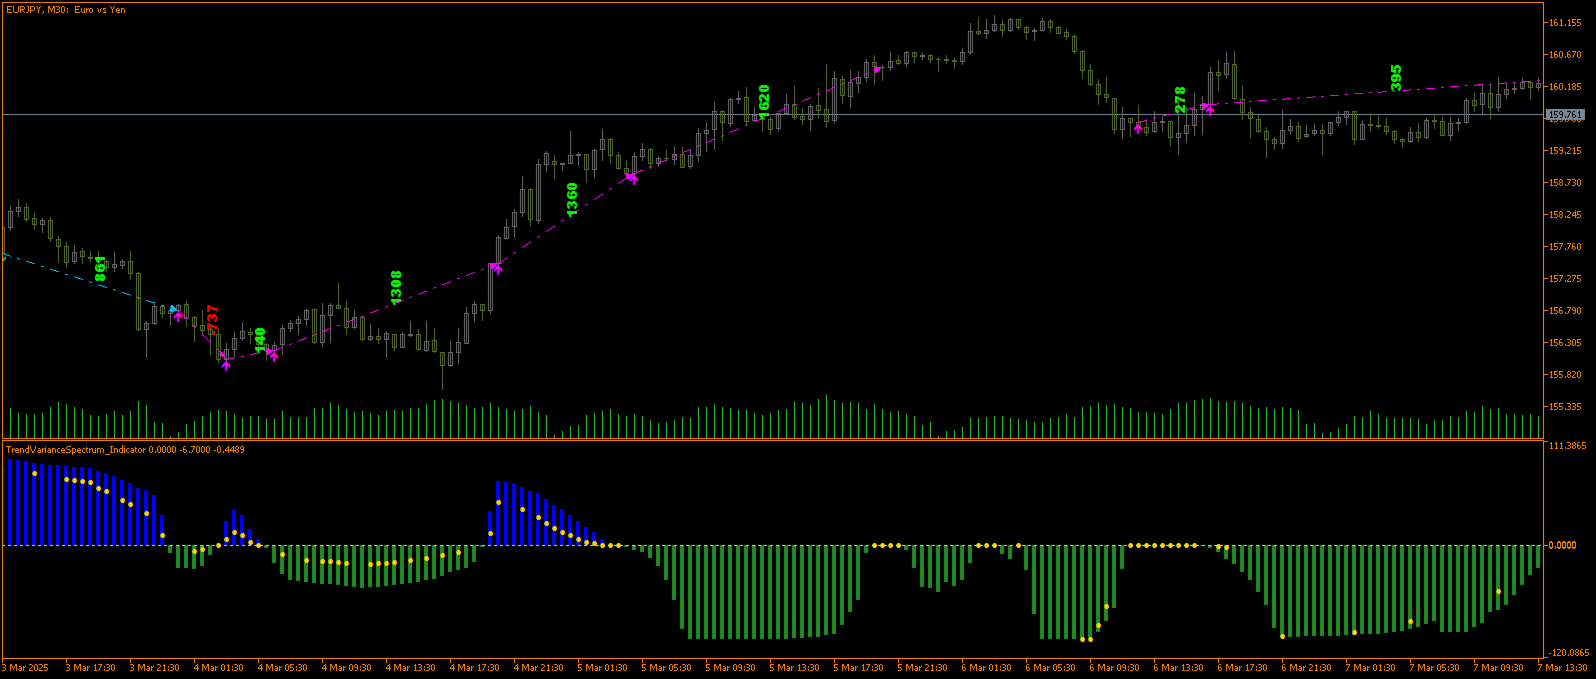
在交易世界中,每一个跳动都可能是一个新故事的开始,拥有一个可靠的盟友至关重要。TrendVarianceSpectrum 不仅仅是一个交易机器人;它是您在波动市场中的向导。凭借多年的经验构建,并在超过 25 年的数据上进行训练,它结合了数学的优雅与现代技术的力量。

TrendVarianceSpectrum 的主要优势:

  • 极低回撤:TrendVarianceSpectrum 以极低的回撤运行,使其成为最稳定的解决方案之一,适合重视可靠性的交易者。

  • 适应波动性:该系统在 EURUSD、XAUUSD 和 EURJPY 等具有挑战性的工具上表现出色,即使在高市场波动期间也能展现韧性。

  • 跨时间框架的多样性:无论是 M30、H1、H2、H3 还是 H4,TrendVarianceSpectrum 都能轻松适应您的交易风格。

  • 尖端技术:其核心结合了短期开盘方差分析与长期波动指标,能够精确识别市场入场点。

  • 数据驱动的可靠性:基于广泛的历史数据训练,该系统能够有效应对各种市场情景。

TrendVarianceSpectrum 不仅仅是一个工具;它是您的交易伙伴。它结合了精确性、稳定性和优雅性,让您在市场中的每一步都充满信心和深思熟虑。让自己享受每一个细节都为您精心设计的交易体验。TrendVarianceSpectrum 是您通往新视野的钥匙。

推荐产品
ElohimTrade Ultimate Confluence Pro — 全球最强大的多时间框共振指标 用 ElohimTrade Ultimate Confluence Pro 解锁您的交易潜能 —— 为追求精准、可靠与深度分析的交易者精心打造的技术分析巅峰工具。 这个尖端指标巧妙融合了多种领先技术指标的力量 —— EMA、RSI、MACD、布林带、随机指标(Stochastic)和 ADX —— 并在三个关键时间框(例如 M15、H1、H4)同时进行分析,生成清晰明确的共振得分,有效过滤市场噪音,捕捉最具盈利潜力的机会。 为什么要凭感觉交易,当您可以: 利用多时间框协同优势: 同时分析 M15、H1 和 H4 图表,以极高的准确度确认趋势和反转信号。 提升信号质量: 通过智能打分系统,结合多指标及多时间框确认,显著减少虚假信号。 实时推送提醒,领先一步: 接收即时视觉、声音提醒和手机推送通知,不错过任何重要交易时机。 可视化市场情绪: 在图表上显示的简洁交互面板,实时展示每个时间框的买入/卖出得分,不影响图表清晰度。 导出信号,深度分析: 将所有信号导出为 CSV 文件,方便外


在交易世界中,每一个跳动都可能是一个新故事的开始,拥有一个可靠的盟友至关重要。TrendVarianceSpectrum 不仅仅是一个交易机器人;它是您在波动市场中的向导。凭借多年的经验构建,并在超过 25 年的数据上进行训练,它结合了数学的优雅与现代技术的力量。 TrendVarianceSpectrum 的主要优势: 极低回撤 :TrendVarianceSpectrum 以极低的回撤运行,使其成为最稳定的解决方案之一,适合重视可靠性的交易者。 适应波动性 :该系统在 EURUSD、XAUUSD 和 EURJPY 等具有挑战性的工具上表现出色,即使在高市场波动期间也能展现韧性。 跨时间框架的多样性 :无论是 M30、H1、H2、H3 还是 H4,TrendVarianceSpectrum 都能轻松适应您的交易风格。 尖端技术 :其核心结合了短期开盘方差分析与长期波动指标,能够精确识别市场入场点。 数据驱动的可靠性 :基于广泛的历史数据训练,该系统能够有效应对各种市场情景。 TrendVarianceSpectrum 不仅仅是一个工具;它是您的交易伙伴。它结合了精确性、稳定性和优雅性
Ind2tompson
Vasilii Luchnikov
NewTest https://backoffice.aurum.foundation/u/DHXP1U 2indtompson指标是一个指标,用于比较两种工具,用于确定交易量,用于平衡配对交易或套利交易,从模拟版本准备的MT4终端。 所以,如果你需要比较多少两种工具将权衡,你不知道如何做到这一点,然后把一个指标图表上,它会自动计算所需的平衡量。 此外,该指标显示相对于彼此的工具的状态-发散/收敛。 https://youtu.be/kgbIgnujuAM 建议在M5/M15/H1时间框架上使用它 通讯联系人777basil@mail.ru 根据您的技术任务,我们将编写、制造、返工和更正ea/指标/脚本。 多謝。. 建议在M5/M15/H1时间框架上使用它 通讯联系人777basil@mail.ru  根据您的技术任务,我们将编写、 制造、返工和更正ea/指标/脚本。 多謝。.
FREE
Double Blow Scalping EA: An Innovative Advisor for MT5, Inspired by Quantum Technologies - Limited Edition!!! Description: Double Blow Scalping EA is a revolutionary trading algorithm for MetaTrader 5 that combines advanced principles of quantum computing and scalping strategy. His work is based on a unique imitation of qubits, the key elements of quantum computers that allow processing multiple market scenarios simultaneously. This gives the Expert Advisor unprecedented analysis speed and acc
Jesus Cross alert
Damion Richardo Richards
JESUS CROSS Indicator by Damion Description: The MA Crossover indicator is designed to alert traders when two moving averages cross on a 30-minute chart. It uses a Fast Moving Average (10-period) and a Slow Moving Average (21-period) to detect crossovers, which are commonly used as signals for potential trend changes. Key Features: Fast and Slow MA : The indicator employs a 10-period Fast Moving Average (FastMA) and a 21-period Slow Moving Average (SlowMA). Customizable Settings : Users can req
PHantom N1
Sofya Tselishcheva
PHantom N1 EA – 具备视觉化市场处理功能的智能专家系统 PHantom N1 基于数据驱动的方法开发,并在多年的历史市场数据基础上进行训练。 开发环境涵盖真实价格波动、波动性阶段、结构性市场变化及外部影响。不仅使用了 传统的技术指标,还结合了多模态数据流 —— 包括图表形态、K线组合以及订单流数据。 目标是开发出一种不仅能识别市场动态,还能预测市场走向的模型。 PHantom 持续学习并根据新的市场状况进行调整 —— 无需依赖于固定的硬编码规则。 价格将根据已售许可数量持续上涨 1. 市场视觉识别能力 PHantom N1 EA 的一大特色是具备捕捉当前市场状况的视觉快照能力。此视觉处理方式模拟人类的图表分析行为: EA 定期生成高质量的图表截图或图像数据,并通过 AI 图像识别系统进行分析。 这种视觉化方式使 PHantom N1 能识别出常见图形形态,如支撑/阻力区、价格形态以及突然的突破, 类似经验丰富的交易者所看到的,但频率更高且没有情绪干扰。 2. 基于 GPT-5.1 的双重 AI 验证 视觉收集的信息会经过第二层验证 —— 由语言模型 GPT-5.1 进行
SPECIAL LAUNCH OFFER: $30 (1-Month Rent) Limited time offer to build our community and gather feedback! AmbM GOLD Institutional Scalper A high-precision M5 algorithm for XAUUSD (Gold) , engineered to trade exclusively at Institutional Liquidity Levels ($5/$10 psychological marks). PERFORMANCE DATA (BUY ONLY) • Win Rate: 87.09%. • Safe Growth: +$4,113 profit on $10k (13.75% Max Drawdown). • Extreme Stress Test: Successfully generated +$22,997 in a 5-year stress test (2020-2026), proving
XAU Hedgify 投资组合守护者 是一款专业的风险管理工具套件,专为需要机构级保护的交易者设计,适用于他们的 MetaTrader 5 账户。与标准的保护系统不同,本系统利用定量波动率模型和多层触发矩阵,为您的投资组合抵御市场异常、新闻冲击和执行失败。 该系统充当“金融哨兵”,监控您账户健康状况的每一个方面——从浮动盈亏、权益快照,到可用保证金和点差质量。它特别针对高波动性资产(如黄金 XAU)进行了优化,但同样兼容所有交易品种。 核心优势 通用矩阵防护:一套全面的规则集,包含超过30个反应式触发器,监控浮动盈亏、绝对与相对权益、可用保证金、价格屏障以及每日表现。 定量波动率护盾:采用三倍标准差(3-Sigma)和 ATR 逻辑,根据当前市场噪声动态调整保护阈值。 多 tick 验证:每个紧急触发条件都会在连续三个 tick 上得到确认。这可以防止因临时点差飙升或 broker 的错误报价而导致的虚假平仓。 相对快照监控:引擎在初始化时捕获您的账户状态,允许您根据起始余额或权益的百分比变化来设置保护规则。 机构级执行:解耦的交易逻辑确保紧急对冲或平仓操作具备高频重
Horizontal volume bars, Cluster analysis, Volume profile Volume in Range gets information about the accumulated volume in a specified vertical range and period in bars. The received data is then plotted on the chart as rectangular boxes with the volume quantity inside. Usage:- The tool acts as a support resistance levels but most importantly it should be used to check in which direction the price breaks out of the significant levels formed by this indicator and then actions to be taken on correc
BTC Master Pro
Farzad Saadatinia
4.58 (12)
BTC Master Pro —— 您值得信赖的比特币纪律化交易伙伴。 全新版本现已集成 OpenAI 人工智能技术 ,在高波动的加密市场环境中,实现更智能的执行与更精准的交易过滤。 本专业级交易机器人专为 Bitcoin (BTCUSD) 在 MetaTrader 5 平台上的交易而设计,专注于结构化执行、风险暴露控制以及智能化风险管理。 当前价格: $499  →  下一阶段: $699  →  最终价格: $999 LIVE SIGNAL HERE 基于 OpenAI 的执行过滤系统 最新版本集成 OpenAI 技术,用于实时分析市场环境并过滤低质量或弱势交易信号。 AI 安全层(AI Safety Layer): 人工智能模块作为交易执行前的第二层审核机制。其功能严格限定为执行过滤工具(而非市场预测工具)。每一笔交易都必须通过结构化逻辑与智能验证流程,以减少不必要的回撤并避免低质量入场。 为什么选择 BTC Master Pro? 加密货币市场——尤其是比特币——具有高度波动性。情绪化决策往往导致不稳定的交易结果。本系统旨在帮助交易者在快速市场变化中保持结构化、纪律性与
Caicai L&S Yield Histogram Important Notice: This indicator is an integral tool of the automated EA Caicai Long and Short Pair Trading . This indicator visually displays the percentage deviation (Yield %) of a pair's current spread relative to its own historical mean. It is an excellent tool for quickly visualizing the gross financial potential of a market distortion in Long & Short operations. Main Features: Percentage Visualization: Understand the size of the distortion in palpable percentage
Fakeouts
TECHAURORA - FZCO
Advanced Fakeout Detection Indicator   Professional Liquidity Sweep & Market Structure Analysis for MetaTrader 5 The Advanced Fakeout Detection Indicator is a sophisticated technical analysis tool designed to identify high-probability market reversal opportunities by detecting liquidity sweeps and structural breaks in price action. What This Indicator Does This indicator automatically identifies and visualizes potential fakeout scenarios where price temporarily breaks through significant level
Mzr Manager EA
Moh Mirza Yusuf Humaedy
Mzr FUND MANAGER EA V8 is a professional-grade automated trading system engineered for traders who prioritize capital preservation, controlled growth, and institutional-style risk management . Unlike aggressive martingale robots that expose accounts to catastrophic losses, this EA is built around a Fund Manager Logic , focusing on: Smart dynamic risk adjustment Daily drawdown protection Adaptive lot sizing Liquidity sweep confirmation ATR-based precision stoploss/takeprofit Break-even and traili
Outro
Manuel Gonzales
5 (3)
" Outro " is an expert in automated " multi-symbol " trading that requires the trader to test on the pair of his choice and modify the entries according to his convenience. This Expert Advisor has been designed with non-optimized inputs, and   uses a Martingale system   for risk management. It is very important to read the   blog   post before you start. Enter to the private group .  Outro   uses two main indicators,   Relative Strength Index and Stochastic Oscillator , for input decision making
FREE
TPO Profile MT5
Kyra Nickaline Watson-gordon
Definition : TPO is a Time Price Opportunity. Instead of using bars or candles with an Open, High, Low, and Close price, each "bar" in a Market Profile is represented by horizontal bars against the price It is called Market Profile terminology. In other words time-price-opportunity (TPO) profiles are histograms of how much time was spent at each price within the span of the profile. By using a TPO chart, you are able to analyze the amount of trading activity, based on time, for each price level
Equinox Gold
Dmitriq Evgenoeviz Ko
Equinox Gold is a high-tech trading expert advisor (EA) specifically designed for the gold market ( XAUUSD ). The system is based on a unique Market Equilibrium algorithm that identifies areas of imbalance between supply and demand during extreme volatility. Unlike most robots that use dangerous sit-and-wait methods, Equinox Gold relies on mathematical momentum confirmation and strict risk control for every trade. MAIN ADVANTAGES VRP Filter (Volatility Range Filter): The robot automatically ada
Tick Imbalance Bars
Henrique Helmuth Kreutz Pfeifer
Tick imbalance bars (TIB), described in the book Advances in Financial Machine Learning (2018) by Marcos López de Prado. Indicator that show candlestick bars with an different sampling method than time fixed. Real time data is sourced to the indicator and it may be used as substitute of the default graph. Each bar is formed when a predefined tick balance is exceeded, showing in the graph the OHLC of this cluster of ticks. The input variable is the amount of ticks of each bar. The indicator may
FREE
KT Horizontal Lines MT5
KEENBASE SOFTWARE SOLUTIONS
在MetaTrader中,绘制多个   水平线   并跟踪各自的价格水平可能非常麻烦。该指标可自动在等间距位置绘制多个水平线,用于设置价格提醒、标记支撑和阻力位以及其他手动操作。 这个指标非常适合刚接触外汇交易的新手,帮助他们寻找买卖机会并实现快速获利。无论市场处于趋势中还是震荡状态,水平线都能帮助交易者识别潜在的进出场区域。 功能特点 可根据输入参数中的预设,瞬间绘制多个水平线。 使用鲜明的色彩主题,区分不同的水平线。 是追踪多个交易时段价格区间的必备工具。 当价格触及某条水平线时会自动发出提醒。 可设置提醒之间的间隔,避免重复提醒造成干扰。 支持完全自定义设置。 说明 该指标根据输入参数中的配置自动绘制水平线。观察价格在这些水平线附近的反应,可以帮助识别关键支撑/阻力位附近的潜在交易机会。 例如,在水平支撑位形成一根看涨Pin Bar,通常意味着价格可能会继续上涨,朝最近的阻力位移动。 若价格以一根看跌K线收盘于支撑位下方,则可能表明刚刚发生了一个下行突破。而在水平线上发生的假突破,则说明价格未能突破关键水平,可能即将反转方向。 一些价格反转形态(如Pin Bar或假突破)对于
Nem Nem
Taha Saber Ashour Kamel
Nem Nem is super accurate mt5 indicator it is working with any pair any time frame it will show and provide you with high Winrate signal you can use for forex pairs , gold and any other pairs it is easy to use also you can see the white lines for starting and end of signals it will help you to read the chart and enter and make correct decisions in trades. also it  will be clear for you when to enter and exit from any trades
FREE
SynRhythmic Points Oscillator is an innovative manual trading system based on the combination of two analytical approaches, one focusing on short-term price changes and the other on identifying stable trends and dependencies. This synergy allows for obtaining excellent signals for entering the market while minimizing the influence of random fluctuations and reducing false signals. Additionally, the indicator can easily adapt to various market conditions and be automated, making it convenient for
FX-AIEA 供给需求区智能识别指标( Supply and demand indicators MT5 ) 版本:2.51   | 适用平台:MetaTrader 5  为什么交易需要供给需求区? 供给需求区是机构订单流的核心体现,比传统支撑阻力更精准地反映真实买卖力量。但手动绘制不仅耗时,而且主观性强、容易错过关键区域。 FX-AIEA 供给需求区指标   采用自适应 ZigZag 算法,自动识别高概率供需区域,并将它们以彩色矩形直观标注在图表上,让您一眼看清当前市场的“禁区”与“机会区”。 ️ 核心特性 全自动绘制 + 实时刷新 基于改良版 ZigZag 动态提取有效波峰波谷,精准定位潜在供给区(红色)与需求区(天蓝色)。 新 K 线自动更新 :指标使用 MQL5 原生   prev_calculated   机制,每出现一根新 K 线即重新计算并重绘区域,永远不会“卡住不刷新”。 支持手动刷新(双击图表或切换周期),确保数据始终同步。 灵活的时间框架 Forced_TimeFrame   参数 :可强制指标运行在任意周期(如小时图加载指标,但基于日线计
Stats Summary
Elidio Xavier Guimaraes
利用 Stats Summary 提升您的技术分析。 Stats Summary 是一款为 MetaTrader 5 (MT5) 开发的强大分析工具,可提供价格行为的详细统计概览。与传统指标不同,它使用描述性统计来描绘在可自定义的样本期内价格的分布情况。 通过定义样本大小,该指标会计算并在图表上显示以下值: 最小值和最大值 (Min/Max): 所选时间段的完整价格范围,显示达到的极值。 中位数 (Q2): 将数据集分为两个相等部分的值,代表价格运动的中心点。 第一四分位数 (Q1): 标记第 25 百分位数的值,表示 25% 的交易价格低于此点。 第三四分位数 (Q3): 标记第 75 百分位数的值,表示 75% 的交易价格低于此点。 这些四分位数对于识别大多数交易活动发生的“价值区域”特别有用,并且可以作为强有力的支撑和阻力位。对于寻求量化和数据驱动方法进行市场分析的交易者而言, Stats Summary 是一个功能强大的工具。
Prometheus Analyst
Humphrey Mangera
PROMETHEUS TECHNICAN VERSION Free | By THE SONS A gift from The Sons — no strings, no trial, no expiry. Every trader deserves access to professional-grade market intelligence. That belief is why Prometheus Technical Version exists, and why it costs nothing. Consider it our handshake to the trading community. What You're Getting This is not a simplified tool dressed up as a gift. Prometheus Technican Version is a fully built, institutional-quality technical analysis indicator running a dual-model
FREE
QuantumAlert RSI Navigator is a free indicator available for MT4/MT5 platforms, its work is to provide "alerts" when the market is inside "overbought and oversold" regions in the form of "buy or sell" signals. This indicator comes with many customization options mentioned in the parameter section below, user can customise these parameters as needful. Join our MQL5 group , where we share important news and updates. You are also welcome to join our private channel as well, contact me for the priva
FREE
Basic Volume Profile MT5
Mehran Sepah Mansoor
使用我们的 Metatrader 交易量曲线指标,探索交易量分析的威力!  /   MT4 版本 基本成交量曲线是专为希望优化交易的手动交易者设计的指标。对于任何希望更好地了解市场行为的严肃交易者而言,成交量曲线指标都是必不可少的工具。利用我们的创新解决方案,您可以清晰、简明地直观了解交易量在不同价格间的分布情况。这样,您就可以确定关键的关注区域,如支撑位和阻力位、累积区和分布区以及重要的控制点。与显示特定日期交易量的普通交易量指标不同,Basic Volume Profile 显示的是特定价格的交易量。 我们的指标具有直观和可定制的界面,让您可以根据自己的交易偏好进行调整。 特点 在价格图表上清晰显示成交量概况。 快速识别高低成交量活动区域。 完全自定义颜色和样式,以适应您的交易风格。 支持多时段综合分析。 专门的技术支持,确保体验顺畅。 配置参数 指标设置 Number of histograms:   要显示的成交量条数 Profile position:     是否希望在第一根蜡烛或侧面显示成交量曲线 Color mode:     是否希望将成交量曲线分为看涨/看
GoldenFinger MTG  by MidasAlgo  Download the demo of GoldenFinger MTG EA today, then  grab this new release special offer before it expires after 10 purchases to RENT it for just 1 month at only $30/month(N.P.$88.88) – the LOWEST price you can get from MidasAlgo products! This exclusive deal allows investors to  test its robust performance on both DEMO and LIVE accounts before making any further purchase!   REALISTIC GROWTH, NOT HYPE Forget the fantasy results other EAs show. GoldenFinger fo
High Low Open Close
Alexandre Borela
4.98 (44)
如果你象这个项目一样,就有5个饥饿审查。 这项指标采用了既定价格的公开、高、低价和关闭价格 可以对特定时间区加以调整。 许多机构和专业人士都认为这些是重要的。 贸易商可以为你了解他们可能更进一步的地点, 积极。 现有期间为: 前一日。 前一星期。 曾任Month。 曾任。 前一年。 或: 目前日。 目前周。 目前 Month。 目前配额。 今年。
FREE
Neopips Engine EA
Md Billal Hossain
NeoPips Engine EA – 终极交易革命已然到来! “交易的真正力量在于洞察他人所忽略的。NeoPips Engine 不随波逐流,而是掌控市场。” 关于 NeoPips Engine EA:您的智能交易盟友 NeoPips Engine EA 并非普通的交易机器人。它是一款多维度、AI 优化的专家顾问,专为追求精准度、适应性和长期表现的交易者打造。 与那些规则僵化的过时机器人不同,NeoPips Engine 是一种动态策略——它会实时思考、学习并适应市场。 这不仅仅是自动化,更是一场持续的进化。 更上一层楼的智能:让您自由发挥的核心功能 人工智能决策 动态模式识别 预测趋势分析 基于实时数据的智能进出逻辑 多引擎策略核心 – 四种模式,同一个目标:赢。 NeoPips 引擎会根据实时信号自动切换引擎: 剥头皮模式 – 捕捉快速波动的爆发 波动模式 – 瞄准长期趋势阶段 突破模式 – 在重大经济新闻发布时激活 ️ 安全守护模式 – 在市场波动时介入 效果:无缝过渡,在所有市场阶段
SMC Venom 模型 BPR 指標是針對在智慧貨幣 (SMC) 概念內工作的交易者的專業工具。它會自動辨識價格圖表上的兩種關鍵模式: FVG (公平價值缺口)是三根蠟燭的組合,其中第一根和第三根蠟燭之間存在缺口。它在水平之間形成一個沒有成交量支撐的區域,這通常會導致價格調整。 BPR (平衡價格區間)是兩種 FVG 模式的組合,形成一個「橋樑」 - 當價格以低成交量活動移動時,突破並返回到水平的區域,從而在蠟燭之間產生間隙。 這些模式可協助交易者透過分析圖表上的交易量和價格動態(大型市場參與者和普通參與者之間的互動)來識別關鍵的支撐/阻力位、突破區域和切入點。 此指標以矩形和箭頭的形式可視化模式,也支援靈活的警報設定。 主要特點: 模式顯示模式:選擇顯示 BPR 模式(看漲和看跌)或 FVG 模式(看漲和看跌)。 可以隱藏所有圖表分析模式。 以條數過濾:BPR 結構中 FVG 之間的最小/最大距離。 訊號的附加視覺化: 箭頭有 9 種類型可供選擇(標準、細、分形等)或手動輸入 Wingdings 代碼,其表格可以選擇性地顯示在圖表上。 設定顏色、尺寸及其縮放時相對於價格的動態
Meridian Edge Gold
Ignacio Agustin Mene Franco
MERIDIAN EDGE v1.0 — Institutional Series Worldinversor 2026 | Expert Advisor for MetaTrader 5 Meridian Edge v1.0 is an institutional-grade Expert Advisor that combines artificial intelligence, advanced quantitative analysis, and structural market recognition in a single autonomous execution engine. Designed for demanding traders seeking consistency and operational robustness. Artificial Intelligence Engine The core of the system integrates a bidirectional BiLSTM (Bidirectional Long Sho
该产品的买家也购买
ARIPoint
Temirlan Kdyrkhan
1 (1)
ARIPoint is a powerful trading companion designed to generate high-probability entry signals with dynamic TP/SL/DP levels based on volatility. Built-in performance tracking shows win/loss stats, PP1/PP2 hits, and success rates all updated live. Key Features: Buy/Sell signals with adaptive volatility bands Real-time TP/SL/DP levels based on ATR Built-in MA Filter with optional ATR/StdDev volatility Performance stats panel (Success, Profit/Loss, PP1/PP2) Alerts via popup, sound, push, or email Cu
MetaTrader 5 智能多层突破与回调探测器 "智能 · 简单 · 快速!" 您是否厌倦了错过高概率的突破入场机会? 您是否花费数小时扫描多张图表,试图将突破与趋势方向和货币动能对齐——却仍然错过了行情? Break Pullback 用一个指标解决所有这些问题。 什么是 Break Pullback? Break Pullback 是一款专业级 MetaTrader 5 指标,专为交易市场结构、突破和趋势延续形态的交易者而设计。 它能实时自动检测多个货币对的突破与回调形态——并通过三层确认过滤每个信号: 结构突破检测——识别图表上的关键突破位 高时间框架日线偏向——将入场与主导日线趋势方向对齐 货币强弱指数——确认配对货币间的动能失衡 结果:更少的虚假信号,更强的信心,更快的执行——无需面对图表过载。 适合哪些交易者? Break Pullback 专为使用以下方法的交易者设计: 突破与回测策略 市场结构分析(BOS、 OB Order Block 、结构位) 聪明钱概念(SMC)或 ICT 风格入场 趋势跟踪与延续形态 跨外汇和黄金(XAUUSD)的多对扫描 日内和波段
ARICoins
Temirlan Kdyrkhan
ARICoin is a powerful trading companion designed to generate high-probability entry signals with dynamic TP/SL/DP levels based on volatility. Built-in performance tracking shows win/loss stats, PP1/PP2 hits, and success rates all updated live. Key Features: Buy/Sell signals with adaptive volatility bands Real-time TP/SL/DP levels based on ATR Built-in MA Filter with optional ATR/StdDev volatility Performance stats panel (Success, Profit/Loss, PP1/PP2) Alerts via popup, sound, push, or email Cust
OmniSync Projection
Antonio-alin Teculescu
5 (1)
Chronos Fractal Engine is an innovative price projection indicator for MetaTrader 5, designed to transform your technical analysis by intelligently identifying and projecting historical price patterns. Built upon an advanced correlation algorithm and the fractal principles of the market, this powerful tool visualizes potential future price movements, giving you a unique edge in your trading decisions. What is Chronos Fractal Engine? At its core, the Chronos Fractal Engine employs a sophisticat
AriX
Temirlan Kdyrkhan
1 (4)
AriX Indicator for MT5 A powerful trend-following and signal-evaluation tool AriX is a custom MT5 indicator that combines Moving Averages and ATR-based risk/reward logic to generate clear buy/sell signals. It visualizes dynamic SL/TP levels, evaluates past trade outcomes, and displays win/loss statistics in a clean on-chart panel. Key features include: Buy/Sell signals based on MA crossovers ATR-based SL/TP1/TP2/TP3 levels with visual lines and labels Signal outcome tracking with real-time stat
CGE Trading Suite
Carl Gustav Johan Ekstrom
5 (2)
Institutional-Grade Analytics for MT5 C GE Trading Suite delivers the analytical edge typically reserved for professional trading desks. The platform integrates a full suite of analytical tools into one seamless workflow: dynamic grid mapping, liquidity behavior analysis, ECM, trend lines, MIDAS, trade cycles, and directional channel projections. Together, these provide a unified view of market structure and momentum. Directional clarity is further enhanced by the capital flow index, which meas
Meravith MT5
Ivan Stefanov
5 (1)
做市商工具。 Meravith 将: 分析所有时间周期并显示当前正在运行的趋势。 标注流动性区域(成交量均衡区),即多头与空头成交量相等的位置。 在您的图表上直接显示来自不同时间周期的所有流动性水平。 生成并展示基于文本的市场分析供您参考。 根据当前趋势计算目标位、支撑位和止损位。 计算交易的风险回报比。 根据您的账户余额计算仓位大小,并估算潜在利润。 在市场出现重大变化时,Meravith 还会发出警告。 指标的主要线条: 多头/空头成交量衰竭线 —— 作为目标位使用。 趋势线 —— 指示市场趋势方向。根据市场是多头还是空头而改变颜色,并作为趋势支撑。其颜色主要反映市场情绪。 成交量均衡线(Eq)—— Eq(Volume Equilibrium)是系统的核心。它表示买卖双方成交量的平衡点,即市场流动性所在位置。向上突破 Eq 表示多头倾向,向下突破 Eq 表示空头倾向。突破后,应等待回调——当价格回到相反趋势的偏离线或衰竭线附近时。 使用方法:只需将其添加到图表中。 Meravith 可以分析一切——趋势和回调。 趋势线与某条成交量衰竭线之间的距离越大,说明该方向的成交量越高。 趋势
Big Player Range
Thalles Nascimento De Carvalho
5 (3)
BigPlayerRange — 适用于沪深300和美元人民币的最佳MT5指标 探索 BigPlayerRange 的强大功能,它被认为是用于 沪深300、上证指数、USD/CNH 等资产的 MetaTrader 5 最佳指标 。该工具能精准识别机构主力的关键区域,帮助交易者进行高精度的技术分析。 指标工作原理: BigPlayerRange 绘制两个水平区域,通过成交量分析反映市场能量: 绿色区域 :买方防守位置,支撑价格。 红色区域 :卖方压制位置,形成阻力。 使用策略: 收盘价突破绿色区域上方 :可能开启上涨趋势,目标为上方区间。 收盘价跌破红色区域下方 :暗示下跌压力增强,目标为下方支撑。 价格停留在区间内 :行情震荡,等待突破信号。 核心优势: 机构活动区域识别 :提前发现主力进出场信号。 自动计算的目标价格 :提供两个明确的止盈位置。 回调概率分析 :优化风险控制,提升稳定性。 参数个性化设置: 自定义交易时间与成交量类型(Tick或真实成交量)。 使用机构逻辑提升日内交易效率。 推荐搭配
Assembler
Darko Licardo
5 (1)
Introducing Assembler:  The best value for money,  Designed for advanced traders and professionals, yet accessible for ambitious beginners ready to elevate their trading game. Great for ICT, SMC, TREND and breakout traders . Combining advanced analytics, a sleek graphical interface, and highly customizable features, Assembler empowers you to trade with precision, clarity, and confidence. Key Features of Assembler 1. Dynamic Graphical User Interface (GUI): A fully draggable, customizable interf
Gold Xausd Hunter
Metin Erkamoglu
5 (1)
MATADOR GOLD XAUUSD M5 Scalp Signals for MT5 MATADOR GOLD is a decision-support indicator for MetaTrader 5, designed for traders who analyze short-term Gold movement on the M5 timeframe. The indicator does not open, close, or manage trades automatically. It provides buy and sell signal guidance so the user can make their own trading decisions according to their risk plan, broker conditions, and trade management rules. Main purpose MATADOR GOLD is built to help traders avoid noisy signal flow and
Transaction Speed MT5
Ivan Stefanov
5 (3)
当然,以下是翻译成中文(简体)的版本: 该指标标出市场中显现出 交易兴趣 的区域,并随后显示 订单积累区域 。它的工作方式类似于大规模的订单簿。 这是为 大资金 打造的指标,性能卓越。市场中有任何兴趣,你都能通过它清晰看到。 (这是一个 完全重写的自动化版本 —— 不再需要手动分析。) 交易速度 是一个全新的概念指标,它显示了市场上大订单 何时 、 何地 聚集,并揭示了其背后的意义。它可以在 非常早期 就检测到趋势的变化。 在外汇市场,所谓的“交易量”实际上是误导性的,因为那指的是价格在单位时间内的变化,因此真正的名称应是“交易速度”。 一切都取决于我们如何思考、如何行动、如何分析。 改变分析范式至关重要。 该指标完全重构了外汇市场上“交易量”的概念,用逻辑方式重新定义并应用,从而成为一个 独特而精准的工具 。 使用方法: 默认情况下,指标处于 自动模式 ,可独立用于任何时间周期。如果你希望切换到手动模式,只需点击 Auto / Manual Mode 按钮即可。 在 手动模式 下,所有计算从 2025年1月1日 开始。你可以根据需要更改该日期,以查看不同的分析结果。 最优数据周期
+++++++++++++++++++++++++++++++++++++++++++++++++++++++++++++++++++++++++++++++++++++++++++++++++ +++ Link to EURUSD Only Free Version -->  https://www.mql5.com/en/market/product/156904?source=Unknown +++++++++++++++++++++++++++++++++++++++++++++++++++++++++++++++++++++++++++++++++++++++++++++++++ Hallo Trader, This is a traditional GANN & FIBONACCI strategy based on detection of an impulsive move in the opposite direction. This is called a Breakout. At the moment of Breakout, the indicator draw
Btcusd Pro
Metin Erkamoglu
BTCUSD PRO Signal Solution for MT5 BTCUSD PRO is a decision-support indicator for MetaTrader 5, designed for traders who analyze BTCUSD or BTCUSD# with a structured signal workflow. The product is not an automated trading system. It does not open, close, or manage trades automatically. It provides analytical buy and sell signal information and displays a visual trade plan on the chart so the user can make their own trading decisions. Main purpose BTCUSD PRO is designed for traders who prefe
帮助判断这个位置适不适合买。 帮助判断这个位置适不适合卖。 当四个指标同步到底时,重点观察反弹机会。 当四个指标同步处于顶部时,重点观察下跌机会。 该系统依托中国先进算法技术与高阶数学建模体系构建而成。 本人主要使用 XAUUSD M5 周期,实际效果也是这个周期最好。 由于本指标的算法与数学公式较为复杂,测试时可能会出现运行较慢的情况。测试阶段主要观察指标是否重绘、是否滞后即可,正式版使用会更加稳定。 该指标系统绝对不重绘,绝对不使用未来函数,购买前可自行测试观察。 该指标配有完全个性化的警报系统,您可以通过以下链接进行观看。 请在正式使用前,充分阅读完整使用说明。 如有任何问题,请及时与我联系,我会尽快回复。祝您一切顺利。 https://www.mql5.com/zh/users/godofwarguo1
Beat The Market Maker MT5
Yahia Ismail Ibrahim El Mughrabi
BEAT THE MARKET MAKER Stop Entering After the Market Has Already Trapped You Most traders think they need a better entry. But the real problem is deeper. They enter when price looks strong… only to discover they were the liquidity. The market moves to collect weak positions before the real move begins. That is why you get caught in fake breakouts. That is why you enter late. That is why the chart looks clear only after the move is finished. You do not need more noise. You need to read the
ZIVA Signal Intelligence
Hassan Abdullah Hassan Al Balushi
ZIVA Signal Intelligence An Adaptive, Modular Market Intelligence System ZIVA Signal Intelligence is not positioned as a conventional trading indicator. It is a fully integrated, proprietary market intelligence system engineered to deliver structured, high-precision interpretation of price behavior within a controlled analytical environment. Developed through an independent architectural approach, ZIVA does not rely on, derive from, or replicate existing indicators. It represents a standalone
SunSignal ML — AI Gold Signals with Multi-Timeframe Confluence SunSignal ML is an advanced AI-powered signal indicator purpose-built for XAUUSD gold trading. It combines a proprietary adaptive trend algorithm with six machine learning models trained on confirmed price pivots to produce high-confidence entry signals with multi-timeframe validation. The indicator runs efficiently on M1, M5 and M15 timeframes and is designed for traders who want precision entries guided by data rather than guesswor
FX Analysis
Lee Teik Hong
FX Analysis is an all-in-one MT5 indicator dashboard that combines eight analytical tools in a single panel, helping traders identify high-probability setups without switching between charts or indicators. Designed for standard forex pairs on MetaTrader 5. Best results on M15 - H4 timeframes when all components are used together as part of the included workflow. Components Volatility Analyzer Displays historical average movement by hour and by day of the week. A real-time Pip Balance shows the
IVISTscalp5
Vadym Zhukovskyi
5 (6)
[iVISTscalp5]:通过时间研究市场行为的实验室 TLV Framework | Liquidity Activation Points ⸻ 项目概述 iVISTscalp5 是在 VISTmany 项目框架下开发的多层级时间与价格结构指标。 该系统通过 Liquidity Activation Points(时间激活点 / timings)预测: 市场启动时间 方向 运动范围 iVISTscalp5 指标可使用默认参数应用于任何金融工具。 ⸻ 实际价值 iVISTscalp5 并不是作为传统技术指标而开发的。 它的核心理念是: 让任何人都能够通过“时间”研究市场行为。 ⸻ Time Language VISTmany (TLV) — 项目的核心概念 t(p) t(p) 是 timings 被激活的价格水平。 ⸻ p(p) p(p) 是 iVISTscalp5 指标构建的核心价格水平。 最强的市场反应通常出现在: t(p) 与 p(p) 相互作用时。 ⸻ 在 TLV(Time Language VIST
Recommended TimeFrame >= H1. 100% Non Repainted at any moment.  Use it carefully, only with Trend Direction. Trading Usage: 2 Variants: as Range System or as BreakOut System (Both Only With Trend Direction)::: (Always use StopLoss for minimise Risk); [1] as Range System: (Recommended) in UP TREND:  - BUY in Blue Line , then if price goes down by 50 points (on H1) open Second BUY.   Close in any Profit you wish: TrailingStop(45 points) or Close when Price touches upper Gold Line. in DOWN TREND
VTrende Pro
Andrii Diachenko
5 (1)
VTrende Pro - MTF indicator for trend trading with a display panel for MT5 *** Videos can be translated into any language using subtitles (video language - Russian) Although the signals of the VTrende Pro indicator can be used as signals of a full-fledged trading system, it is recommended to use them in conjunction with the Bill Williams TS. VTrende Pro is an extended version of the VTrende indicator. Difference between Pro version and VTrende: - Time zones - Signal V - signal 1-2 waves -    S
Triple Crox Strategy
issam rahhal sabour
Triple Crox Strategy v4.10 Triple Crox Strategy v4.10 专业MT5指标 | 13形态 | 斐波那契 | CLUSTER ML | 13过滤 概述 专业MT5指标,融合 13种形态检测 、 斐波那契分析 、 CLUSTER机器学习 及 13种多重过滤 ,多层验证降低虚假信号。 交易设置 改良 Heikin-Ashi :绿=上升,红=下降。信号确认显示 买入 / 卖出 箭头,附带 Entry 入场、 TP1/TP2/TP3 止盈、 SL 止损水平线。13种过滤可选。 视觉组件 箭头: 绿买/红卖+Entry/TP/SL线 EMA云(3层): EMA(8/21/50),绿云=上升,红云=下降 趋势带: 绿色=上升,品红=下降 DEMA-ATR线: 绿线=上升,红线=下降 斐波那契: 回撤/扩展水平,黄金区高亮 形态+突破区: 轮廓标注+突破箭头 仪表板: 5主题4位置实时统计 风险管理 ATR止损: 倍数自适应波动环境 移动止损: 自动跟踪锁定利润 利润因子: 风险回报≥1:2才发信号 止损因子: ATR倍数1.0x
# Red and Green Light 智能交易信号指标 ## 产品简介 **Red and Green Light** 是一款基于T3多阶平滑算法的专业交易信号指标,集成了可视化红绿灯系统、智能信号识别、风险提醒和多重警报功能。无论您是手动交易者还是EA开发者,这款指标都能帮助您更精准地把握市场机会,有效规避逆势交易风险。 ### 核心优势 - **精准信号** :T3算法过滤噪音,捕捉真实趋势 - **直观可视化** :红绿灯系统一目了然 - ️ **风险保护** :自动检测逆势交易 - **多重警报** :弹窗、声音、推送通知 - **高度自定义** :文字、颜色、布局完全可调 - **实时更新** :5秒刷新,状态同步 --- ## 核心功能 **1. T3算法** :Tim Tillson/Fulks-Matulich,6阶平滑,动态通道。参数:周期6-21,Hot 0.5-0.8,多种价格类型。 **2. 信号识别** :N根K线收盘价高于T3上沿通道(T3_1u/2u/3u/5u)时买入。N根K线收
TraderHUD
Justino Porto Neto
5 (1)
TraderHUD — 交易者完整面板 TraderHUD 是一款完整的可视化指标,将交易者在图表上需要看到的所有内容整合在单个文件中:K线计时器、实时点差、可自定义水印、整点标记与价格记录,以及M5蜡烛开始标记。高度可配置,不会使图表显得杂乱。 功能 计时器和点差 当前K线剩余时间倒计时,每500毫秒更新一次——与新Tick无关 实时点差显示在计时器旁边 跟随图表上的价格线移动 智能锚定:当价格接近屏幕底部边缘时,文本自动上移以保持可见 字体、大小、颜色和分隔符完全可配置 整点标记 图表上的垂直线标示下一个整点——市场新资金可能入场的时刻 时间标签显示在线条顶部 在整点时刻自动记录当时价格 在记录价格处绘制永久水平线——可比较每个前一小时的价格位置 价格显示在标签中与时间并列 可配置偏移量:提前或延迟标记若干小时 历史价格线数量可配置(默认:3条) 切换时间周期或重新编译时价格线依然保留 线条颜色、样式和宽度均可配置 M5蜡烛开始标记 仅在低于M5的时间周期(M1、M2、M3、M4)上自动显示 直观标记每根5分钟蜡烛的开始——算法和短线交易者重新定位的时刻 可配置符号/文本(默认:^
Pan PrizMA CD Phase
Aleksey Panfilov
The Expert Advisor and the video are attached in the Discussion tab . The robot applies only one order and strictly follows the signals to evaluate the indicator efficiency. Pan PrizMA CD Phase is an option based on the Pan PrizMA indicator. Details (in Russian). Averaging by a quadric-quartic polynomial increases the smoothness of lines, adds momentum and rhythm. Extrapolation by the sinusoid function near a constant allows adjusting the delay or lead of signals. The value of the phase - wave s
Классификатор силы тренда. Показания на истории не меняет. Изменяется классификация только незакрытого бара. По идее подобен полной системе ASCTrend, сигнальный модуль которой, точнее его аппроксимация в несколько "урезанном" виде, есть в свободном доступе, а также в терминале как сигнальный индикатор SilverTrend . Точной копией системы ASCTrend не является. Работает на всех инструментах и всех временных диапазонах. Индикатор использует несколько некоррелируемых между собой алгоритмов для класси
FFx Universal Strength Meter PRO is more than a basic strength meter. Instead of limiting the calculation to price, it can be based on any of the 19 integrated strength modes + 9 timeframes. With the FFx USM, you are able to define any period for any combination of timeframes. For example, you can set the dashboard for the last 10 candles for M15-H1-H4… Full flexibility! Very easy to interpret... It gives a great idea about which currency is weak and which is strong, so you can find the best pai
The FFx Universal MTF alerter shows on a single chart all the timeframes (M1 to Monthly) with their own status for the chosen indicator. 9 indicators mode (MACD-RSI-Stochastic-MA-ADX-Ichimoku-Candles-CCI-PSAR). Each can be applied multiple times on the same chart with different settings. Very easy to interpret. Confirm your BUY entries when most of the timeframes are showing green color. And confirm your SELL entries when most of the timeframes are showing red color. 2 Alert Options : input to s
FFx Watcher Pro MT5
Eric Venturi-Bloxs
The FFx Watcher PRO is a dashboard displaying on a single chart the current direction of up to 15 standard indicators and up to 21 timeframes. It has 2 different modes: Watcher mode: Multi Indicators User is able to select up to 15 indicators to be displayed User is able to select up to 21 timeframes to be displayed Watcher mode: Multi Pairs User is able to select any number of pairs/symbols User is able to select up to 21 timeframes to be displayed This mode uses one of the standard indicators
作者的更多信息
Trend deviation scalper
Ekaterina Saltykova
1 (1)
Trend deviation scalper - is the manual system to scalp choppy market places. Indicator defines bull/bear trend and it's force. Inside exact trend system also defines "weak" places, when trend is ready to reverse. So as a rule, system plots a sell arrow when bull trend becomes weak and possibly reverses to bear trend. For buy arrow is opposite : arrow is plotted on bear weak trend. Such arrangement allows you to get a favorable price and stand up market noise. Loss arrows are closing by common p
Golden section price action indicator - is a trend-scalping complete system with enter and exit points. Indicator is based on most powerfull price action japan patterns that are filtered by volume, volatility, market phase. Pattern is not a simple combinations of candles. Patterns must have "weight" to move market in right direction. "Weight" - is the summary of pattern's volume, the size of pattern candles according to last average volatility and ofcourse pattern must appear in correct market p
SupportResistancePeaks Indicator indicator - is the combination of dynamic support/resitance and price action pattern. As a rule support/resistance indicators uses already calculated, history levels. The most disadvantage of this method - new(incomming) levels always are not the same as were on history, in other words accuracy is not so high as expected. My indicator is looking for dynamic/live levels that are forming right now after trend lost it's power and choppy market starts. As a rule exac
Trend deviation scalper - is the manual system to scalp choppy market places. Indicator defines bull/bear trend and it's force. Inside exact trend system also defines "weak" places, when trend is ready to reverse. So as a rule, system plots a sell arrow when bull trend becomes weak and possibly reverses to bear trend. For buy arrow is opposite : arrow is plotted on bear weak trend. Such arrangement allows you to get a favorable price and stand up market noise. Loss arrows are closing by common p
Trend driver bars is the manual trading system, which defines current trend continue or it's pull-back/reverse. "Driver" bars - are price action patterns that has powerfull affect on market, defining it's near future direction. Generally, driver bars represents trend "skeleton" and often anticipates new market impulse. System plots arrows when market shows 3 pattenrs in a row(most powerfull combo-pattern), and makes fast scalping of incomming movement. Loss positions closes by common profit. Lot
Wave Impulse OmegaScalper - is the manual system for scalping. In many cases Indicator "eats" almost all possible trend wave. System defines up price wave and down price wave. Inside the exact wave - system defines true trend movement and choppy market. Indicator plots signals while market is trending, powerfull and has quiet good volatility. This is complete system with enter and exit points. Main Indicator's Features Signals are not repaint,non-late or disappear(exept cases when system recalcu
Reverse side scalper is the manual trading system, that works on choppy(anti-trend) market. As a rule markets are on 80% choppy and only 20% is trend phase. System is based on custom step Moving and RSI and reverse pattern. System defines up movement, down movement, trend / choppy phases. Indicator plots Buy signal arrow when current direction is down and phase is trend, Sell signal arrow is plotted when currently is up movement and phase is trend. As a rule it allows to "catch" local maximum/mi
Binary step clouds - is the complete trading system with enter and exit points. System is based on double smoothed exponential step moving and volume weighted simple step moving.Generally each movings define trend direction and places when trend is in active phase. Signals plots when both movings approache to active trend phase and market speed is high.  Main Indicator's Features Signals are not repaint,non-late or disappear(exept cases when system recalculates all history datas,refreshing main
Acceleration Force Meter Indicator - is a trend system that join market in trend phase and after trend pull-back. AFM indicator - is the system that watchs market phases from flat to extreme volatility and prefers to enter in market when it's active, more volatility, ignoring most flat places. This is 100% complete trading system including enter and exit points. It works well with profitable trades - maximizing take profit targets(analysis of recent market volatility, its pips range to adapt cur
ImbaTrend Runner - is the trend following manual system for forex/crypto market. It defines medium-term trends and works with it in intraday mode. System shows enter points, profit and loss targets. As a rule profit targets are 2-3 X bigger than loss targets. Indicator is AutoAdaptive and it automatically updates it's settings during trading. Indicator is sensitive to market changes, regular updates helps to stay in relevant trend. Main Indicator's Features Signals are not repaint, late or disap
Early WPR divergence - is the manual system to define trend reverse. Green histogram shows main trend, Orange one - shows "short"/local trend. System is looking for clear divergence between both trends and pick up position(plot buy/sell arrows). When main trend is up, but local trend reverses to bearish trend and get's big power - sell arrow is plotted;    When main trend is down, but local trend reverses to bullish trend and get's big power - buy arrow is plotted;  Main inputs are : mediumTrend
Bull bear pressure indicator - is the manual system which defines bull/bear market. When lines is above zero level - market is strong bullish, and when lines below zero level - market is bearish. First line represents global trend and second one are smoothed and shows local market's mood. Main inputs are : MainPeriod- main indicator's period for global trend calculation; SignalPeriod - period for   smoothed and shows local market's trend; Main Indicator's Features Signals are not repaint,non-la
ROC acceleration-deceleration is the manual system for medium-term scalping. Indicator based on custom ROC system which defines bullish/bearish market and especially  acceleration-deceleration of tendention in the market's main direction. Buy arrow is plotted during bearish market when current trend decelerates and sell  arrow is plotted during bullish market when current trend decelerates. Main Indicator's Features Signals are not repaint,non-late or disappear(exept cases when system recalculat
ASI fractals with DPO filter - is the manual trend-following system. ASI fractals are the base of every trend. System plots an arrow when fractal pattern appears on ASI indcator and DPO direction is same as incomming signal. System has several ways of usage : simply indicator, indicator with suggested arrows, arrows with single targets and arrows with common profit targets. User can simply switch indicator's modes directly from chart. Main Indicator's Features Signals are not repaint,non-late or
Trend reversal index - is the manual trading system that works with overbought , oversold levels and reversal patterns. Sell arrow is plotted when indicator is higher than overbought level and here forms reversal pattern, all pattern points  located higher than overbought level. Opposite with buy arrow : ndicator is lower than oversold level and here forms reversal pattern, all pattern points located lower than overbought level.  Main Indicator's Features Signals are not repaint, late or disapp
Demarker pullback system - is the manual trading system for choppy markets. It show 2 colored histogram.  When histogram is blue - market is quite bullish, when histogram ir orange - market is more bearish. Up arrow is plotted when histogram is in oversold zone but blue color. Down arrow is plotted when histogram is in overbought zone but orange color. These patterns shows false breakout and possible soon reverse(price is overbought but shows bearish signs and price is oversold but shows bullis
TPM cross indicator MT4
Ekaterina Saltykova
TPM Cross (trend power moving cross) - is a trend following strategy based on custom signal points. Indicator consists from main custom moving chart line and trend power line. Indicator defines up and down movements by it's trend power and custom moving direction. When current market's trend looses it's power and opposite trend starts - power trend line  crosses moving and indicator plots an arrow.  Main indicator's adjustable inputs : movingPeriod - period of moving line  trendPeriod  - period
Impulse fractals indicator - is counter-trend oriented complex market fractal pattern.  Market creates bull/bear impulse, trend starts, fractals on impulsed wave are an agressive pullback signals. Buy arrow is plotted when market is bearish and it's impulse showed up-side fractal, and sell arrow is plotted when market is bullish and it's impulse showed dn-side fractal. Main indicator's adjustable inputs : impulsePeriod - main period of impulse histogram  filterPeriod  - smoothes impulse accordi
Floating peaks oscillator - it the manual trading system. It's based on Stochastik/RSI type of oscillator with dynamic/floating  overbought and oversold levels. When main line is green - market is under bullish pressure, when main line is red - market is under bearish pressure. Buy arrow appears at the floating bottom and sell arrow appears at floating top. Indicator allows to reverse signal types. Main indicator's adjustable inputs : mainTrendPeriod; signalTrendPeriod; smoothedTrendPeriod; tre
Trend speed vector - is the oscillator for manual trading. System measures trend direction and it's speed. Histogram shows 4 colors: Lime --> Strong up movement with good gain speed; Green --> Up movement with low gain speed Red --> Strong down movement with good gain speed; Orange --> Down movement with low gain speed Green and Orange histograms show weak market's movements and thуese places excluded from signal points. Buy arrow is plotted during strong down movement when bearish gain speed i
Floating gain meter MT4
Ekaterina Saltykova
Floating gain meter is the manual trading system that works with local trends and it's scalping. Histogram represents  bull/bear floating trend gain. Green color histogram shows choppy market with bullish pressure, Orange - shows choppy market with bearish pressure. Lime and Red colors shows "boiled" places in market. As a rule buy arrow is placed after strong Down movement when it's power becomes weak and choppy market starts. And sell arrow is plotted after strong Up movement when it's power
Pullback points indicator - is the manual trading system, that shows most popular market prices. Indicator measures bull/bear waves pressure and looks for "consensus" prices. As a rule these points are crossed up and down very often and opened trade has several chances to be closed in positive zone. Mainly, such points is the good base for "common profit" types of strategies. Indicator also represents   "common profit"  scalping method of trading as default one.  Main Indicator's Features Signa
Noize Absorption Index MT4
Ekaterina Saltykova
5 (1)
Noize Absorption Index - is the manual trading system that measures the difference of pressure between bears forces and bulls forces. Green line - is a noize free index that showing curent situation. Zero value of index shows totally choppy/flat market.Values above zero level shows how powerfull bullish wave is and values below zero measures bearish forces.Up arrow appears on bearish market when it's ready to reverse, dn arrow appears on weak bullish market, as a result of reverse expectation. S
Looking for EA to automate your trading strategy on the Forex market? TrendRocWaves Robot — your faithful companion in the world of trading! This 100% automated EA offers unique features: - works exclusively on high timeframes (H1 and H4) for confirmed response to market changes. - uses the most popular and liquid currency pairs such as EURUSD,GBPUSD with minimal spreads and fast transaction execution. - applies a scalping method based on a medium-term trend to achieve local goals and reduce r
Introducing the trading system Dynamic Trend Cycles Robot  — a powerful tool for H1-H4 trading with volatility pairs! Technical capabilities - pairs to trade : EURUSD,GBPUSD,XAUUSD;  - timeframes : M30,H1,H4; Why Choose Dynamic Trend Cycles Robot (DTC)? - Accurate Trend Analysis: DTC adapts to current market volatility, providing precise tracking of price trends. This allows you to confidently open positions in line with the main trend and maximize your profits. - Filtering False Signals: In t
Introducing to your attention an innovative expert advisor created specifically for the most juicy and volatility    currency     basket: GBPUSD and XAUUSD. This EA is designed using the main features of this market's movement, making it an ideal choice for dynamic trading on high-trending and medium-volatile pairs. The advisor is focused on minimizing trading risks, aiming to reduce losses to a minimum. Main features: EA is designed to open and close orders at the begginning of trading session
Introducing to your attention unique trading advisor, Squeeze roc xau points, exclusively designed for trading on the XAU/USD pair. We analyzed predominantly all objectively important timeframes and identified unique characteristics of gold movements relative to the dollar to create this product. These insights can be extremely useful in predicting market reversal points on timeframes from M30 to H8 for the XAU/USD pair. You can choose your favorite timeframe to receive signals or use multiple
Introducing to your attention the unique trading advisor "Scaled Vidya Trends", designed for dynamic scalp trading on trend volatility pairs hour timeframe. Main features of Scaled Vidya Trends: - EA works on H1 timeframe; - Uses the most popular currency pairs: EURUSD, GBPUSD, USDCAD. Brokers usually set one of the lowest spreads for these pairs; - Applies a scalping method based on local targets for orders; - Works at the close of the timeframe, waiting for signal confirmation. Signals works
Introducing to your attention a unique trading advisor "Detrended scalper jpy points robot", designed for trading with major JPY crosses. The idea is based on a modified indicator, detrended price oscillator, whose task is to eliminate the influence of the trend on price movements. This greatly simplifies the process of determining overbought/oversold cycles. The focus is on analyzing short cycles: long market cycles consist of several short ones. By analyzing the short components, we can more
Introducing the automated trading system "Flexi trend tracker robot" — a powerful instrument for hour+ timeframe trading with medium/soft volatility pairs! This EA offers unique features:  wide range of applications: This strategy can be used on various time intervals: H1 and H4 timeframes, making the trading advisor a highly versatile tool for trading.  the system works on comfortable USD crosses: USDCAD, USDCAD, and USDCAD pairs where you won't see overwhelming trends that wipe out deposits b
筛选:
无评论
回复评论