Supports And Resistance with Pivot lines
- インディケータ
- バージョン: 3.0
- アップデート済み: 3 12月 2024
- アクティベーション: 5
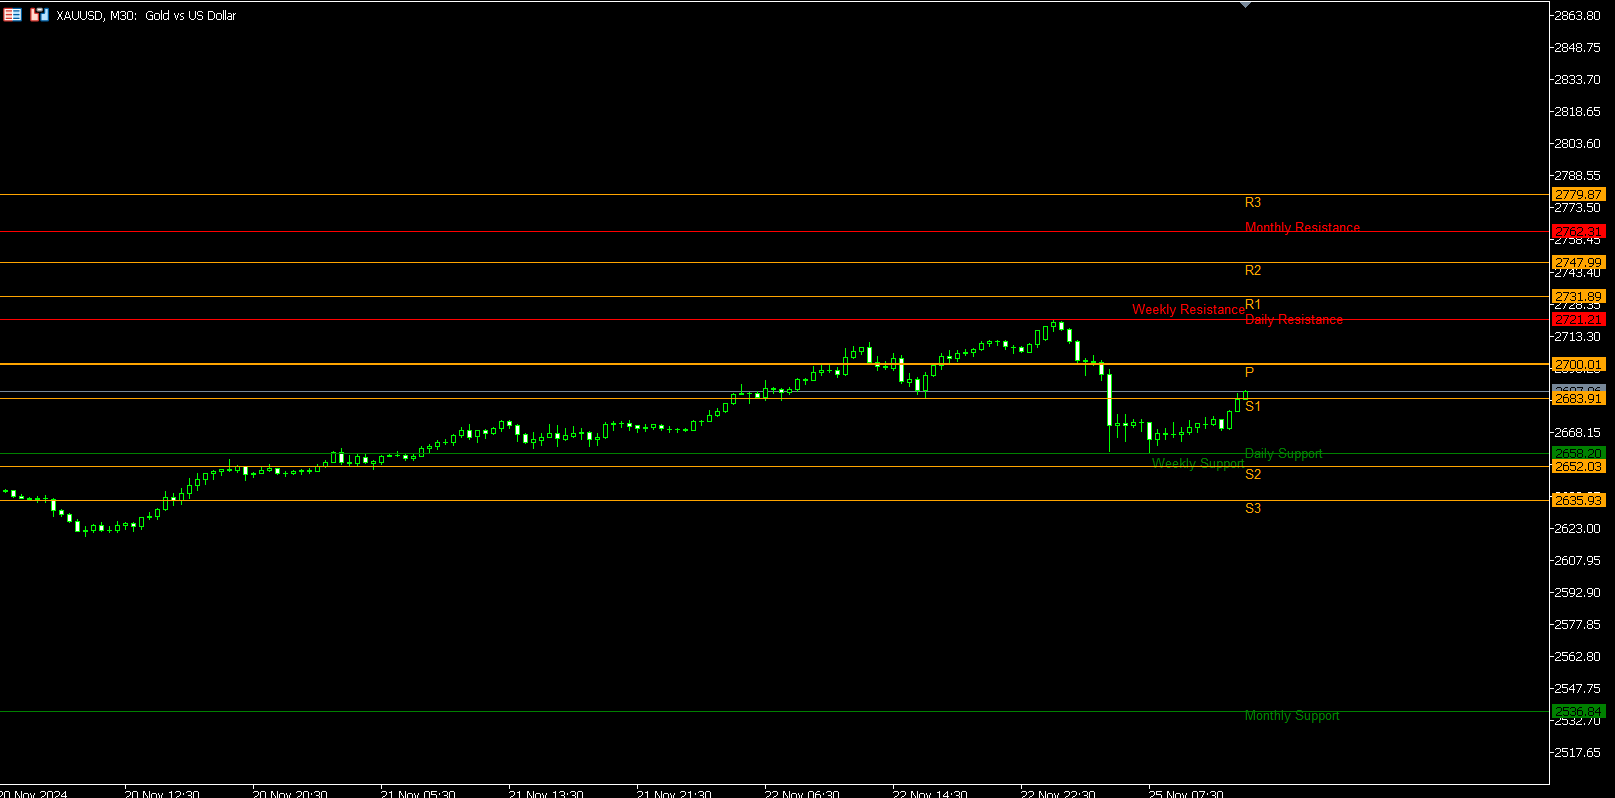
Description: The "Supports and Resistances with Daily Pivots v2" indicator is a comprehensive tool that displays pivot points and support/resistance levels on the chart. It provides both daily, weekly, and monthly pivot levels, helping traders identify potential turning points and support/resistance areas. The indicator also includes alerts to notify traders when the price reaches these levels.
Key Features
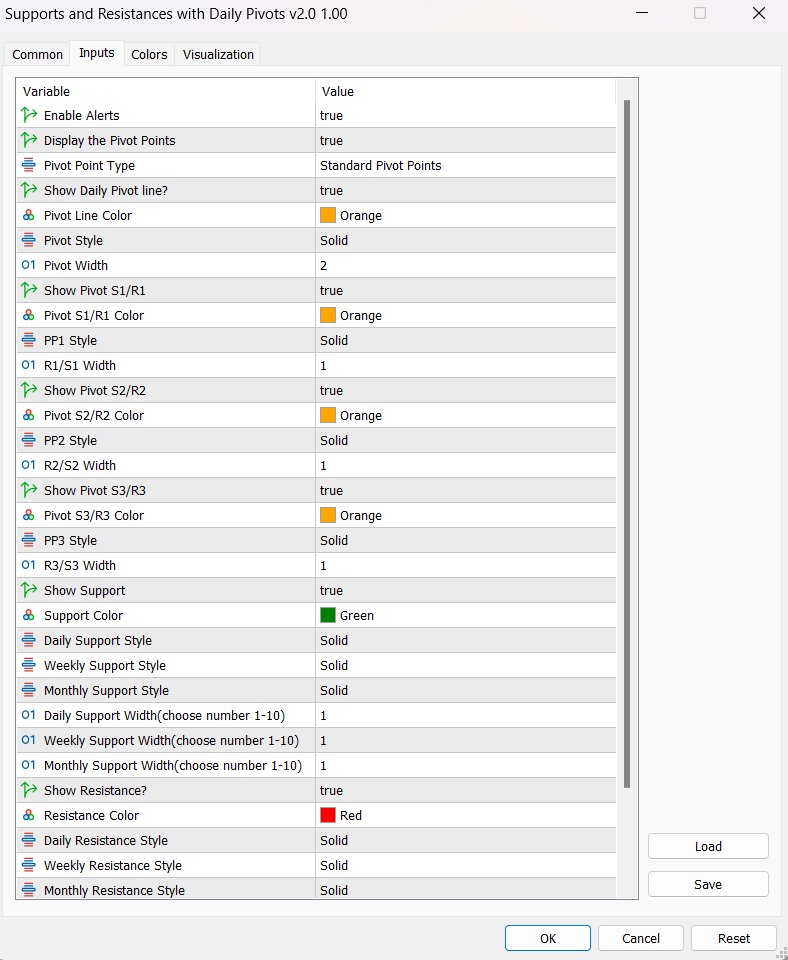
Pivot Point Types:
Standard Pivot: Calculates pivot points using the standard method.
Fibonacci Pivot: Calculates pivot points using Fibonacci ratios.
Camarilla Pivot: Calculates pivot points using Camarilla pivot methodology.
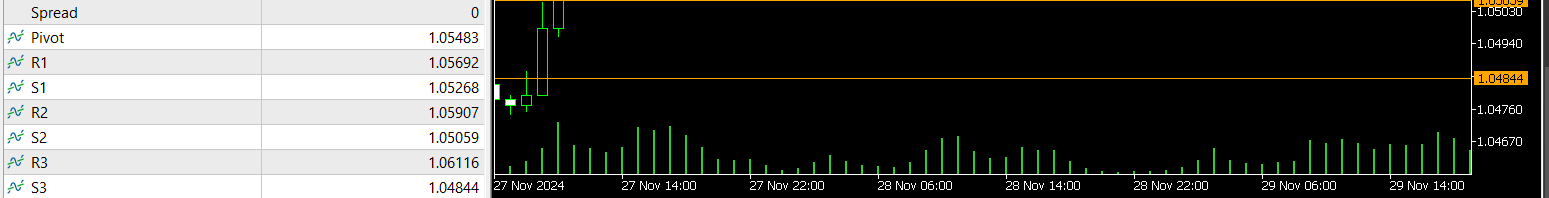
Buffer Data Precision:
Ensures that buffer data values are displayed in Data window , ensuring precision.
Support and Resistance Levels:
Displays support and resistance levels for daily, weekly, and monthly timeframes.
Each support and resistance level is customizable with different styles and colors.
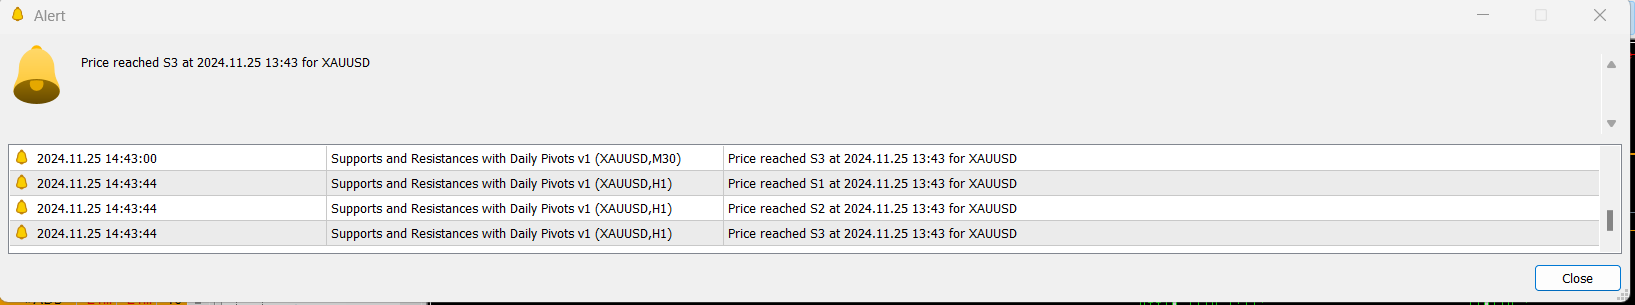
Alerts:
Provides real-time alerts when the price reaches specific pivot or support/resistance levels.
Can be enabled or disabled via the input parameters.
Pivot Point Display:
Option to show or hide the pivot lines.
Customizable colors and styles for each pivot line.
Support and Resistance Line Customization:
Customizable colors and styles for each support and resistance line.
Different line widths for pivot points, support, and resistance levels.
Alert Settings:
enable_alerts:Enable or disable price alerts.
With best regards
PJ