Clear Breakout

5

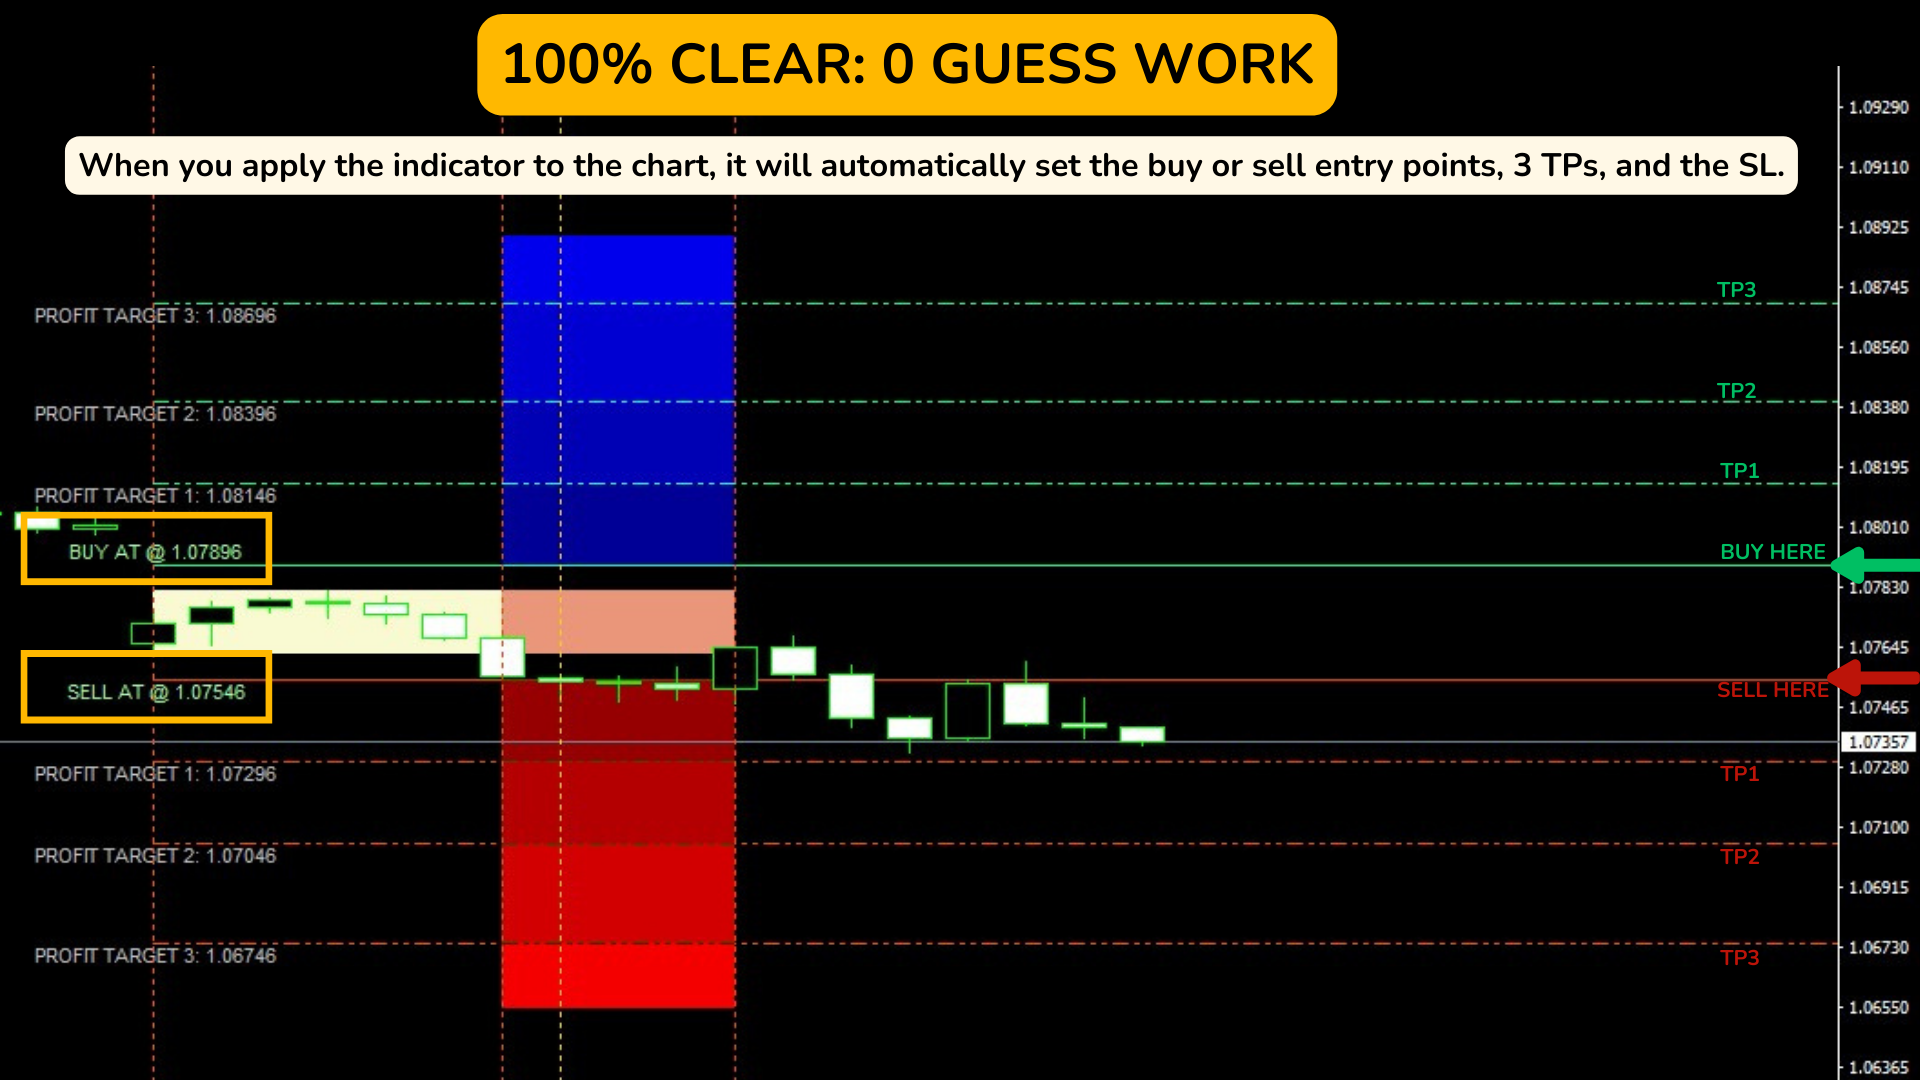
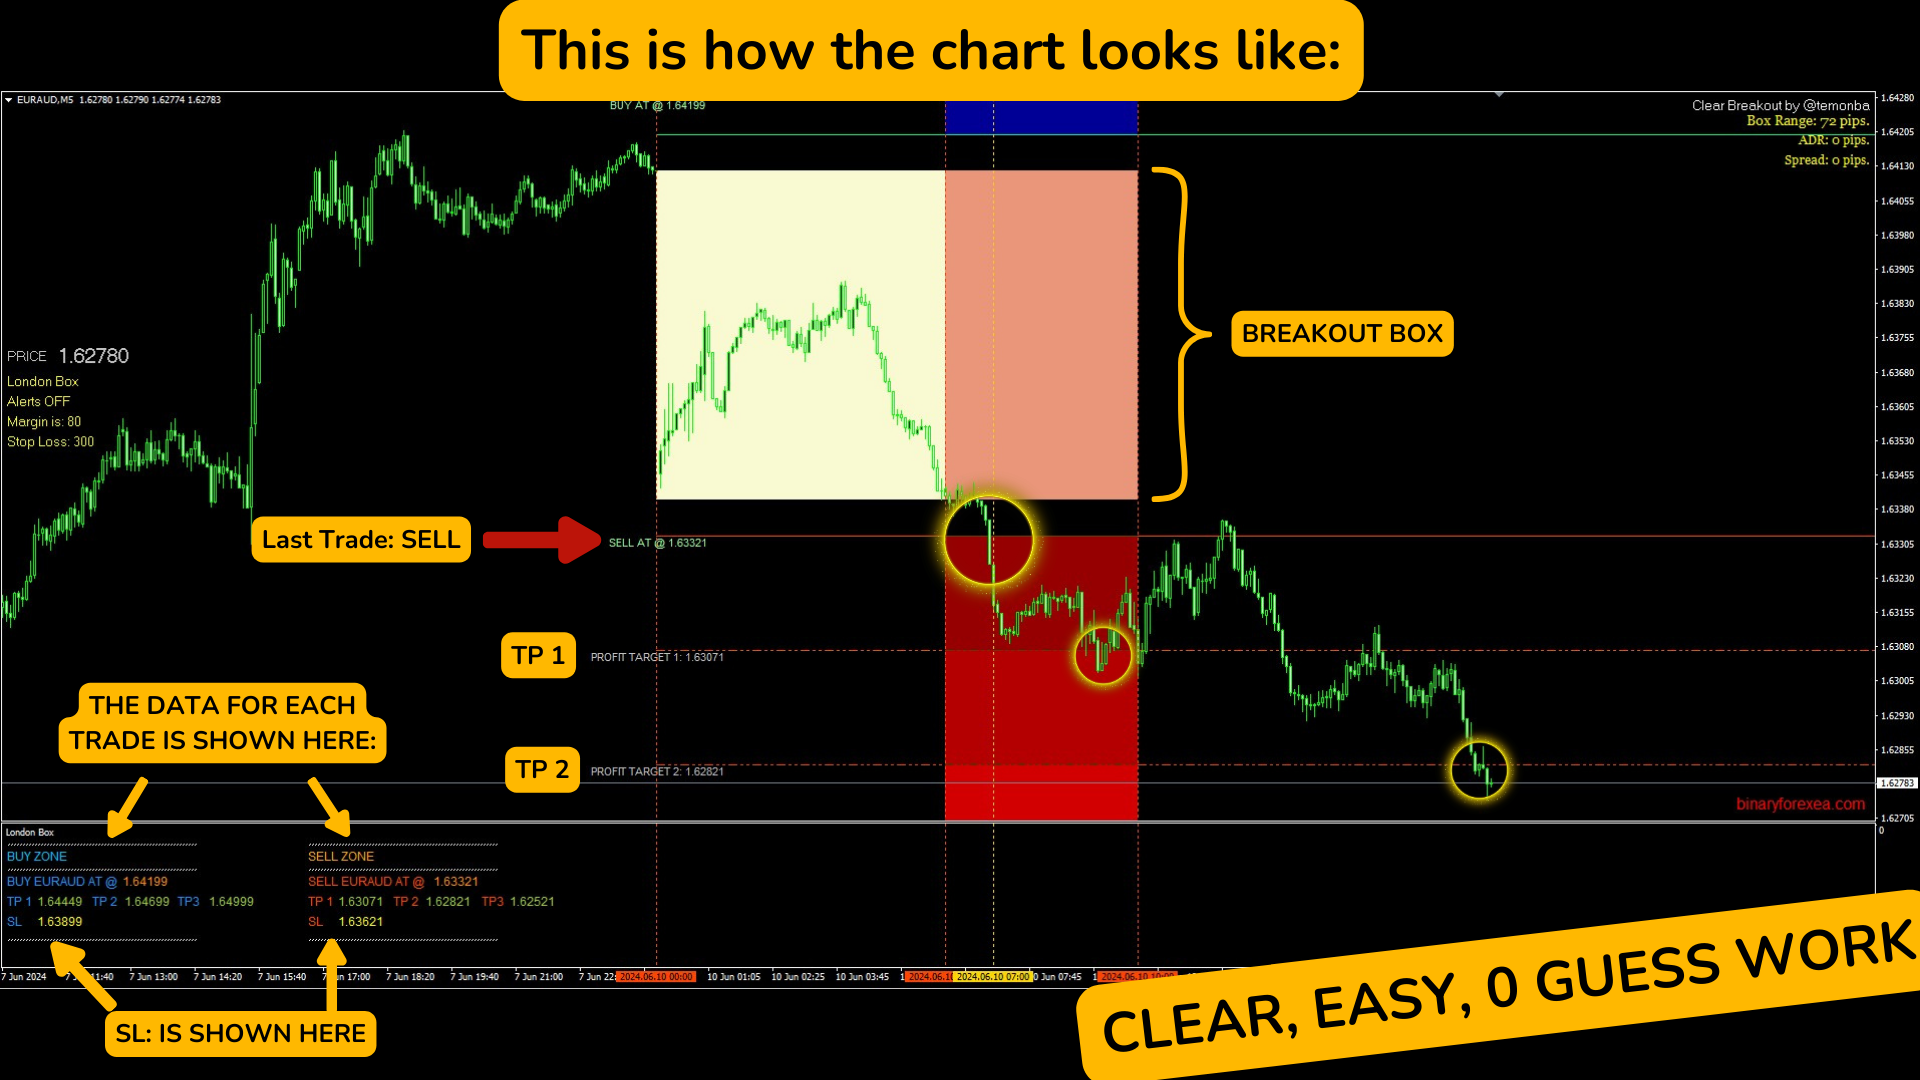
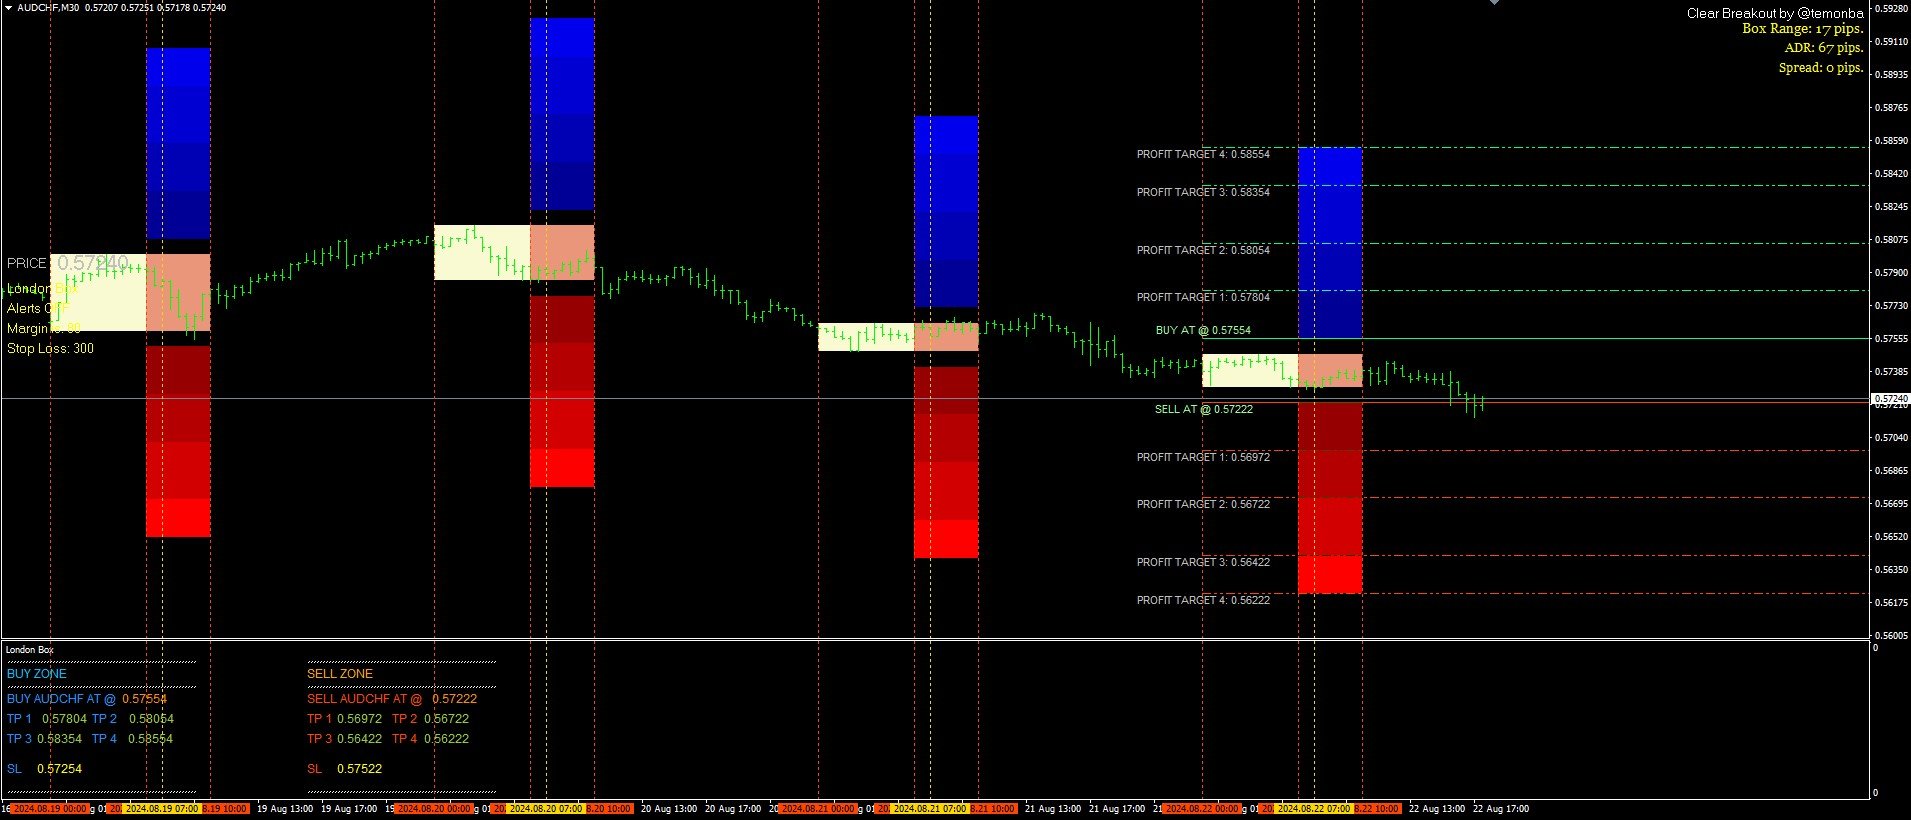
「Breakout Buy-Sell」インジケーターは、異なる市場セッション(東京、ロンドン、ニューヨーク)での価格ブレイクアウトに基づいて、潜在的な売買機会を識別し、強調するために設計されています。このインジケーターは、トレーダーが買いゾーンと売りゾーン、および利益確定(TP)とストップロス(SL)レベルを明確に視覚化するのに役立ちます。

使用戦略

インジケーターは以下のように使用できます:

  1. 初期設定:市場セッションを選択し、GMTオフセットを調整します。
  2. 市場の視覚化:各セッションの開始時に描かれるブレイクアウトボックスを観察します。これらのボックスは期間の高値と安値を示します。
  3. 売買シグナル:ボックスの高値を超えた場合は買いシグナルと見なされます。安値を下回った場合は売りシグナルと見なされます。
  4. リスク管理:TP1、TP2、TP3、およびSLレベルを使用してポジションを管理します。TPレベルは異なる利益目標のために設計されており、SLは不利な動きに対する保護を保証します。

応用戦略

このインジケーターを最大限に活用するために、以下の戦略が推奨されます:

  1. ロンドンセッション:ロンドンセッションを選択し、ブローカーの所在地に応じてGMTオフセットを調整します。
  2. 目標設定:現在の市場のボラティリティに基づいてTPとSLを設定するか、各通貨ペアの特定の推奨事項を許可します。
  3. アクティブな監視:ブレイクアウトボックスを観察し、市場条件に応じて買いまたは売りのシグナルを待ちます。
  4. アラート管理:価格が重要なレベルに達したときに通知されるようにアラートを設定し、チャートを常に監視する必要がないようにします。

外部パラメータの説明

  • Margin:買いと売りのゾーンを確立するためにブレイクアウトレベルに追加されたピップのスペース。
  • TP1, TP2, TP3:それぞれの利益確定レベル1、2、3。
  • SL:標準のストップロスレベル。
  • Auto_SL:有効にすると、通貨ペアに基づいてSLを自動的に調整します。
  • iSession:市場セッションの選択(1=アジア、2=ロンドン、3=ニューヨーク)。
  • GMT_Offset:GMT時間のオフセット調整。
  • UK_DST, US_DST:英国と米国のサマータイム設定。
  • NumberOfDays, iMaxNoOfDays:計算および視覚化のために考慮する日数。
  • SL_GU, SL_GJ, SL_EU, SL_EJ, SL_GBPCHF, SL_USDCHF:異なる通貨ペアの特定のSL値。
  • ChartHasBlkBgd:テキストとオブジェクトの色を調整するためのチャートの黒い背景の有無を示します。
  • BoxColor, TradingBoxColor:ブレイクアウトボックスとトレーディングボックスの色。
  • Pop_Up_Box:ポップアップアラートの有効化または無効化。
  • Alert_Time_Out:アラートの継続時間(秒単位)。
  • Alert_On_TP1, Alert_on:TPレベルまたはブレイクアウトに達したときにアラートを有効にします。

「Breakout Buy-Sell」インジケーターは、異なる市場セッションでの価格ブレイクアウトに基づいてトレードの機会を識別するための強力なツールです。その柔軟な設定とカスタマイズ可能なアラートにより、チャートを常に監視することなく日々の市場変動を活用したいトレーダーに適しています。
レビュー 2
DanyLbc747
1248
DanyLbc747 2025.09.11 20:33 
 

Simple easy to use indicator. Great product.

lauro1956
5827
lauro1956 2024.08.21 16:30 
 

Fantastic Box Indicator It is not enough to just put a box and if it goes up you buy and if it goes down you sell.

This indicator takes into account the London, Asian, New York sessions... it is well worked...

It makes TP and SL easier for you in your own way

very good indicator

おすすめのプロダクト
The Th3Eng PipFinite indicator is based on a very excellent analysis of the right trend direction with perfect custom algorithms. It show the true direction and the best point to start trading. With StopLoss point and Three Take Profit points. Also it show the right pivot of the price and small points to order to replace the dynamic support and resistance channel, Which surrounds the price. And Finally it draws a very helpful Box on the left side on the chart includes (take profits and Stop loss
Super Reversal Pattern Indicator Unlock the power of advanced pattern recognition with our Super Reversal Pattern Indicator. Designed for traders seeking precision and reliability, this indicator identifies one of the most effective reversal patterns in technical analysis, offering a significant edge in your trading strategy. Key Features: Non-Repainting Accuracy: Enjoy the confidence of non-repainting technology. Once a Super Reversal Pattern is detected, it remains static, providing consiste
Noize Absorption Index - is the manual trading system that measures the difference of pressure between bears forces and bulls forces. Green line - is a noize free index that showing curent situation. Zero value of index shows totally choppy/flat market.Values above zero level shows how powerfull bullish wave is and values below zero measures bearish forces.Up arrow appears on bearish market when it's ready to reverse, dn arrow appears on weak bullish market, as a result of reverse expectation. S
「Auto FIBO Pro」Crypto_Forex インジケーターは、取引の補助ツールとして最適です。 - インジケーターは、フィボナッチ レベルとローカル トレンド ライン (赤色) を自動的に計算してチャート上に配置します。 - フィボナッチ レベルは、価格が反転する可能性のある重要な領域を示します。 - 最も重要なレベルは、23.6%、38.2%、50%、61.8% です。 - リバーサル スキャルピングやゾーン グリッド取引に使用できます。 - Auto FIBO Pro インジケーターを使用して、現在のシステムを改善する機会も多数あります。 - Info Spread Swap Display があり、接続されている外国為替ペアの現在のスプレッドとスワップを表示します。 - ディスプレイには、アカウントの残高、エクイティ、マージンも表示されます。 - Info Spread Swap Display は、チャートのどのコーナーにも配置できます。 高品質のトレーディングロボットとインジケーターをご覧になるにはここをクリックしてください! これは、この MQL5 ウェブサイ
Candle Divergence is a professional-grade MetaTrader indicator designed to identify high-probability continuation opportunities using hidden divergence logic derived from normalized candle structure. Instead of relying on traditional oscillators, the indicator transforms raw price into a smoothed, relative candle model using dual moving average normalization. This allows it to detect subtle momentum imbalances between price action and underlying structure with improved clarity and reduced noise.
Improved version of the free HMA Trend indicator (for MetaTrader 4) with statistical analysis. HMA Trend is a trend indicator based on the Hull Moving Average (HMA) with two periods. HMA with a slow period identifies the trend, while HMA with a fast period determines the short-term movements and signals in the trend direction. The main differences from the free version: Ability to predict the probability of a trend reversal using analysis of history data. Plotting statistical charts for analyzi
The indicator shows the potential trend direction by cyclical-wave dependence. Thus, all the rays of the intersection will be optimal rays, in the direction of which the price is expected to move, taking into account the indicator period. Rays can be used as a direction for potential market movement. But we must not forget that the approach must be comprehensive, the indicator signals require additional information to enter the market.
Welcome to Propsense, the best solution for new and veteran traders with a simple FREE strategy! This indicator is a unique and affordable trading tool built on the teachings of a former bank trader. With this tool, you will be able to see inefficient points with ease. As well as this, traders will have an interactive display panel which will show your running and closed P/L in pips AND currency units. It also allows you to set your desired daily target/loss limit!  IMPORTANT INFORMATION Maximi
フィボナッチリトレースと拡張ラインツール DiNapoliポイント取引方法とゴールデンセクション取引を使用するトレーダーにとって理想的なMT4プラットフォームのフィボナッチリトレースと拡張ラインツール 主な特長: あなたはフィボナッチリトレースメントの複数のセットを直接描くことができ、重要なリターンポイント間の関係は一目瞭然です。 2.フィボナッチ拡張を描画することができます。 3.フィボナッチフォールドバックとラインの延長は、簡単な観察と数値表示のために左右に動かすことができます。 4.チャートは非常に爽やかな 5.数字キーでサイクルを切り替えることができます。 ファンクションキー: 1。 [戻るを押す、要求に応じて描画する、最大8つのグループにする 2。拡張]を描くには[押す] 3。 \を押すと、現在のサイクルの下にあるすべての拡張機能と折り畳みが削除されます 4。フォールドバックを移動して削除して展開する (1)最初のフォールドバックセットのF5行をクリックします。 一度クリックすると(黄色に変わります)、キーボードのDeleteキーを押すと、フォーカ
Structural Equilibrium: A New Era of Adaptive Market Analysis As information technology advances and market participation grows, traditional analytical tools often face declining efficiency. Standard technical indicators frequently struggle to interpret the complexities of modern, algorithm-driven market structures. Structural Equilibrium was developed as a high-performance solution featuring a multi-level adaptive smoothing mechanism. This core logic allows the tool to maintain its analytical r
Price Magnet — Price Density and Attraction Levels Indicator Price Magnet is a professional analytical tool designed to identify key support and resistance levels based on statistical Price Density. The indicator analyzes a specified historical period and detects price levels where the market spent the most time. These zones act as “magnets,” attracting price action or forming a structural base for potential reversals. Unlike traditional Volume Profile tools, Price Magnet focuses on price-time d
Delta Pairs
Anatolii Zainchkovskii
Delta Pairs is an indicator for pair trading, it displays the divergence of two currency pairs. Does not redraw. A useful tool for the analysis of the behavior of two currency pairs relative to each other. Purpose The Delta Pairs indicator is designed for determining the divergences in the movements of two currency pairs. This indicator is displayed as two line charts and the difference (delta) between these charts in the form of a histogram. The Delta Pairs indicator will be useful for those w
Nexus Signal System は MT4 用のインジケーターで、12 のテクニカル条件を組み合わせてトレードシグナルを生成します。本システムは、シグナルを確定する前に複数の要素(トレンド、モメンタム、出来高、サポート/レジスタンスゾーン)の共鳴を分析し、単一の指標だけを使用する場合に比べて、誤シグナルの発生を減らします。 分析基準(スコア 0–15 点): パターン検出(ピンバー、包み足) マルチタイムフレーム分析(上位時間足でのトレンド確認) ADX マーケットレジーム(トレンドのない市場を回避) サポート/レジスタンスゾーン(自動スイングポイント) 移動平均線 20/50/200(トレンド整列) RSI 14 期間(モメンタム) 相対出来高(機関投資家の確認) ATR(ボラティリティ) 機能: 透明な品質スコア付きシグナル(0–15) 自動検出された S/R ゾーンをチャートに表示 仮シグナル(現在のバー)と確定シグナル(確定バー) ATR に基づくストップロスおよびテイクプロフィット リアルタイム市場情報ダッシュボード 8 種類のカラーテーマで視覚的カスタマイズ 56
Magical Arrow
Ranguni Abdulsamir Abdulmajid
Magical Arrow Indicator – Clear & Reliable Signals The Magical Arrow Indicator is a non-repainting, trend-following tool that gives you crystal-clear Buy and Sell signals . It  high-probability reversals and entries . No more guesswork – just follow the arrows on your chart! The Magical Arrow Indicator is a powerful, easy-to-use trading tool that helps you catch the most profitable Buy and Sell opportunities in the Forex market. It is designed for beginners and professional traders , giving you
We present you the indicator "Candle closing counter", which will become your indispensable assistant in the world of trading. That’s why knowing when the candle will close can help: If you like to trade using candle patterns, you will know when the candle will be closed. This indicator will allow you to check if a known pattern has formed and if there is a possibility of trading. The indicator will help you to prepare for market opening and market closure. You can set a timer to create a pre
[ZhiBiCCI]インディケータは全てのサイクル使用に適しており、そして全ての市場品種にも適しています。 [ZhiBiCCI]緑色の実線は強気の発散の逆転です。緑色の点線は古典的な強気の発散です。 [ZhiBiCCI]赤への実線は逆弱気の発散である。赤い点線は古典的な弱気の発散です。 [ZhiBiCCI]はパラメータ(アラート、メール送信、通知送信)で設定でき、(true)に設定するとインスタント信号をアラームウィンドウに送信し、Eメール、インスタントメッセージを送信できます。 パラメータ設定の説明 [displayAlert]:これはアラームスイッチで、trueに設定され、矢印が表示されればプロンプトに自動的に警告され、falseに設定されれば警告されません。 [sendmail_NO_OFF]:これはメールを送信するためのスイッチで、trueに設定します。矢印が表示されていればMT4で設定したメールボックスにメールを送信し、falseに設定されていればメールを送信しません。 [sendnotification_NO_OFF]:これはインスタントメッセージを送信するた
Heiken Ashi candle chart is an improved version of The Japanese candle chart, which can effectively filter the market "noise" of the Japanese candle chart. It is favored by many traders for its simplicity and intuition. For trend traders, the HA candle chart is a magic tool. Unlike the traditional Japanese candle chart, Heikenashi does not reflect the opening price, high price, low price and closing price of the market. Instead, Heikenashi calculates the value of a single K line in the dominant
Consolidations
Rofhiwa Bruce Nthulane
5 (1)
What if you could see trouble from far, just imagine having some ability to foresee danger. This indicator has the ability to see consolidations before they are clear to everyone else. In the market everything is always fun until the market starts consolidating and often times by the time people realise it it's often too late. This Indicator will spot consolidations very fast and let you know at the top right of the chart so that you can either avoid losses by stopping to trade using trend follo
Simple to read and powerful, no fancy lines and drawings to clutter your chart or distract you. The trend probability oscillator estimates how likely a trend will continue in a certain period. The cummulator period controls how many bars in the past to use and is a proxy for the timescale the trend probability should hold. The use of a Max Line improves this further by indicating when a trend is likely to reverse. In most cases a trend must lose momentum before reversing. Hence, a trend probabil
The Stepping Trend Indicator     The Steppi ng Trend indicator uses the  average true range  (ATR indicator) in its calculation. This gives you control to set your own average true range period, I set the Default as 10.   Indicator Details. Green Arrow Up: This means you are at the starting point of a new bullish trend, it’s time to buy.   Red  Arrow  Down : This means you are at the starting point of a new  bearish  trend, it’ s time to sell .   What if you miss the Arrow Signal?   No prob
Phase Analytics Pro: Advanced Cyclic Market Analyzer Phase Analytics Pro is a sophisticated technical tool designed for traders who prioritize mathematical precision over lag-heavy traditional indicators. Based on the principles of digital signal processing, this indicator decomposes price action into phase and quadrature components to identify the dominant market cycle. How it works: The algorithm calculates the instantaneous phase of the market, allowing it to distinguish between trending and
This EA is an extension for the free trade indicator Trend Mate . https://www.mql5.com/en/market/product/50082 The main idea is to support your decision to  trade  according to the current trend. It is possible to configure alert and push notification to receive when entering to first candle for bull / bear trend. For this extension of the free indicator now it is possible to filter the current trend info with other timeframes. For example show trend for timeframe M5 considering also timeframe
Trend Scanner
Vladimir Kalendzhyan
4.33 (6)
By purchasing this indicator, you have the right to receive a free copy of one of   my other indicator's or advisor’s!  (All future updates are included. No limits) . To get it , please contact me by  mql5 message ! The Trend Scanner trend line indicator displays the trend direction and its changes. The indicator works on all currency pairs and  timeframes. The indicator simultaneously displays multiple readings on the price chart: the support and resistance lines of the currency pair, the exist
Bias Finderとは Bias Finder (with Export) は、市場の統計的なバイアスを検出・分析し、繰り返し現れる傾向をわかりやすく可視化する高度なインジケーターです。裁量トレーダーからシステムトレーダーまで、定量分析をトレード戦略に取り入れたい方に最適なツールです。 分析モード このインジケーターは、さまざまな時間的ロジックに基づいて価格バイアスを計算・表示します: Hourly Bias :時間ごとの統計分析 Weekday Bias :曜日別のパフォーマンス分布 Day-of-Month Bias :月の日ごとの価格挙動 Monthly Bias :月単位の傾向分析 主な機能 見やすく整理された表形式での表示 合計損益、回数、平均損益 の詳細データを提供 プラス・マイナスを自動で強調表示(色はカスタマイズ可能) ワンクリックで CSV形式にエクスポート 任意のチャートに合わせた表示調整が可能 トレードにおける利点 繰り返し出現する市場パターンを即座に把握 季節性や市場サイクル に基づく戦略に最適 裁量分析 と 定量的システム開発 の両方に対応 エクスポートし
"Impulses and Corrections 4" is created to help traders navigate the market situation. The indicator shows multi-time frame upward and downward "Impulses" of price movements. These impulses are the basis for determining the "Base" , which is composed of zones of corrections of price movements, as well as "Potential" zones for possible scenarios of price movement. Up and down impulses are determined based on a modified formula of Bill Williams' "Fractals" indicator. The last impulse is always "U
Crypto_Forex インジケーター HTF Ichimoku for MT4。 - Ichimoku インジケーターは、最も強力なトレンド インジケーターの 1 つです。HTF は、Higher Time Frame を意味します。 - このインジケーターは、トレンド トレーダーや、プライス アクション エントリとの組み合わせに最適です。 - HTF Ichimoku インジケーターを使用すると、より高い時間枠の Ichimoku を現在のチャートに添付できます。 - 上昇トレンド - 赤い線が青い線より上 (両方の線が雲より上) / 下降トレンド - 赤い線が青い線より下 (両方の線が雲より下)。 - 価格が Ichimoku 雲の上部境界を突破した場合にのみ、買い注文を開きます。 - 価格が Ichimoku 雲の下部境界を突破した場合にのみ、売り注文を開きます。 - HTF Ichimoku インジケーターを使用すると、大きなトレンドを捉える機会が得られます。 高品質のトレーディングロボットとインジケーターをご覧になるにはここをクリックしてください! これは、この MQL
Magic Grid
Aliaksandr Charkes
4.54 (28)
Magic Grid is an indicator-free advisor that uses a grid strategy. The strategy is based on automatic reopening of grid pending orders, after closing their market positions (by Take-Profit, Stop-Loss or manually). Pending orders are placed with a specified step from the initial prices, which can be entered manually or generated automatically ( one time at the beginning of the trade ). The robot can trade on any time frame, on any currency pair, on several currency pairs, and on any number of di
FREE
Very precise patterns to detect High Accurate Order Blocks: It Draw zone after market Structure Breakout  with a high Accuracy, institutional orders with the potential to change the price’s direction and keep moving towards it, have been placed.   Features Auto Order Blocks Draw Market Structure BOS LINE Auto Imbalance Detect Auto Trend Detect MTF Order Blocks Double Signal One Alert Signal Second Long Wick Rejection Signal Imbalance removed after filled Order Blocks Retest counted Order Block
Crypto_Forex MT4用インジケーター「 RSI SPEED 」は、優れた予測ツールで、リペイント機能はありません。 - このインジケーターの計算は物理学の方程式に基づいています。RSI SPEEDはRSI自体の1次導関数です。 - RSI SPEEDは、主要トレンドの方向にスキャルピングエントリーするのに適しています。 - 適切なトレンドインジケーター(例えばHTF MA(画像参照)など)と組み合わせて使用​​してください。 - RSI SPEEDインジケーターは、R​​SI自体がどれだけ速く方向転換するかを示します。非常に敏感です。 - モメンタムトレード戦略にはRSI SPEEDインジケーターの使用をお勧めします。RSI SPEEDインジケーターの値が0未満の場合は価格モメンタムが下降し、RSI SPEEDインジケーターの値が0を超える場合は価格モメンタムが上昇します。 - インジケーターにはモバイルとPCのアラートが組み込まれています。 高品質のトレーディングロボットとインジケーターをご覧になるにはここをクリックしてください! これは、このMQL5ウェブサイトで

Intraday Levels shows intraday levels grid for intraday trading Shows a grid for the day levels, gives you a guide to know the trend and to measure intraday trades (stop-loss and take-profit). Parameters are: Levels Mode: Basic mode: Shows highest, lowest and middle levels. Advanced mode: Shows highest, lowest, middle and intermediate levels. Fibonacci mode: Shows session Fibonacci retracements levels. Momentum mode: Shows delayed Advanced levels to identify momentum. Smooth Period (Momentum m
このプロダクトを購入した人は以下も購入しています
M1 SNIPER は使いやすいトレーディングインジケーターシステムです。M1時間足向けに設計された矢印インジケーターです。M1時間足でのスキャルピングのためのスタンドアロンシステムとして、また既存のトレーディングシステムの一部としても使用できます。このトレーディングシステムはM1時間足での取引に特化して設計されていますが、他の時間足でも使用できます。元々、この手法はXAUUSDとBTCUSDの取引用に設計しましたが、他の市場においても役立つと考えています。 インジケーターのシグナルは、トレンドの方向と逆方向に取引できます。インジケーターのシグナルを利用して両方向に取引するのに役立つ特別な取引テクニックをご紹介します。この手法は、特別な動的なサポートとレジスタンスの価格帯を利用することに基づいています。 ご購入後、M1 SNIPER矢印インジケーターをすぐにダウンロードできます。さらに、M1 SNIPERツールのすべてのユーザーに、以下のスクリーンショットに表示されているApollo Dynamic SRインジケーターを無料で提供しています。この2つのインジケーターを組み合わせることで
SR Liquidity は、市場の流動性が集中し、価格が最も強く反応する「隠れたゾーン」を可視化するために設計されたトレーディング指標です。こうした流動性の高いエリアは強力なサポート(支持)およびレジスタンス(抵抗)レベルとして機能し、市場が反転する可能性が最も高いポイントを明確に示してくれます。 単なる一般的なサポートラインやレジスタンスラインを描画するのではなく、「SR Liquidity」は実際の価格変動を分析し、売りと買いの圧力が集中するゾーンを特定します。これらは、市場の真の動きを牽引する「流動性のプール(溜まり場)」そのものです。それらをチャート上に直接可視化することで、価格が実際に反応する前に、その動きを予測することが可能になります。つまり、このインジケーターは価格の方向性が変わる可能性を予測するのです。生のプライスアクションを、市場の重要な水準(転換点となり得るポイント)を示す、明確で実用的なロードマップへと変換してくれます。 このインジケーターは、FX、株価指数、貴金属、仮想通貨など、あらゆる銘柄や時間足で使用可能です。 ご購入後、取引手順や無料の優れた追加インジケ
Trend SniperX MT4
Sarvarbek Abduvoxobov
5 (1)
Trend Sniper X は、トレーダーがトレンドの方向性と潜在的な反転ポイントを明確かつ正確に特定できるように設計された、MetaTrader 5 用のマルチタイムフレーム・トレンドフォロー指標です。 MT5版はこちら: https://www.mql5.com/en/market/product/181101 価格情報: 現在の価格はプロモーション価格であり、今後のアップデートや新機能の追加に伴い変更される場合があります。 Code2Profit チャンネル マルチタイムフレーム分析で市場をマスターしよう! Trend Sniper Xで勝率を最大化する方法:ルールとセッションのコツ 技術仕様 プラットフォーム MetaTrader 5 インジケータータイプ マルチタイムフレーム・トレンドインジケーター 動作タイムフレーム すべてのチャート時間足(上位足M1~MN1を独立して選択可能) 主要対象銘柄 為替(Forex)、ゴールド(XAUUSD)、その他のCFD 推奨口座 すべての口座タイプ ビジュアル表示 トレンドカラーローソク足(買い/売り/弱い/変化)+ 買い/売りシグナル
Neuro Poseidon is a new indicator by Daria Rezueva. It combines precise trading signals with adaptive TP/SL levels - creating best possible trades as a result! Message me and get  Neuro Poseidon Assistant  as a gift to automize your trading process! What makes it stand out? 1. Proven profitability on all assets and timeframes 2. Only confirmed BUY and SELL signals present on the chart 3. Adaptive TP & SL levels generated by the software for each trade 4. Easy to understand - suitable for all
現在30%OFF! 初心者やエキスパートトレーダーのためのベストソリューション! このダッシュボードソフトウェアは、28の通貨ペアで動作しています。それは私達の主要な指標(高度な通貨の強さ28と高度な通貨インパルス)の2に基づいています。それは全体の外国為替市場の大きい概観を与えます。それは、すべての(9)時間枠で28の外国為替ペアのための高度な通貨の強さの値、通貨の動きの速度と信号を示しています。チャート上で1つのインディケータを使用して市場全体を観察し、トレンドやスキャルピングの機会をピンポイントで見つけることができたら、あなたのトレードがどのように改善されるか想像してみてください。 このインディケータには、強い通貨と弱い通貨の識別、潜在的な取引の識別と確認がより簡単になるような機能が搭載されています。このインディケータは、通貨の強さや弱さが増加しているか減少しているか、また、すべての時間枠でどのように機能しているかをグラフィカルに表示します。 新機能として、現在の市場環境の変化に適応するダイナミックなマーケットフィボナッチレベルが追加され、すでに当社のAdvanced
KURAMA GOLD SIGNAL PRO MT4版 ゴールドのサインに、目で見えるトレード計画を。 ゴールドのサインが出た。利確はどこか。損切りはどこか。エントリー前に何を確認すべきか。 KURAMA GOLD SIGNAL PROは、その判断材料をチャートに集約します。XAUUSDのM5、M15向けに、売買サイン、自動計算TP/SL、3段階のサイン評価、注意すべき相場条件を知らせるMARKETパネルを搭載。 セットアップ、決済目安、相場の注意点を一か所で確認。情報を集める手間を減らし、トレードの判断に集中できます。 買い切り購入者限定特典 AI Zone Radar MT5版と完全PDFマニュアルを無料プレゼント。 ご購入後にMQL5でメッセージをお送りください。買い切り購入が対象です。レンタルは対象外です。 AI Zone Radarを見る サインから、具体的なトレード計画へ SMA 13、21、75、100へのタッチを使ったセットアップを検出。各サインに売買方向と対象MAを表示するため、浅い押し目、戻りと深い調整を区別して確認できます。 チャートとパネルには、次の情報を表示し
Presenting one-of-a-kind Gann Indicator for XAUUSD IQ Gold Gann Levels is a non-repainting, precision tool designed exclusively for XAUUSD intraday trading. It uses W.D. Gann’s square root method to plot real-time support and resistance levels, helping traders spot high-probability entries with confidence and clarity. William Delbert Gann (W.D. Gann) was an exceptional market analyst whose trading technique was based on a complex blend of mathematics, geometry, astrology, and ancient calculation
現在20%OFF! 初心者やエキスパートトレーダーに最適なソリューションです。 このインディケータは、エキゾチックペア・コモディティ・インデックス・先物など、あらゆるシンボルの通貨の強さを表示することに特化したインディケータです。金、銀、原油、DAX、US30、MXN、TRY、CNHなどの通貨の強さを表示するために、9行目にどのシンボルでも追加することができます。独自の機能を多数搭載し、新しい計算式を採用したため、ユニークで高品質、かつ手頃な価格のトレーディングツールとなっています。新しいトレンドやスキャルピングチャンスのトリガーポイントを正確に把握することができるため、あなたのトレードがどのように改善されるか想像してみてください。 ユーザーマニュアル:ここをクリック   https://www.mql5.com/en/blogs/post/708876 すべての時間枠に対応します。あなたはすぐにトレンドを見ることができるようになります! 新しいアルゴリズムに基づいて設計されているため、潜在的な取引の特定と確認がより簡単になります。これは、8つの主要通貨と1つのシンボルの強弱
The elite (V3) multi-indicator suite from JoaquinTrading specifically geared towards Forex & binary options, including regulated exchanges such Nadex, Cantor Exchange, and other binary option brokers. The Probability Tool Suite Elite will provide the given win/loss outcome probabilities of up to 10 strike levels, a specific expiration duration, based on a combination of up to 16 indicators, rules, or conditions and derivative behavior (i.e. expiry, touch, touch & retrace).  Using this indicato
Dynamic Forex28 Navigator - 次世代の Forex 取引ツール。 現在 49% オフ。 Dynamic Forex28 Navigator は、長年人気のインジケーターを進化させたもので、3 つの機能を 1 つにまとめています。 Advanced Currency Strength28 インジケーター (レビュー 695 件)  + Advanced Currency IMPULSE with ALERT (レビュー 520 件) + CS28 コンボ シグナル (ボーナス)。 インジケーターの詳細 https://www.mql5.com/en/blogs/post/758844 次世代の Strength インジケーターが提供するもの  オリジナルで気に入っていたすべての機能が、新機能と精度の向上によって強化されました。 主な機能: 独自の通貨強度計算式。 すべての時間枠でスムーズかつ正確な強度ライン。 トレンドの特定と正確なエントリーに最適です。 ダイナミックマーケットフィボナッチレベル (マーケットフィボナッチ)。 このインジケーターに固有
Ace Supply Demand Zone Indicator The concept of supply demand relies on the quantity mismatching between buying and selling volumes in the financial market. Supply and demand zone can provide the good entry and exit. A zone is easier to trade than a line. The supply demand zone can provide the detailed trading plan and the risk management. Its ability to predict market direction is high. There are two distinctive points about Ace Supply Demand Zone Indicator. Ace Supply Demand Zone indicator was
Gold Channel is a volatility-based indicator, developed with a specific timing algorithm for the XAUUSD pair, which consists of finding possible corrections in the market. This indicator shows two outer lines, an inner line (retracement line) and an arrow sign, where the theory of the channel is to help identify overbought and oversold conditions in the market. The market price will generally fall between the boundaries of the channel. If prices touch or move outside the channel it is a tradi
BTMM State Engine Pro by G-Labs — Beat The Market Maker indicator for MetaTrader 4. Asian session range, London and New York kill zones, level progression (L1/L2/L3), peak formation detection (PFH/PFL), entry signals, and a multi-pair scanner from one chart. Stop scanning charts one pair at a time. The State Engine tracks the BTMM daily cycle automatically — Asian box, room boundaries, level blocks, peak formations, and filtered entries — while the scanner dashboard shows level, peak status,
Scalper Inside PRO は日中トレンドの分析を助け、エントリー前にトレードを組み立てられるインジケーターです。中核となるのは、相場をより正確に読むための3つの専用ストラテジー。シグナルが出た瞬間に方向を自動で判断し、主要な価格帯を計算するので、想定エントリーポイント、予想ストップロス、複数の利確レベルを前もって確認できます。詳細なパフォーマンス統計が、各銘柄とストラテジーが過去にどう機能したかを示し、今の相場に合った資産選びを助けます。単体のスキャルピングツールとしても、あなたのシステムの一部としても、自作 EA のベースとしても使えます。MetaTrader 4 プラットフォームで動作します。 インジケーターはエントリー、3つの利確レベル - TP1、TP2、TP3、そして任意のストップロスをチャート上に直接表示します。自作の矢印インジケーターを接続し、その統計と収益性を検証することも可能です。 ご購入後は直接ご連絡ください。専用のボーナス add-ons、実トレードでの活用に関する追加情報、そしてご自身のトレードシステムや EA への正しい接続のサポートをお渡しします
Binary Booster
Yaroslav Varankin
5 (1)
Binary Options Trading Indicator: A Reliable Tool for Your Trades This indicator is specifically designed for binary options trading and has proven its high quality, reliability, and adequate accuracy, depending on the dynamics of the chart. Key Points: Signal Interpretation: When a blue cross signal appears, it indicates a potential entry into a trade, though it is considered a weak signal on its own. However, if the blue cross is accompanied by an arrow, it is considered a more reliable buy s
Beast Super Signal
Florian Zuercher
4.73 (89)
収益性の高い取引機会を簡単に特定するのに役立つ強力な外国為替取引インジケーターをお探しですか?ビースト スーパー シグナル以外に探す必要はありません。 この使いやすいトレンドベースのインジケーターは、市場の状況を継続的に監視し、新しいトレンドを検索したり、既存のトレンドに飛びついたりします。ビースト スーパー シグナルは、すべての内部戦略が一致し、互いに 100% 合流したときに売買シグナルを発するため、追加の確認は不要です。シグナル矢印アラートを受け取ったら、単に売買します。 購入後、プライベート VIP グループに追加されるようにメッセージを送ってください! (完全な製品購入のみ)。 購入後、最新の最適化されたセット ファイルについてメッセージを送ってください。 MT5バージョンは こちらから入手できます。 Beast Super Signal EA は こちらから 入手できます。 コメント セクションをチェックして、最新の結果を確認してください。 ビースト スーパー シグナルは、1:1、1:2、または 1:3 のリスクと報酬の比率に基づいて、エントリー価格、ストッ
通貨強さウィザードは、取引を成功させるためのオールインワン ソリューションを提供する非常に強力な指標です。このインジケーターは、複数の時間枠のすべての通貨のデータを使用して、このまたはその外国為替ペアのパワーを計算します。このデータは、使いやすい通貨インデックスと通貨パワーラインの形式で表され、特定の通貨のパワーを確認するために使用できます。 必要なのは、取引したいチャートにインジケーターを接続することだけです。インジケーターは、取引する通貨の実際の強さを示します。このインジケーターは、トレンドに合わせて取引するときに有利に利用できる売買高の圧力の極値も示します。このインジケーターには、フィボナッチに基づく可能なターゲットも表示されます。 このインジケーターは、PUSH 通知を含むあらゆるタイプのアラートを提供します。 購入後ご連絡下さい。私の取引のヒントをあなたと共有し、素晴らしいボーナスインジケーターを無料で提供します! 幸せで有益な取引をお祈りします。
現在30%OFF! このダッシュボードは、複数のシンボルと最大9つのタイムフレームで動作するソフトウェアの非常に強力な部分です。 このソフトは、弊社のメインインジケーター(ベストレビュー:Advanced Supply Demand)をベースにしています。    Advanced Supply Demand ダッシュボードは、素晴らしい概要を提供します。それは示しています。  ゾーン強度評価を含むフィルタリングされた需給値。 ゾーン内/ゾーンへのPips距離。 ネストされたゾーンがハイライトされます。 選択されたシンボルの4種類のアラートを全ての(9)時間枠で提供します。 それはあなたの個人的なニーズに合わせて高度に設定可能です。 あなたの利益! すべてのトレーダーにとって最も重要な質問です。 市場に参入するのに最適なレベルはどこか? 成功のチャンスとリスク/リターンを得るために、強力な供給/需要ゾーン内またはその近くで取引を開始します。 損切りの最適な位置はどこですか? 最も安全なのは、強力な供給/需要ゾーンの下/上にストップを置くことです。 最適な利益
A. A2SR とは何ですか ?   * 先行テクニカル指標です (塗り直しなし、ラグなし)。 -- ガイダンス : -- https://www.mql5.com/en/blogs/post/734748/page4#comment_16532516 -- そして https://www.mql5.com/en/users/yohana/blog .. MT5 version:  https://www.mql5.com/en/market/product/140111 A2SR には、サポート (需要) とレジスタンス (供給) のレベルを決定する特別な手法があります。 ネットで見かける通常の方法とは異なり、A2SR は実際の SR レベルを決定する独自のコンセプトを持っています。 元の手法はインターネットから取得されたものではなく、インターネット上で公開されたこともありません。 A2SR は、取引スタイルに応じて SR レベルを自動選択します。 時間枠を変更しても、SR レベルはその位置にとどまります。 実際のSRは、使用する時間枠から取得されるわけではないため. A2SR
Hidden - Delta - Flow is a professional trading system designed to detect hidden changes in market structure through comprehensive analysis of Hidden Divergence and Delta CVD Divergence, enhanced by normalized volume, an adaptive TP/SL model, and verifiable performance statistics. Instead of simply displaying price direction, the system analyzes the relationship between price movement and internal volume activity, allowing it to identify situations where the external price structure begins t
IQ FX Gann Levels a precision trading indicator based on W.D. Gann’s square root methods . It plots real-time, non-repainting support and resistance levels to help traders confidently spot intraday and scalping opportunities with high accuracy. William Delbert Gann (W.D. Gann) was an exceptional market analyst, whose trading technique was based on a complex blend of mathematics, geometry, astrology, and ancient mathematics which proved to be extremely accurate. We don't offer free or bonus indic
KT Renko Patterns MT4
KEENBASE SOFTWARE SOLUTIONS
2.33 (3)
KT Renko Patterns は、すでに開いているライブのレンコチャート上で8種類のパターンを検出し、パターンの形、ストップロスの目安、フィボナッチ目標をチャートに直接描画します。 最初にレンコチャートを準備してください。 MetaTrader は標準ではレンコチャートを生成しません。任意のジェネレーターでライブのレンコチャートを開き、そのチャートに本インジケーターを追加してください。本インジケーターはレンコブリックを分析します。ブリックの生成や注文の発注は行いません。 新しいブリックが形成されるたびに、W-M、Power Pennant、AB=CD、Triple Top と Triple Bottom、Double Top と Double Bottom、Two Back Strike、ZigZag Bricks、Swing Breakout を探します。検出されたセットアップには名前が付き、構造がチャートに描画されるため、すべてのブリックを手作業で確認する必要がありません。検出済みのパターンはチャートに残り、再描画されません。 チャートに表示される内容 パターン構造: 色分け
Super Signal – Skyblade Edition プロ仕様のノンリペイント / ノーラグ・トレンドシグナルシステム。卓越した勝率を実現 | MT4 / MT5 対応 1分足、5分足、15分足などの低い時間足で最も効果を発揮します。 主な特徴: Super Signal – Skyblade Edition は、トレンド取引に特化したスマートなシグナルシステムです。マルチレイヤーのフィルターロジックを用いて、明確な方向性と実際のモメンタムに支えられた強力なトレンドのみを検出します。 このシステムは 天井や底を予測するものではありません 。次の3つの条件がすべて満たされた場合にのみシグナルを発生させます: 明確なトレンド方向 モメンタムの増加 健全なボラティリティ構造 市場セッションに基づく流動性分析と組み合わせることで、シグナルの精度とタイミングがさらに向上します。 シグナルの特性: すべての矢印シグナルは 100% 非リペイント / 遅延なし 一度出現したシグナルは固定され、点滅・消失しません チャート上の矢印、情報パネル、ポップアップ通知、音声アラート、プッシュ通知
発見が困難で頻度が少ないため、分岐は最も信頼できる取引シナリオの1つです。このインジケーターは、お気に入りのオシレーターを使用して、通常の隠れた分岐点を自動的に見つけてスキャンします。 [ インストールガイド | 更新ガイド | トラブルシューティング | よくある質問 | すべての製品 ] 取引が簡単 通常の隠れた発散を見つけます 多くのよく知られている発振器をサポート ブレイクアウトに基づいて取引シグナルを実装します 適切なストップロスおよび利益レベルを表示します 設定可能なオシレーターパラメーター カスタマイズ可能な色とサイズ バー単位でサイズ別に分岐をフィルタリング パフォーマンス統計を実装します 電子メール/音声/視覚アラートを実装します 幅広い市場の見通しを提供するために、異なるオシレーターを使用して、干渉なしで同じチャートにインジケーターを何度もロードできます。このインジケーターは、次のオシレーターをサポートしています。 RSI CCI MACD オスマ 確率的 勢い 素晴らしい発振器 加速器発振器 ウィリアムズパーセントレンジ 相対活力指数 特に外国為替市場では、
Overview  Market Structure Analysis Indicator MT4 Structure Analysis Indicator   automatically identifies Market Structure based on Smart Money Concepts (SMC). It clearly displays Break of Structure (BoS), Change of Character (CHoCH), Higher Highs, Higher Lows, Lower Highs, and Lower Lows in real-time. Key Features Automatic Market Structure Detection   Break of Structure (BoS)   - Price breaks previous structure in trend direction   Change of Character (CHoCH)   - Trend reversal sig
Built-in multi-symbol scanner — traffic-light grid for up to 30 pairs across four timeframes. No separate scanner file required. BUY, SELL, WAIT cells with confluence score and recent structure event. Full alignment with AI Trade Idea — current chart cell reads live engine data so scanner, dashboard, and AI panel always show the same verdict, score, and reason. Per-cell explain popup — four-section breakdown of what is happening, how the score was built, what to look for, and what to watch out
Friends, we present to your attention our new Forex Gump Laser indicator. Since there are no designers in our team, but mainly mathematicians, financiers, programmers and traders, we did not make any special changes in the indicator design. In appearance, it resembles the usual Forex Gump. On the other hand, Forex Gump has become not just the name of an indicator, it is a brand. And we try to preserve the corporate identity in all its varieties. The whole essence of the indicator in its operatio
Finesia Scalper - High Probability & Non-Repainting System Discounted   Price   !!     Secure the Lowest Price Today. Next The price will increase to   250 USD . Are you looking for a powerful, high-probability trading indicator that removes the guesswork from your chart? Finesia Scalper is a professional-grade, 100% non-repainting trading tool designed to provide you with ultimate precision. Built on a proven algorithm, this indicator seamlessly combines three highly effective trading methodolo
Miraculous Indicator – ガン・スクエア・オブ・ナインに基づく100%非リペイントのFXおよびバイナリーツール この動画では、FXおよびバイナリーオプションのトレーダー向けに特別に開発された、非常に正確で強力な取引ツールである Miraculous Indicator を紹介しています。このインジケーターがユニークなのは、伝説的な ガン・スクエア・オブ・ナイン と ガンの振動の法則 に基づいている点で、現代の取引で利用できる最も正確な予測ツールの一つとなっています。 Miraculous Indicatorは 完全に非リペイント であり、ローソク足が確定した後にシグナルが変化したり消えたりすることはありません。つまり、見たものがそのまま利用できます。これにより、トレーダーは自信を持ってエントリーおよびエグジットを行うための信頼性と一貫性のある根拠を得ることができます。 主な特徴: ガン・スクエア・オブ・ナインとガン理論に基づいて構築 100%非リペイントのシグナルシステム すべての時間枠(M1、M5、H1、H4、日足、週足)で機能 FXおよびバイナリーオプション取引
Money Flow Profile MT5 HERE   Here   our more valuable tools SMC Trend Trading   ,  Easy SMC Trading  ,  Institutional SMC Architect Volume Analysis Tools  ,  Volume flow Profile  ,  Market volume profile  , FVG with Volume  , Liquidity Heatmap Profile  ,  Volume Spread Analysis This Master Edition is engineered for clarity and speed, featuring a unique Auto-Theme Sync system that instantly beautifies your chart layout upon loading. Key Features: True Money Flow Calculation: Goes beyond stand
作者のその他のプロダクト
Now free. Plan every trade before you click, see your real risk, reward and lot size right on the chart. Plan the trade. See the risk. Trade with confidence. Trade Planner Pro turns any chart into a visual trade-planning workspace. Drag three lines — Entry, Stop Loss and Take Profit — and instantly see your risk/reward ratio, the exact lot size for your chosen risk %, the real money you put on the line, the spread cost, and clear warnings before you commit. No more manual lot math, no more gu
FREE
Now free. The key Fibonacci pivot levels, drawn for you automatically every day, on any timeframe. Automatic Fibonacci Pivots calculates the daily support and resistance from the Fibonacci sequence and plots them clean on your chart: the daily pivot, S1/S2/S3 below and R1/R2/R3 above. These are the price zones where the market tends to react, bounce or break, and now you see them without drawing a single line. What it does: - Daily Fibonacci pivot levels (pivot, S1/S2/S3, R1/R2/R3), updated
FREE
異なる通貨ペアやタイムフレームを監視するために複数のチャートを切り替えるのに疲れましたか? Pairs and TF Changer インディケーターがあなたのトレード体験を革新します! すべての戦略インディケーターを読み込んだら、 Pairs and TF Changer をチャートに追加します。必要に応じて、その位置、色、または表示する列数を調整できます! 主な特徴: シームレスな統合: このインディケーターを簡単にトレーディング戦略に統合できます。 ワンクリックで、すべての通貨ペアとタイムフレームを単一のチャートで取引できます。 追加のチャートを切り替えたり開いたりする必要がなくなります。 高度にカスタマイズ可能: チャート上の任意の位置にその位置を調整します(上、下、左、右)。 ボタンの1行または10行を表示するように設定できます。 トレーディングテーマに合わせて色をカスタマイズできます。 チャートを清潔で整然と保つためにボタンを透明にします。 ユニバーサルな互換性: すべての種類のインディケーターと戦略に対応しています。 外為、金属、米国株、指数、石油、先物、暗号通貨など、す
FREE
Now free. Know your real spread, and know exactly what it costs you on every trade. Know your real spread. Know what it costs you. Real Spread Monitor puts the one number most traders ignore right on your chart: the real bid/ask spread, live, and exactly what it costs you per trade. Scalpers and intraday traders lose money to the spread every single day. This tool shows you when the spread is normal, when it is too wide to trade, and how it behaves hour by hour — so you trade with your eyes o
FREE
「MultiSymbol & TF Chart Integrated」インジケーターは、迅速に包括的な市場ビューを提供するために設計されており、好みの時間枠で最大60の通貨ペアを単一のチャートで監視すること(複数モード)や、すべての時間枠で取引しているペアを表示すること(シンプルモード)を可能にします。 主な利点: 完全監視: 単一のチャートで希望するすべてのペアを一目でリアルタイムで監視できます。 時間節約: チャート間の切り替えを避け、各ペアの動きをリアルタイムで確認できます。 トレンド分析: トレンドフォローのトレーダーに最適で、意思決定前にトレンドを確認するために上位の時間枠を見ることができます。 極端なカスタマイズ: インジケーターのすべての側面を特定のニーズに合わせて調整します。 極端なカスタマイズ: 高度に設定可能なインジケーターパラメーター: シンボルと時間枠: 最大60の異なるシンボルを設定できます。 各シンボルには独自の時間枠を持つことができます(例:M1、M5、M15、M30、H1、H4、D1、W1、MN1)。 表示モード: シンプルモード: 特定の時間枠で単一
FREE
Forex Inspector Broker X-Ray See exactly what your broker charges, and how it compares, in one clean panel on your chart. ForexInspector Broker X-Ray reads your live account conditions and shows them in a professional tabbed panel: real spread, true cost per lot (spread plus commission), swaps in money, leverage, margin, execution type, stop-out, ping and a 0 to 10 broker score. It also shows how your broker ranks against the community on forexinspector.com. 100% FREE  •  It never trades  •  It
FREE
Aurum Apex Mt4 EA
Martin Alejandro Bamonte
5 (2)
AURUM APEX: The 2026 Gold Standard in Automated Trading XAUUSD 専用に設計された高頻度(HFT)エキスパートアドバイザー(EA) 。MT4 & MT5 に対応 MT5 バージョン: https://www.mql5.com/en/market/product/179737 各口座の investor(閲覧専用)ログイン情報は以下のとおりです: MetaTrader 4 • 口座番号: 12754297 • Investor パスワード: BinaryforexeaAurum-MT4 MetaTrader 5 • 口座番号: 52904796 • Investor パスワード: BinaryforexeaAurum-MT5 少額の資金から始めても、大きな資金から始めても、Aurum Apex は自動的に適応します。スピードを求めるときは積極的に複利で増やし、落ち着きを求めるときは極めて小さなドローダウンで安定して進みます。アクセルは常にあなたの手の中にあります。 必要条件 口座タイプ: RAW または ECN のみ
「Scalping Signal No Repaint No Lag」は、どのチャートにドラッグしても、テンプレートや他のインジケーターをロードする必要なく、必要なすべてのインジケーターを自動的にロードする市場で唯一のインジケーターです。提供された画像とまったく同じようにチャートを自動的に設定します。このインジケーターはリペイントや遅延のないシグナルを保証し、すべての通貨ペアおよび時間枠(TF)でのスキャルピング戦略に最適です。 機能 インジケーターの自動ロード :インジケーターを任意のチャートにドラッグすると、追加の必要なインジケーターがすべて自動的にロードされ、設定された好みに応じてチャートが設定されます。ただし、設定からパラメータを変更することもできます。 チャートの可視化 :日本のローソク足や特定の色を使用して、視覚化を改善するためにチャートのプロパティを調整します。背景やローソク足の色は必要に応じて変更できます。 シグナル生成 :2つの移動平均線の差およびRSIとそのEMAのクロスオーバーを使用して、買いと売りのシグナルを生成し、チャートに矢印で表示します。 トレンドの可視化
主な特徴: M15タイムフレームでGBPUSDに最適化: GBPUSDペア専用に設計およびテストされています。 推奨最低口座残高: 低いドローダウンを確保するために、最低$1000の口座残高が必要です。 スプレッドの互換性: 利益を最大化するために、低スプレッドまたはECN口座での使用が最適です。 リスク管理: エクスポネンシャルロット機能を1.0に設定することで無効にするオプションを含み、取引ニーズに応じて調整可能です。 カスタマイズ可能なパラメータ: 調整可能なパラメータの範囲を提供し、ユーザーがEAを自分の取引スタイルとリスク許容度に合わせて調整できるようにします。 GBPUSD Pip Hunter EAのパラメータ説明 MM(マネーマネジメントの切り替え) 説明: マネーマネジメント機能を有効または無効にするための切り替え。 オプション: いいえ: マネーマネジメントを無効にします。 はい: マネーマネジメントを有効にします。 MMType 説明: 使用するマネーマネジメントの種類を指定します。 オプション: いいえ: マネーマネジメントを無効にします。 はい: マネーマネジ
MTFMA(マルチタイムフレーム移動平均)インジケーターは、異なる時間枠で複数の移動平均(MA)を使用して、メインチャートとは別のウィンドウで買いと売りのシグナル(リペイントしない)を提供します。これは、短時間枠でのスキャルピングや長時間枠での長期取引の両方に適しており、多用途で解釈が簡単です。 なぜマルチフレームなのか? マルチフレームという用語は、インジケーターが複数の時間枠のデータを使用および組み合わせる能力を指します。MTFMAは、4つのカスタマイズ可能な移動平均(MA)に基づいてシグナルを計算して表示します。各MAは、異なる期間、計算方法、および価格タイプに調整できるため、トレーダーは1つのチャートで短期および長期のトレンドの組み合わせを見ることができます。 重要なポイント: 多用途性:分から月まで、あらゆる時間枠で使用可能。スキャルピングから長期取引まで適しています。 リペイントしない:シグナル(上矢印または下矢印)が生成されると、その色は変わらず、トレーダーが生成されたシグナルに基づいて取引判断を行うことができます。 簡単な解釈:買いと売りのシグナルは、下部インジケーター

NextCandlePredictor インジケーター NextCandlePredictorは、再描画しない、色が変わらない、動かない、消えない、遅延がないアラート付きのシグナルインジケーターです。あらゆるタイムフレームで次のキャンドルまたはその次のキャンドルの方向を識別するのに役立ちます。ニューヨーク、ロンドン、またはその両方の重なり合う高ボラティリティ市場に特にお勧めです。 主な特徴: タイムフレームの汎用性: M1からH1以上のあらゆるタイムフレームで迅速かつ正確なシグナルを提供します。 明確な買い/売りシグナル: ADXのDI+とDI-ラインを使用して明確な買いと売りのシグナルを生成し、最良のトレード判断を下せるようにします。 直感的な視覚化: シグナルはチャート上に緑色(買い)と赤色(売り)の矢印で直接表示され、迅速かつ簡単に読み取れます。 カスタマイズ可能な設定: 分析するバーの数とアラートオプションを好みとトレード戦略に応じて調整できます。使用するTFに応じた提案表を以下で確認してください。 即時およびオプションのキャンドル終了時アラート: デフォルトでは、ADX条件が
GoTrend Multi-Timeframe インディケーター "GoTrend Multi-Timeframe" インディケーターは、異なる時間枠で通貨ペアの全体的および特定のトレンドを迅速かつ効率的に評価するためのトレーダーにとって必須のツールです。 このインディケーターは、トレーダーが市場の方向性を一目で明確かつ包括的に把握し、意思決定を最適化し、取引戦略の効果を高めることを可能にします。 主な特徴: マルチタイムフレーム分析: このインディケーターは、M5、M15、M30、H1、H4、D1の6つの異なる時間枠の詳細な分析を提供し、トレーダーが各期間のトレンドを理解できるようにします。 統合されたテクニカル指標: インディケーターは、RSI、SAR、MA、MACD、およびADXの5つの強力なテクニカル指標を使用して、各時間枠でのトレンド方向を決定します。 明確で直感的な視覚化: 信号は、直感的なシンボルと色でメインチャートの選択したコーナーに表示されます。これにより、トレーダーは一目で市場の状況を評価できます。 組み合わせ信号: 各指標の個別の信号に加えて、"GoTrend M
Gold Vertex EA
Martin Alejandro Bamonte
Gold Vertex EA is a reliable and stable option for those looking to automate their trading in the gold market. With a robust system based on one of the most effective indicators and a solid trend-following strategy, Gold Vertex EA is a powerful tool for traders who want precise, worry-free trading. Requirements Platform : MetaTrader 4 Supported Instruments : Specifically developed and configured for Gold (XAUUSD) Recommended Account Type : ECN or low spread Minimum Deposit Recommended : $100 Tim
Inferno Signals EA
Martin Alejandro Bamonte
Inferno Signals EA は、市場の大きな動きを利用するために設計されており、安定した M30 タイムフレームで動作します。 これは、少額の資金で取引を開始したい人に最適で、ペアごとにわずか 100 ドルから始めることができ、自動的な資金管理機能を備えています。これには、動的なロット調整とストップロス(SL)などの安全レベルが含まれます。 低いドローダウンと、最良のチャンスを捉えることに焦点を当てた戦略により、Inferno Signals EA は投資の安全性を損なうことなく収益を最大化することを目指しています。この EA は過剰な取引を避け、特定のゾーンでのみ取引を開き、強いトレンドの継続と可能な反転ポイントの両方を検出します。価格が最適なエリアにあるとき、Inferno Signals EA は行動し、一貫して取引を行いますが、明確なチャンスがない場合は一時停止します。 EA の操作方法: EA は Buy Stop と Sell Stop などの保留中の注文を使用し、それらは必要に応じて BUY または SELL の取引に変換され、常に安全なストップロス(SL)で保
The MarketPrice Indicator is designed to provide a quick, one-glance visualization of the trend direction for a currency pair across all time frames (Time Frames), streamlining decision-making. MarketPrice Indicator is based on daily levels and trading signals derived from moving average crossovers and market strength according to various technical indicators. It comes fully configured, though you can, of course, modify any parameters as desired. Indicator Logic The indicator uses a combination
ヒット率トップボトムシグナル ヒット率トップボトムシグナル ヒット率トップボトムシグナル は、完全に革新的なアプローチを提供します。 特定のTP-SLとPAIRS/TFで最も優れたパフォーマンスを発揮する方法を事前に評価したい方に理想的です。 ヒット率トップボトムシグナル 戦略は、 すべてのトレーダーとトレードスタイル にとって基本的なツールです。これは、 リペイントしない精度の高いシグナル を提供し、どのタイミングでどの方向に取引するかを明確に示すだけでなく、各通貨ペアとTFの ヒット率を詳細に記録 し、あらかじめ設定されたテイクプロフィット(TP)とストップロス(SL)を提供するためです。 これにより、シグナルの有効性の比率を事前に知ることができ 、リスク管理と正確な取引に非常に重要です。 この戦略の特徴は、全体的な動きではなく、インパルス内のリバーサルポイントの検出に焦点を当てている点で、従来のトップボトムよりも頻繁にシグナルが発生し、 市場の重要な各変動のキーとなる瞬間に焦点を当てています。 このシグナルの歴史的な効果を%で表示する SL/TP比率との組み合わせ により、こ
Candle Probability Scalper 使用ガイド このインジケーターはスキャルピングを簡単かつ100%直感的にします。 Candle Probability Scalper は、 リアルタイム で現在のローソク足における買い手と売り手の強さのパーセンテージを一目で表示します。 パーセンテージは各ティックごとに更新されるため、秒ごとに買い手と売り手が何をしているのかを知ることができ、遅延はありません。これにより、各勢力の強さを判断または確認し、価格の動向を予測するのに大いに役立ちます。 以下は使用方法のガイドです: 1. M1での買い手と売り手のパーセンテージを確認し、他の時間枠(M5、M15)で確認する: M1での買い手のパーセンテージが60%以上 で、M5およびM15でもM1と一致して60%以上である場合、 買い の良いシグナルがあります。 M1での売り手のパーセンテージが60%以上 で、M5およびM15でもM1と一致して60%以上である場合、 売り の良いシグナルがあります。 これにより、勢いが一時的ではなく、方向性が堅固であることが確認されます。 非常にシンプ
Last 50 Pips
Martin Alejandro Bamonte
Last 50 Pips インジケーターは、最近の価格動向に基づいて買いと売りのチャンスを素早く特定するために設計されています。直近のローソク足の価格変動を測定し、価格が方向を変える可能性がある瞬間を黄色で強調表示します。 買いシグナル: インジケーターが 赤 から 黄色 に変わったとき、 買い ポジションを開く必要があります。これは、下降トレンドから上昇トレンドへの転換を示唆します。簡単さを確認するために画像をご覧ください。 売りシグナル: インジケーターが 緑 から 黄色 に変わったとき、 売り ポジションを開く必要があります。これは、上昇トレンドから下降トレンドへの転換を示唆します。 アラート: インジケーターはまた、音声、メール、またはプッシュ通知を通じてリアルタイムアラートを受け取るオプションを含んでおり、ユーザーがどのデバイスからでも迅速にチャートの新しいシグナルに反応できるようにします。 ご質問があれば、お気軽にご連絡ください :)
毎日、市場の開始時に、 Flashpoints Breakout は前日のデータ(高値、安値、終値)を使用してピボット、サポート、レジスタンスレベルを確認し、2つのブレイクアウトレベル(強気と弱気)を計算します。 このようにして、朝一番に新しいエントリーレベルが準備され、Take Profit (TP) と Stop Loss (SL) の値も提供されるため、追加の計算なしで買いのストップ注文や売りのストップ注文を設定できます。 Flashpoints Breakout を使用すると、毎日1または2の買いのストップ注文と1または2の売りのストップ注文を設定し、期待されるブレイクアウトレベルに基づいて機会を逃さないようにできます。 上部のデータパネルを確認し、注文を設定します — 買い注文が1または2、売り注文が1または2です。パネルには、正確なエントリー値、SL、TPが表示され、チャートにはこれらの値に対応する線も表示されます(画像を参照してください)。 1. 買い操作 (BUY): エントリー 1 "BUY" ==> BUYエリア内: 注文 1: BUYエリア内でBUY STOP。
BUYSELLMAGIC is a non-repainting signal-type trading indicator designed to precisely detect entry points in the market.  Features Reliable and permanent signals : BUYSELLMAGIC signals are final once the candle closes, ensuring they will not be modified or removed from the chart. This gives you the confidence of working with an indicator that keeps its signals stable and trustworthy. Comprehensive alerts : In addition to signals on the chart, you’ll receive notifications via email, pop-up alerts
M1 Easy Scalper
Martin Alejandro Bamonte
4 (3)
M1 EASY SCALPER is a scalping indicator specifically designed for the 1-minute (M1) timeframe, compatible with any currency pair or instrument available on your MT4 terminal. Of course, it can also be used on any other timeframe, but it works exceptionally well on M1 (which is challenging!) for scalping. Note: if you're going to scalp, make sure you have an account suitable for it. Do not use Cent or Standard accounts as they have too much spread! (use ECN, RAW, or Zero Spread accounts) Robustn
Trade Insights Display is the ideal companion for traders who want to operate with clarity and precision. This indicator provides real-time access to critical account data, such as: Balance Equity Margin Spread Swap Remaining time for the current candle . These data points are essential, regardless of the strategy or other indicators you use. Having this indicator always visible allows you to quickly assess your account status, the swap for each pair (helping you avoid high-cost trades), and the
EuroGeddon EA
Martin Alejandro Bamonte
EUROGEDDON EA – 卓越した安定性とリスク管理 EUROGEDDON EA は、 自動適応型インテリジェンス を搭載した全自動のトレーディングロボットで、小規模なアカウントでも安定的に成長できるよう設計されています。 資金の管理とリスクの制御に焦点を当て、あなたの口座をしっかりと守ります。 0.01ロットあたり200ドルという極めて低いリスク設定により、 低ドローダウンでの運用 を実現し、 試してみる価値のあるパフォーマンス を発揮します。 ぜひデモ版をダウンロードして、ご自身で体験してみてください。 バックテストだけに頼らず、私のチャンネルにあるデモアカウントで実際の動きをご確認ください。 経済指標発表中も安定稼働 高インパクトのファンダメンタル要因があっても、EAのロジックは動じません。 重要なニュース中でも、安定して稼働し続けます。 自動適応型インテリジェンス (これがニュース時にも強い理由です) あらかじめ設定されたエントリー間隔やTP(利確ポイント)は、通常時にはそのまま使用されますが、 ボラティリティの急変 を検知すると、リアルタイ

ZeroLag TrendCandle — リペイントなしのリアルタイムローソク足カラーリング&アラートシステム ZeroLag TrendCandle は、高度な Williams Percent Range(WPR)インジケーターの分析に基づく、 リペイントしないリアルタイムトレンド検出ツール です。トレンドの変化、モメンタムの変動、反転の可能性を動的な色分けシステムで視覚化します。 画像に示すように、チャートは直感的かつ見やすく設計されており、トレーダーは現在のマーケットの方向性を瞬時に把握できます。一目で優勢なモメンタムとその強さを識別できます。 主な機能: リペイントなし リペイントなし、 バックペイントなし 、 シグナルが消えることなし 、 リアルタイム取引中の誤アラートなし — 詳細な技術的説明は以下をご覧ください。    チャートに表示された情報はそのまま残ります。 リアルタイム検出(ゼロ遅延) シグナルは現在のローソク足の確定後、即座に生成されます。遅延や再計算はありません。常に確定した価格アクションに基づいて反応できます。 すべての銘柄・時間足に
Candle Fusion Pro — パターン認識 + トレンドフィルター + モメンタムフィルター(リペイントなし) 強力なローソク足パターンを検出し、リアルタイムのトレンドとモメンタム分析でその強さを確認しましょう。 Candle Fusion Pro は、 価格アクションの精度 、トレンド構造、 多層的な確認 を重視するトレーダーのための究極のビジュアルツールです。 主な機能 パターンベースのエントリー :10種類以上の高度な日本のローソク足パターンを検出します: 流れ星(レベル2、3、4) 強気/弱気の包み足(エンゴルフィング) モーニングスター/イブニングスター 十字線およびその派生形 ハンマー(レベル2、3、4) 差し込み線/黒い雲のカバー リペイントなし・遅延なし :矢印やパターンラベルはローソク足が確定した後にのみ表示されます。 見たままが真実です 。 リアルタイム確認 : トレンドフィルター (時間足に応じて自動調整) RSI強度ラベル :色で状態を表示(緑 <30、橙、赤 >70) ADXフィルター :トレンドの継続またはレンジを検出(しきい値は25): 強
ClearView Trend Finder — どれだけ明確か、見えますか? チャートがノイズでいっぱいだと感じたことはありませんか?インジケーターが多すぎて、信号が交差し、分析が逆に難しくなることは? ClearView Trend Finder は視覚的な混乱を完全に排除し、本当に重要なこと、つまり 明確なトレンド に集中できるようにします。 このシステムは、チャートを一切リペイントせず変更もされない、クリーンで正確なビューに変換します。 各ローソク足は、市場の支配的な方向だけを表示するようにフィルタリングされています。これはただのローソク足ではありません。ノイズを取り除き、実際のトレンドを際立たせるために特別に設計されています。チャートの右上には、現在の主要トレンドが上昇中( UPTREND )なのか下降中( DOWNTREND )なのかが明確に表示され、解釈の必要はありません。 ご覧の通り、非常にシンプルです: 迷いなし、解釈不要、混乱なし 。インジケーター内部では複雑な計算が行われていますが、ユーザーは明快で直感的なチャートでトレードできます。 初心者トレーダーに最適
Aurum Apex Mt5 EA
Martin Alejandro Bamonte
AURUM APEX: The 2026 Gold Standard in Automated Trading XAUUSD 専用に設計された高頻度(HFT)エキスパートアドバイザー(EA) 。MT4 & MT5 に対応 MT4 バージョン: https://www.mql5.com/en/market/product/118221 各口座の investor(閲覧専用)ログイン情報は以下のとおりです: MetaTrader 4 • 口座番号: 12754297 • Investor パスワード: BinaryforexeaAurum-MT4 MetaTrader 5 • 口座番号: 52904796 • Investor パスワード: BinaryforexeaAurum-MT5 少額の資金から始めても、大きな資金から始めても、Aurum Apex は自動的に適応します。スピードを求めるときは積極的に複利で増やし、落ち着きを求めるときは極めて小さなドローダウンで安定して進みます。アクセルは常にあなたの手の中にあります。 必要条件 口座タイプ: RAW または ECN のみ
Liquidity Pool Radar maps the price levels where stop-losses cluster, flags the moment price sweeps them and snaps back, and tells you whether that sweep landed on an abnormally wide spread. It turns liquidity theory into a clean, real-time tool you can read at a glance. Full user manual: https://www.mql5.com/en/blogs/post/774413 What makes it different Most liquidity tools stop at drawing levels. Liquidity Pool Radar adds a built-in spread lens: every sweep is checked against the instrument's o
フィルタ:
DanyLbc747
1248
DanyLbc747 2025.09.11 20:33 
 

Simple easy to use indicator. Great product.

lauro1956
5827
lauro1956 2024.08.21 16:30 
 

Fantastic Box Indicator It is not enough to just put a box and if it goes up you buy and if it goes down you sell.

This indicator takes into account the London, Asian, New York sessions... it is well worked...

It makes TP and SL easier for you in your own way

very good indicator

レビューに返信