SupplyDemandZoneLines
- インディケータ
- バージョン: 1.2
- アップデート済み: 12 5月 2025
- アクティベーション: 5

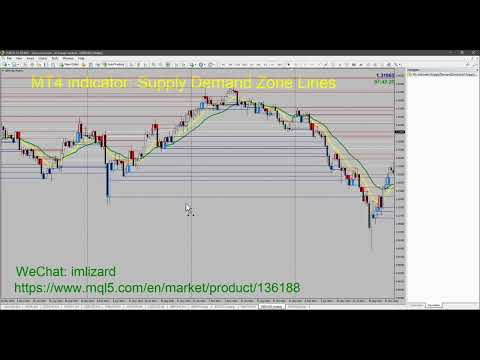
需給ゾーンの主要価格指標
背景
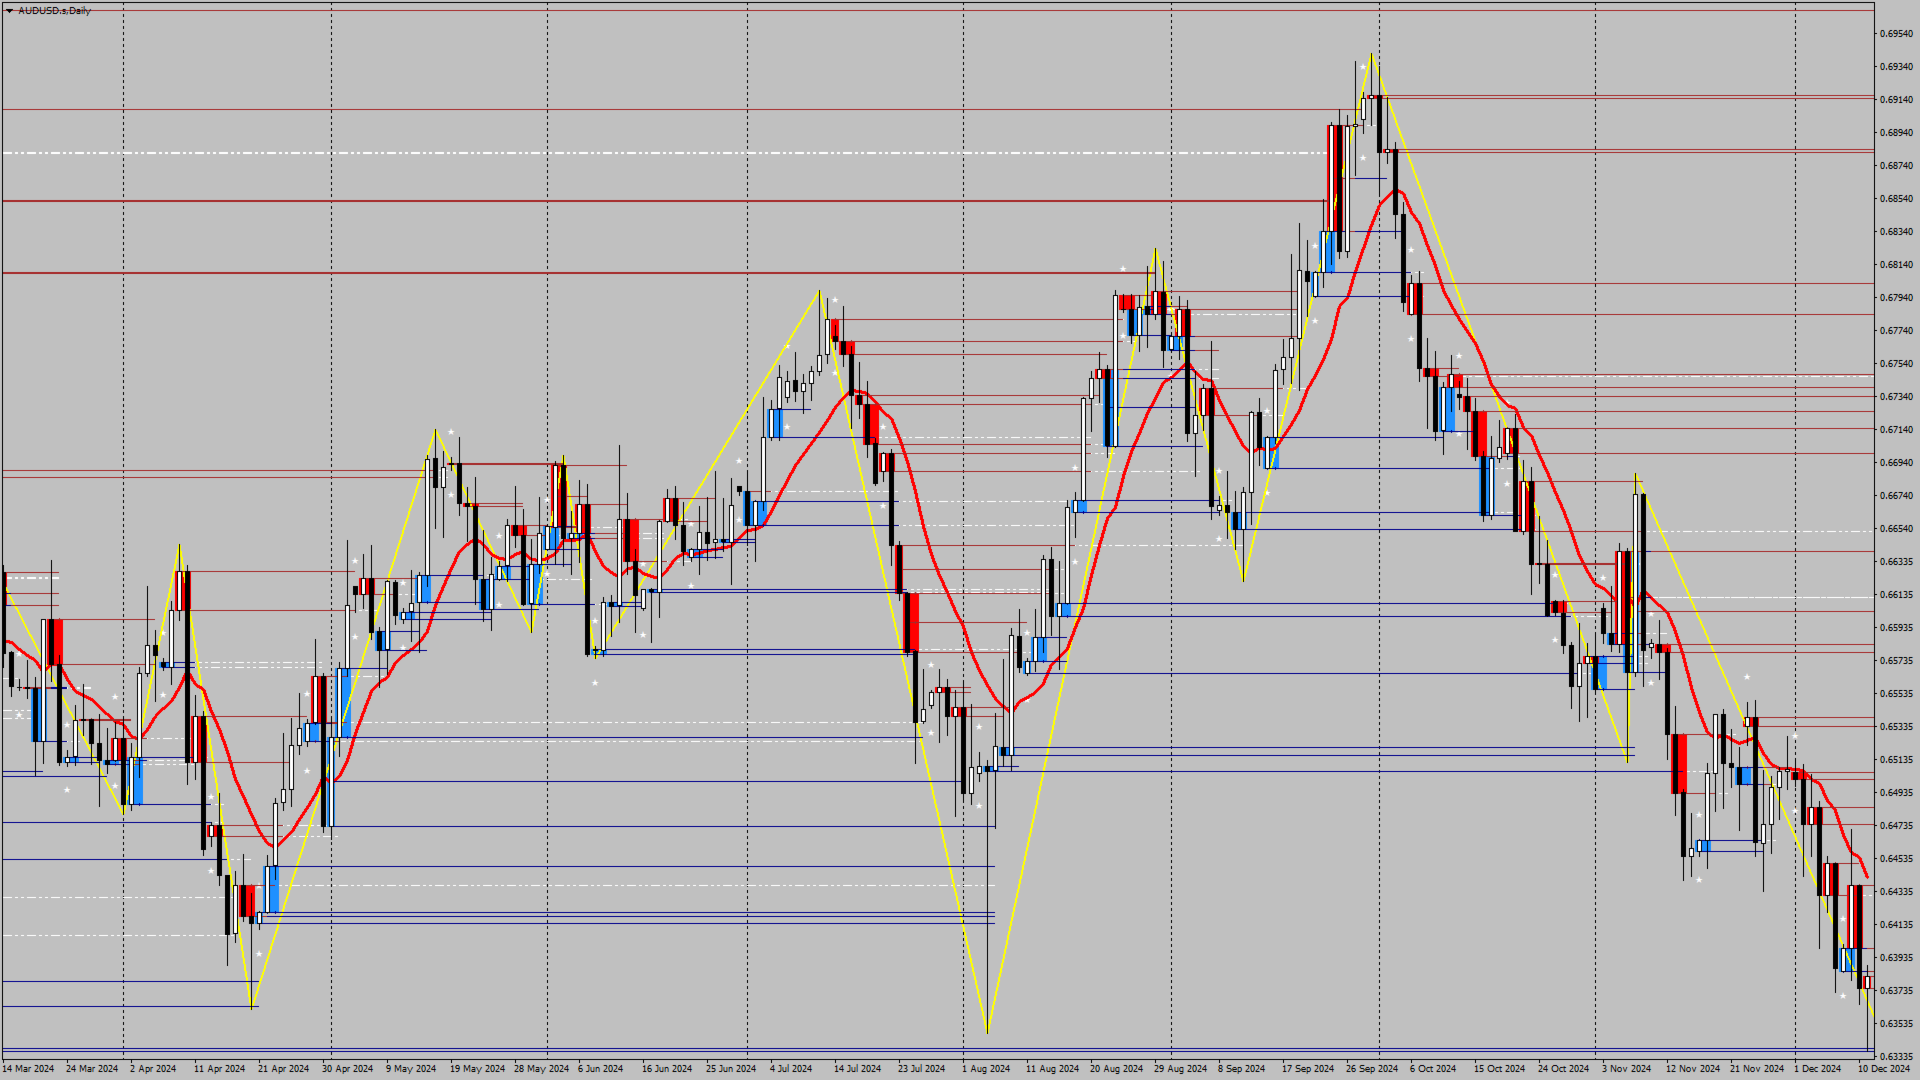
システムはKライン上の需要と供給の領域を自動的に検索し、リアルタイムの主要価格ラインを描画します。トレーダーは価格取引ラインに基づいて取引を行うことができます。
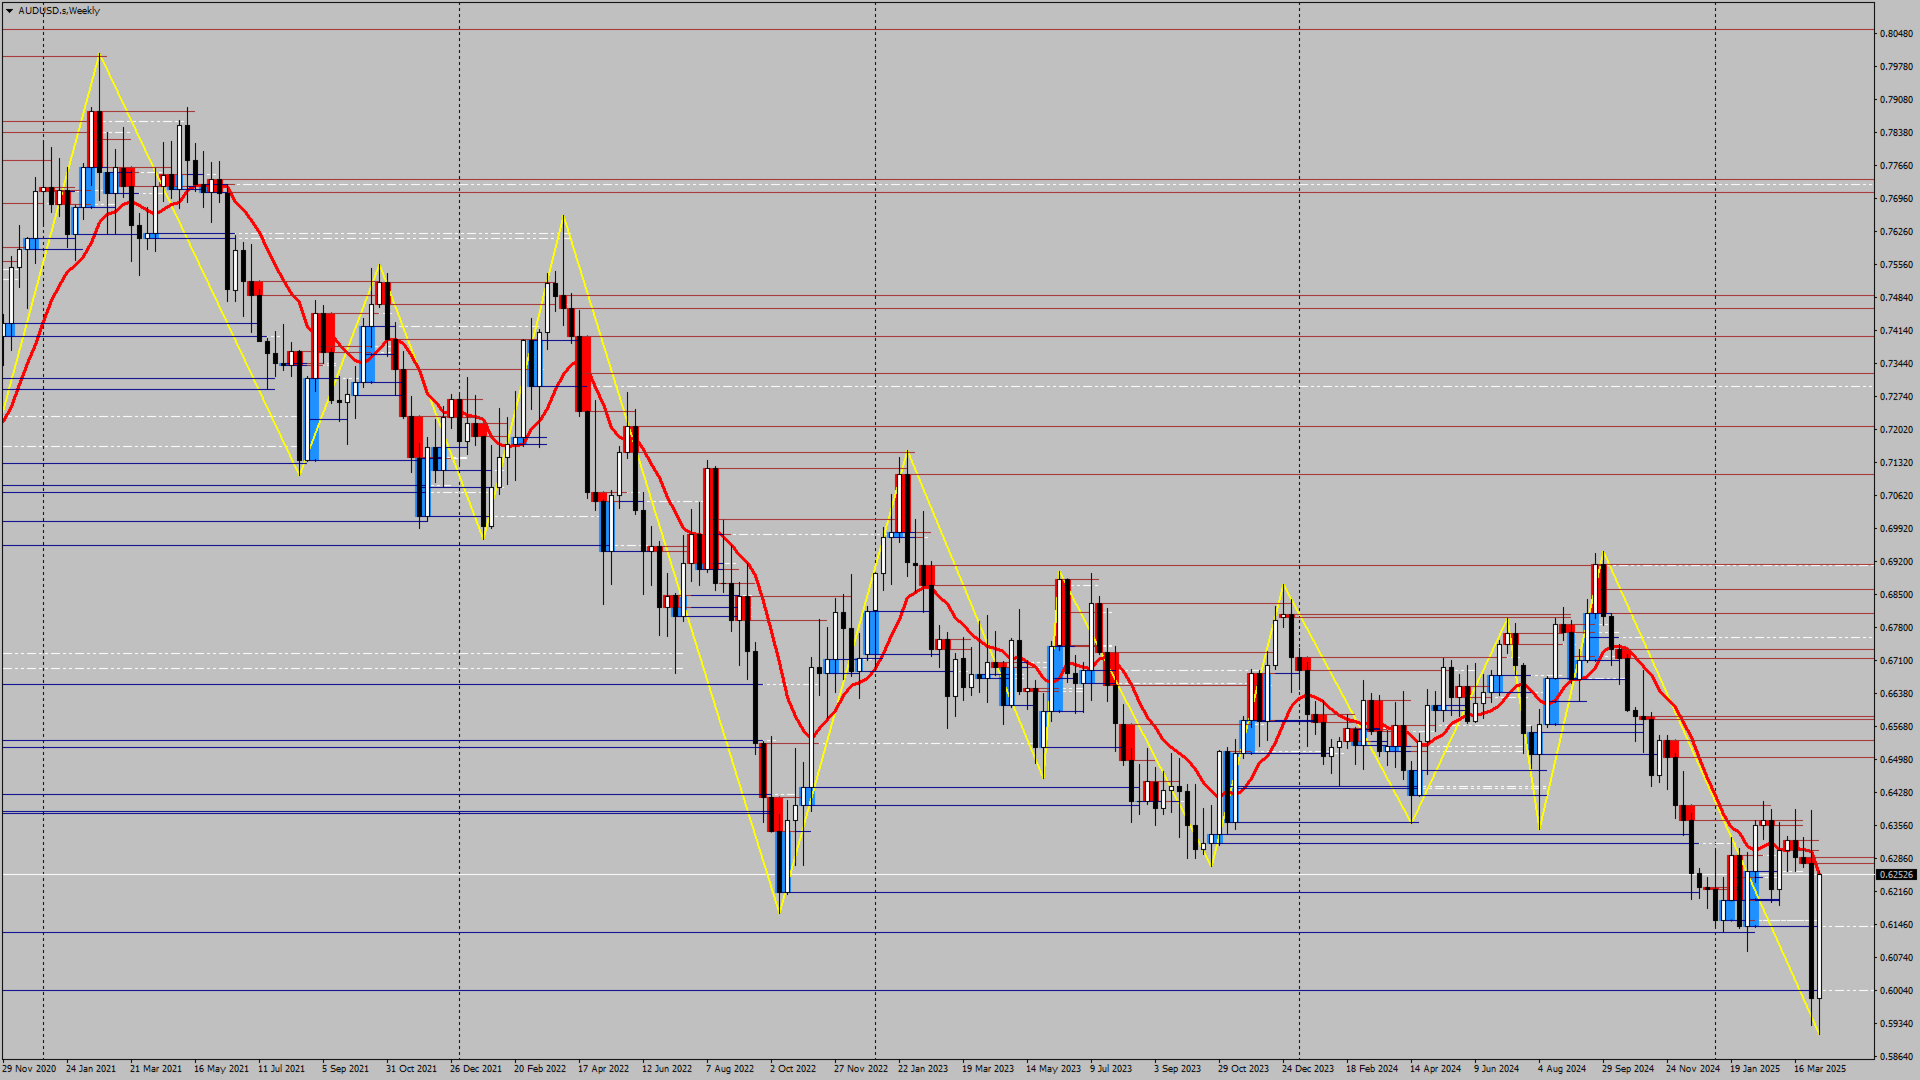
主な特徴
システムはKライン内の供給エリアと需要エリアを自動的に検索します。このシステムはリアルタイムの主要価格ラインも描画し、トレーダーは価格取引ラインに基づいて取引を行うことができます。したがって、需要と供給ゾーン戦略を使用するトレーダーは、需要と供給エリアの兆候を探すのに時間を費やす必要がなくなります。代わりに、需要と供給の領域と主要な価格に対する価格の反応に焦点を当て、自分に合った取引戦略を立てることができます。
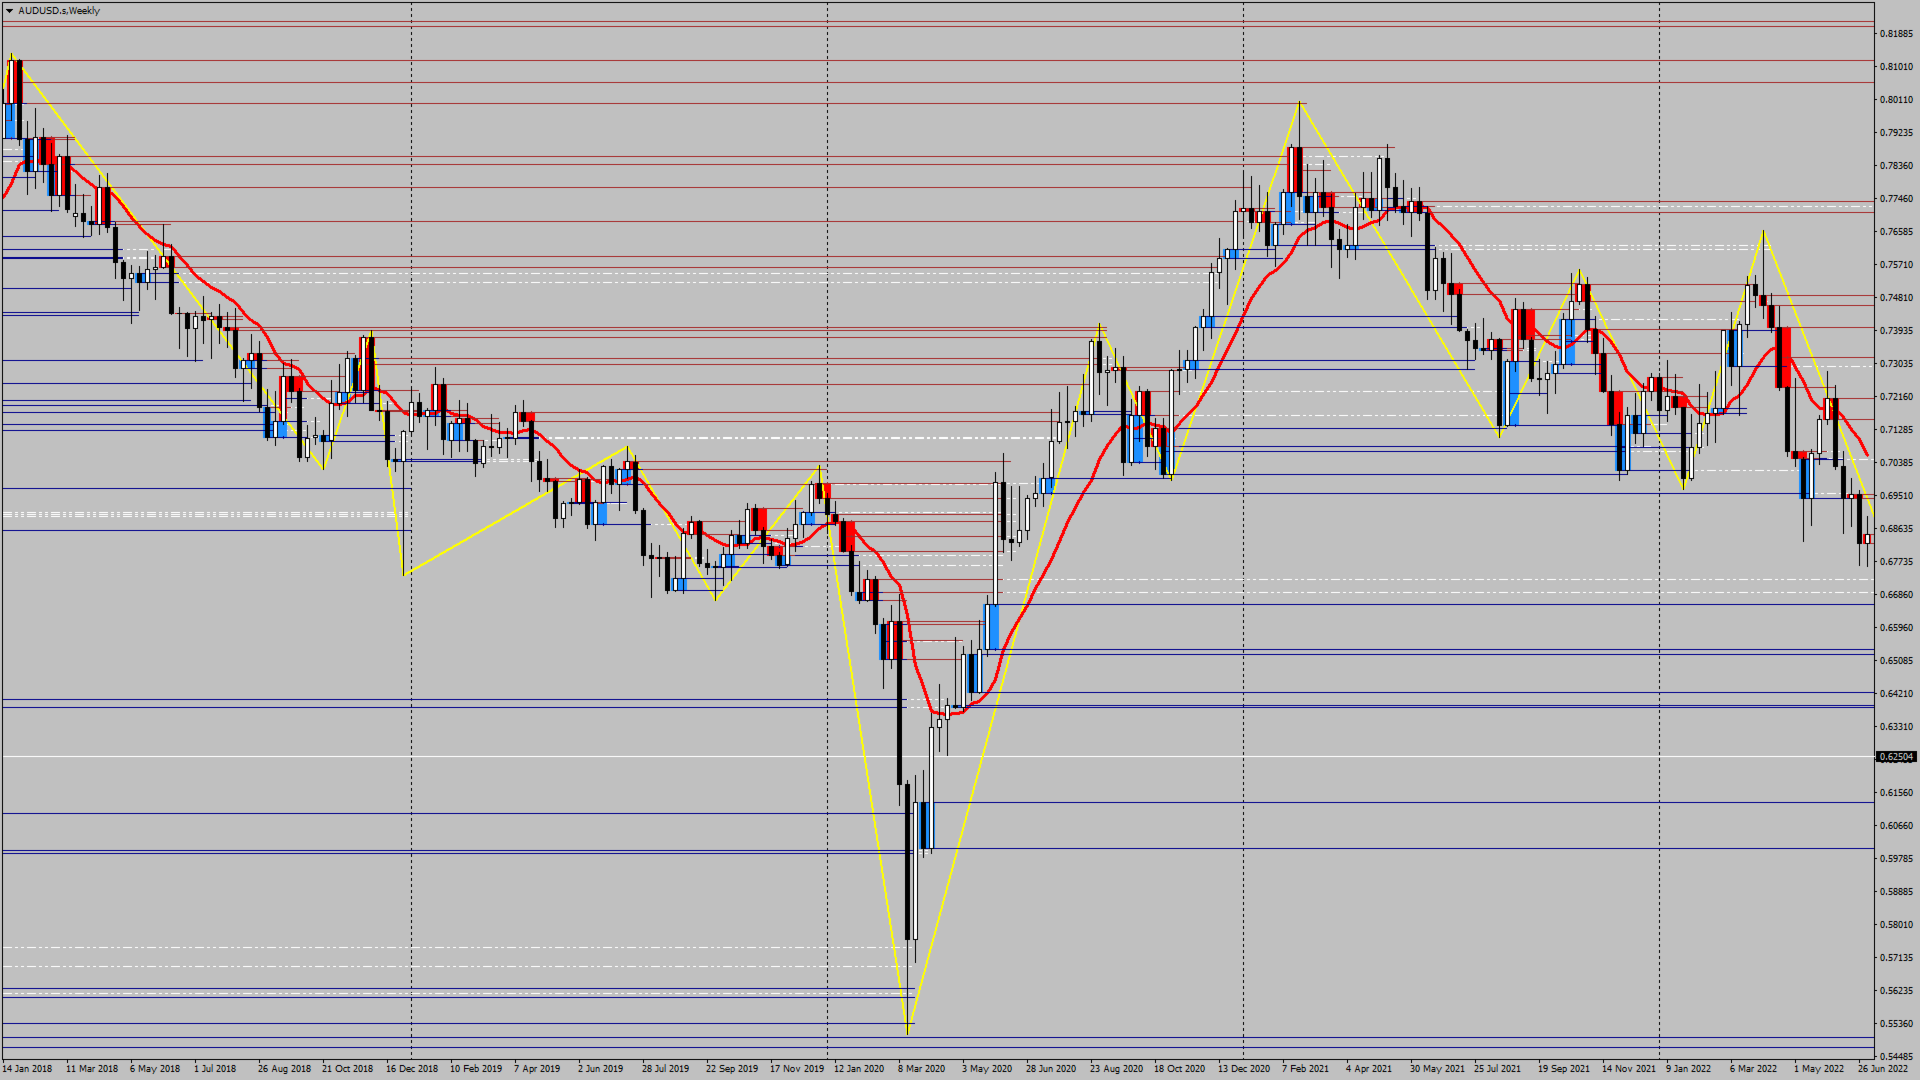
ただし、需給ゾーン戦略自体はボラティリティが高い時期に効果を発揮する戦略であるため、市場が強いトレンドを示している場合には注意して使用するか、インジケーターが提供する示唆をトレンドの方向に活用する必要があります。
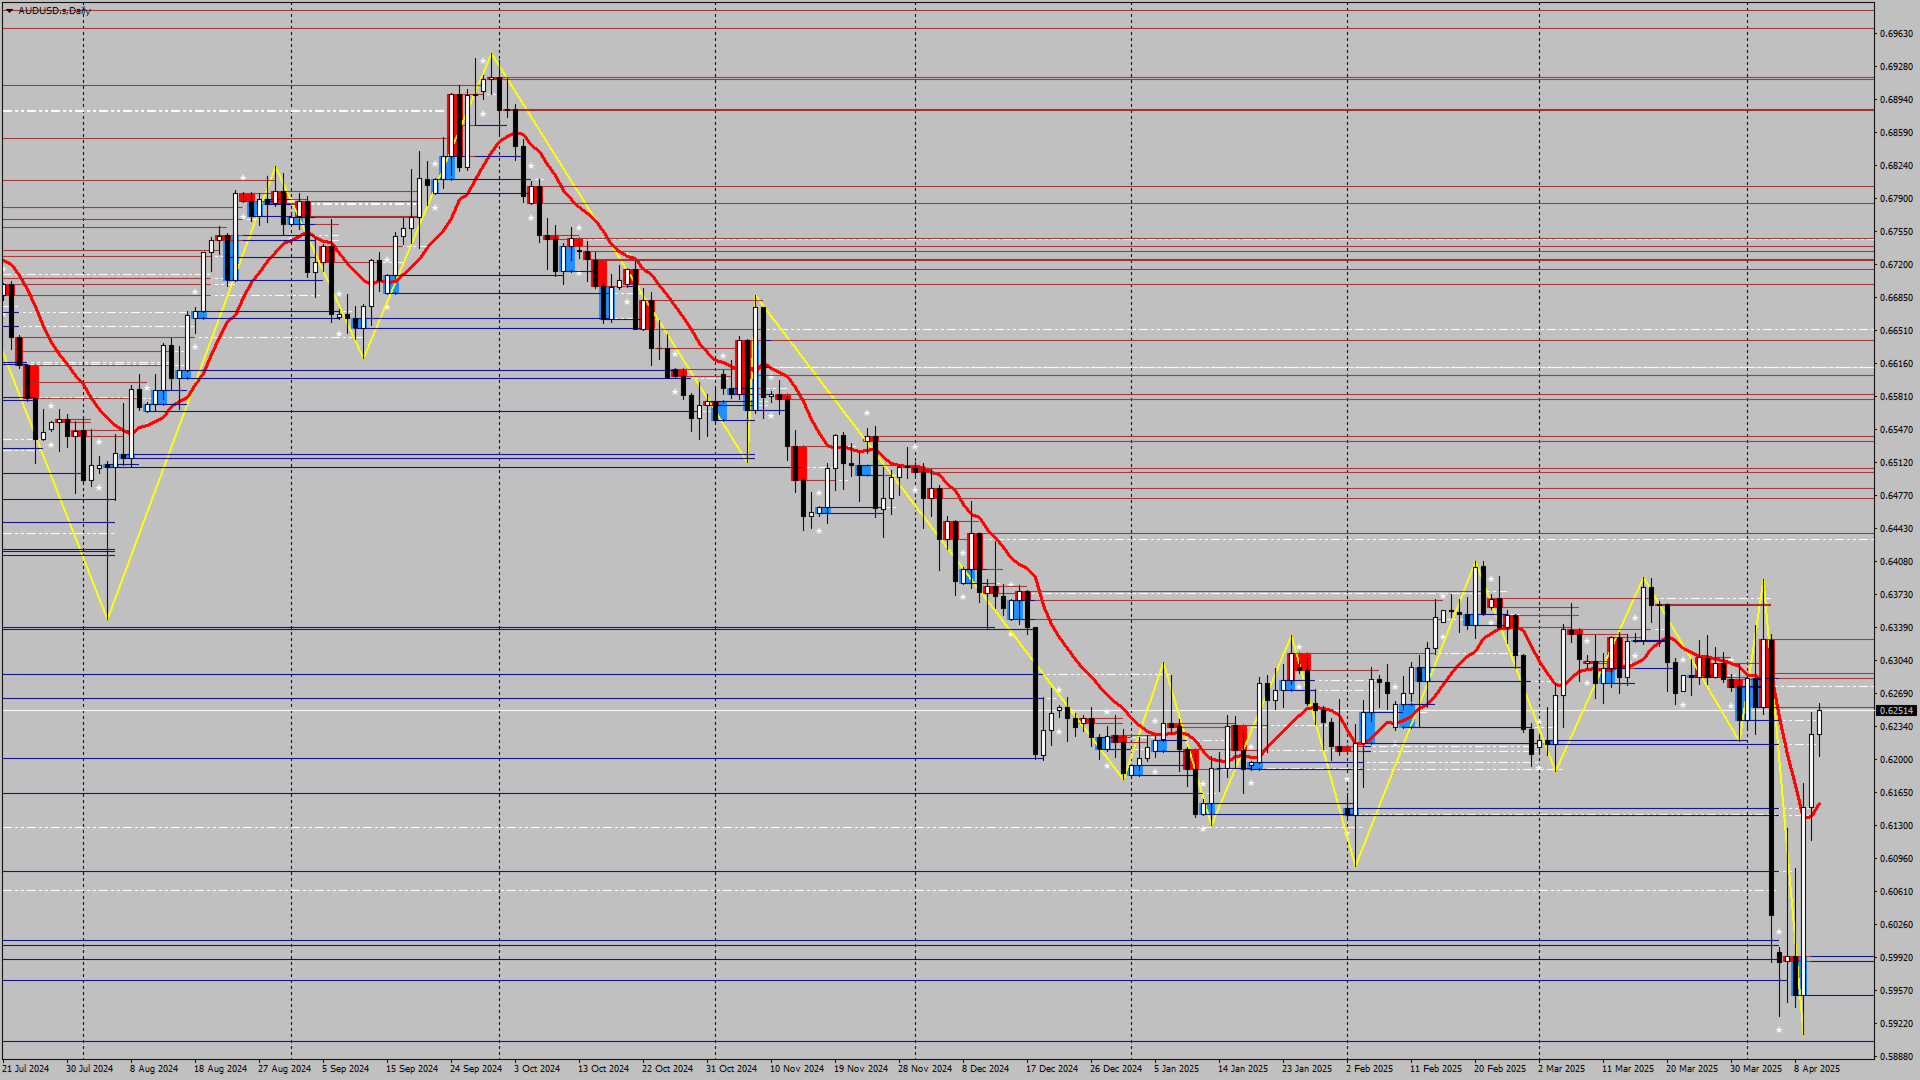
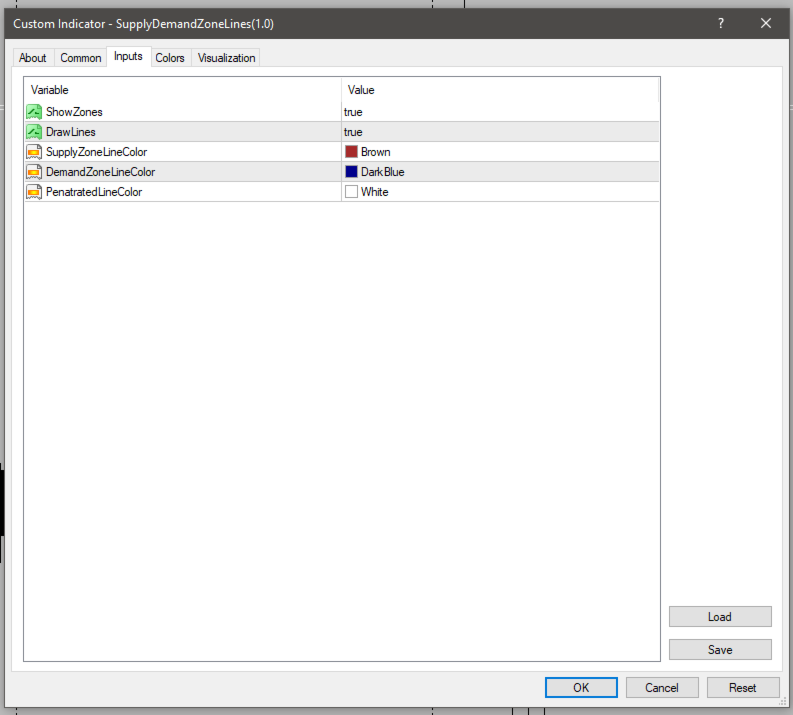
範囲
ShowZones: 供給ゾーンと需要ゾーンを表示するかどうか
DrawLines: 主要価格を表示するかどうか
SupplyZoneLineColor: 供給ゾーンの価格線の色
DemandZoneLineColor: 需要ゾーンの価格線の色
PenatratedLineColor: 突破された価格ラインの色
埋め込む
インジケーターをチャートに添付するだけです。
指標を改善できるよう、貴重なフィードバックをお寄せください。
ご質問がありましたら、WeChat:imlizardまでご連絡ください。