SidewayBox MT5
- インディケータ
-
Komang Putra Riswanjaya
 I am a freelance developer specializing in MQL4, MQL5, and Pine Script, focused on building custom trading solutions for MetaTrader and TradingView platforms.
My services include:
* Expert Advisors (EA)
* Custom Indicators
* Trading Tools & Utilities
* Strategy Automation - バージョン: 2.1
- アップデート済み: 25 6月 2026
- アクティベーション: 5
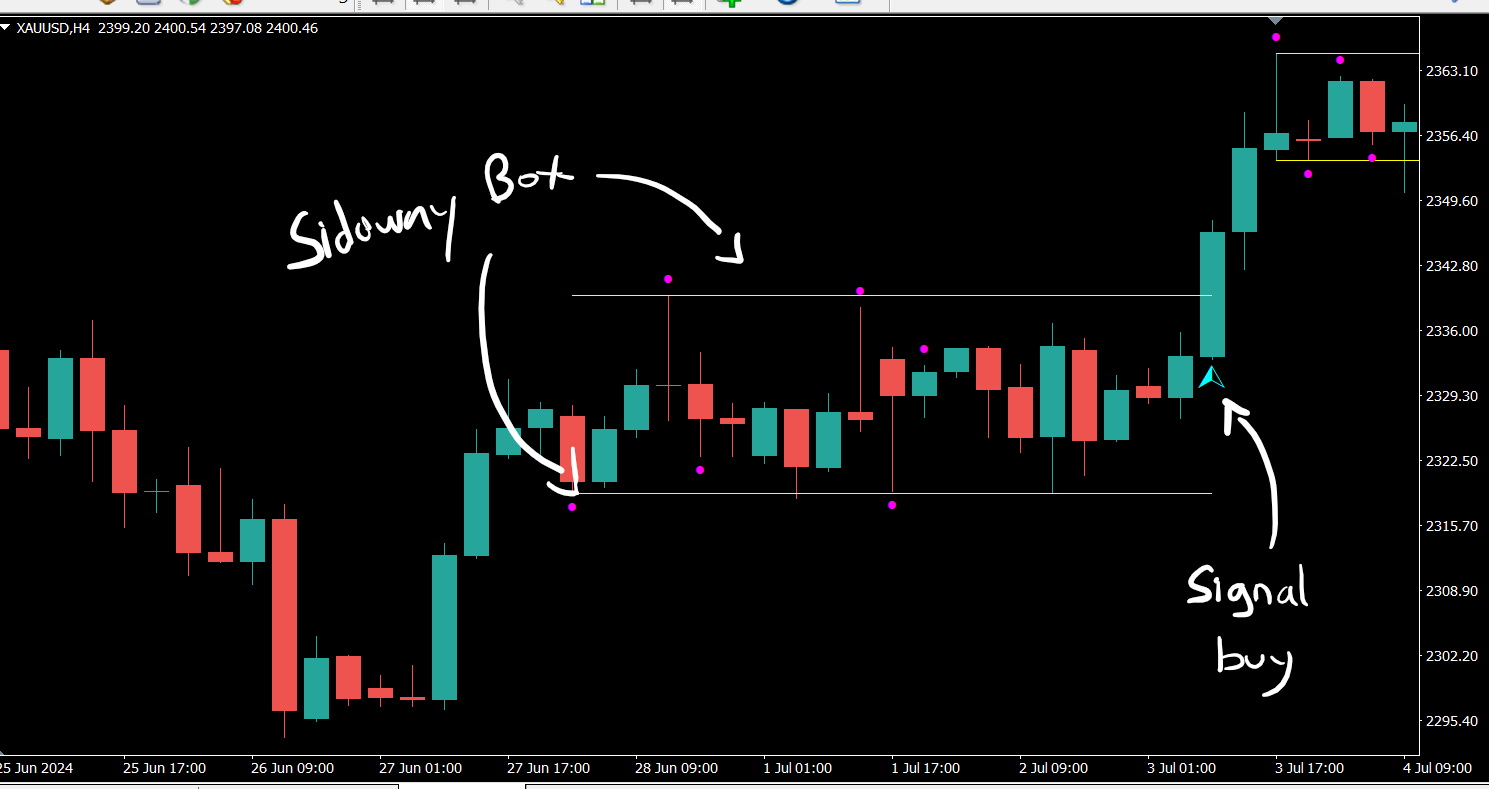
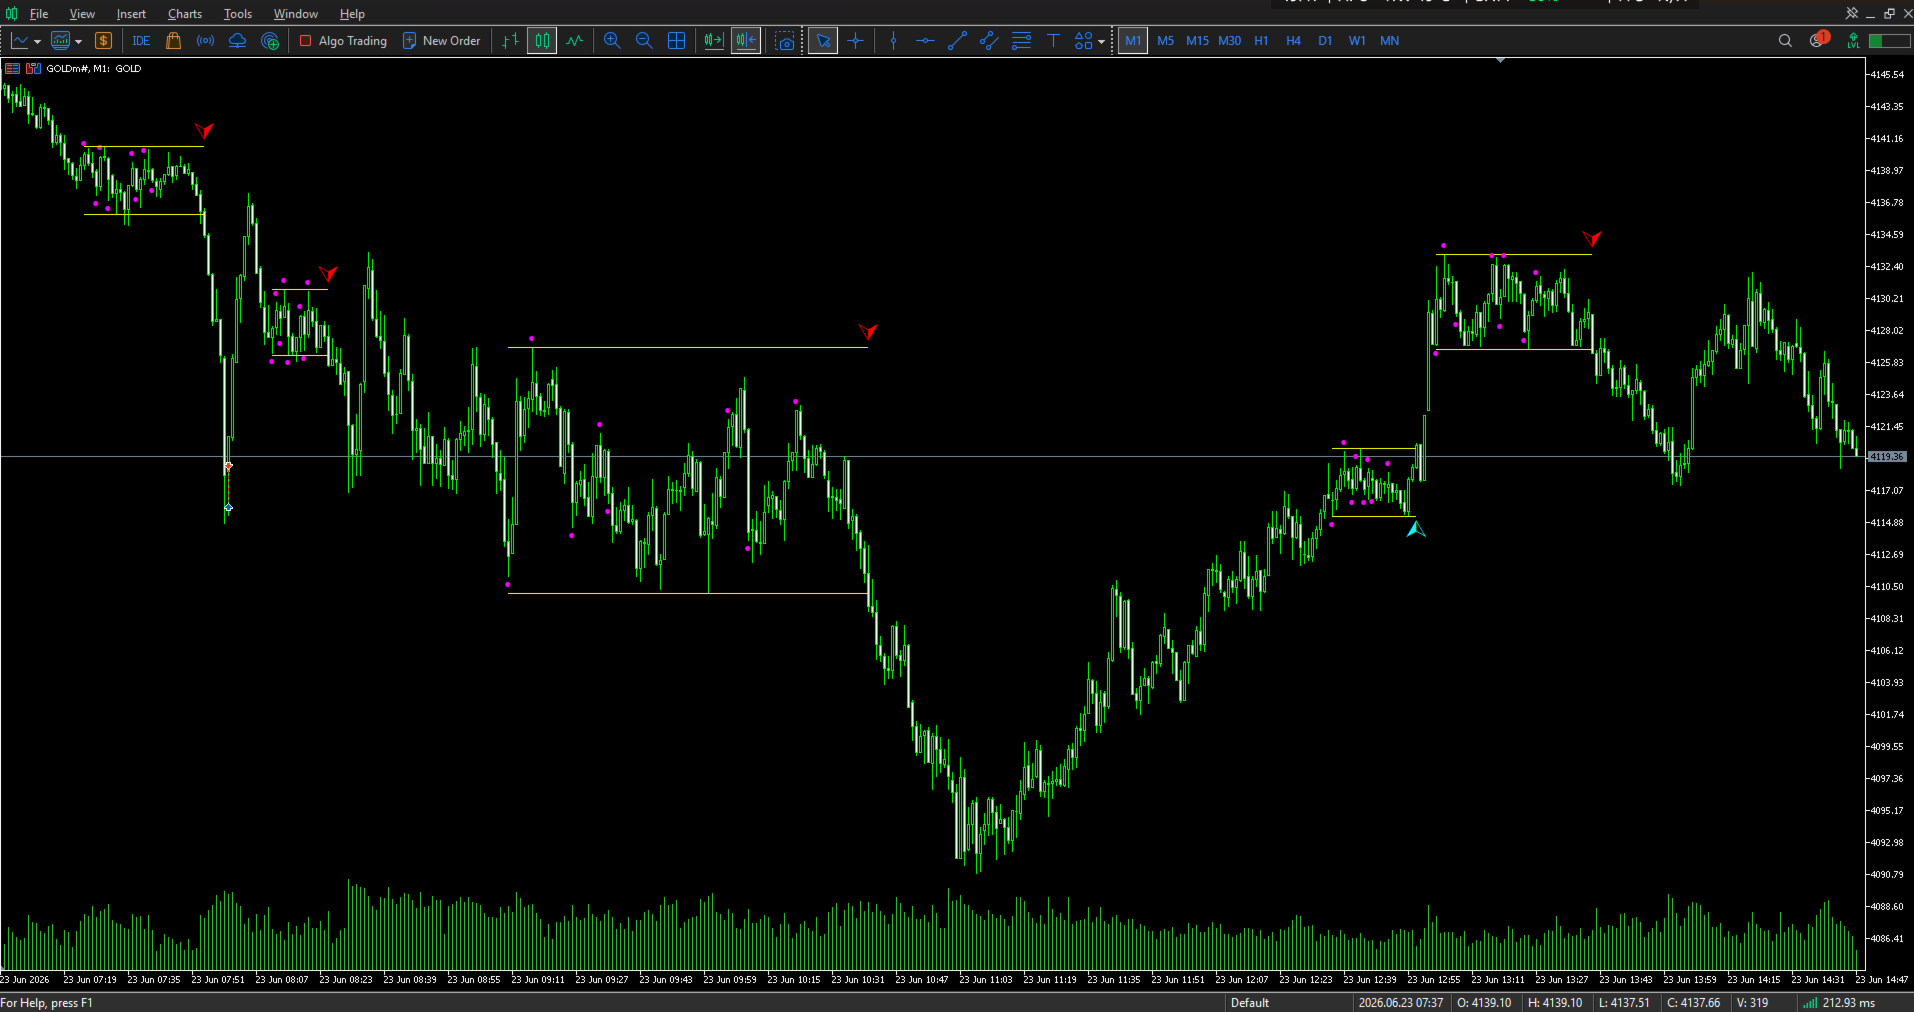
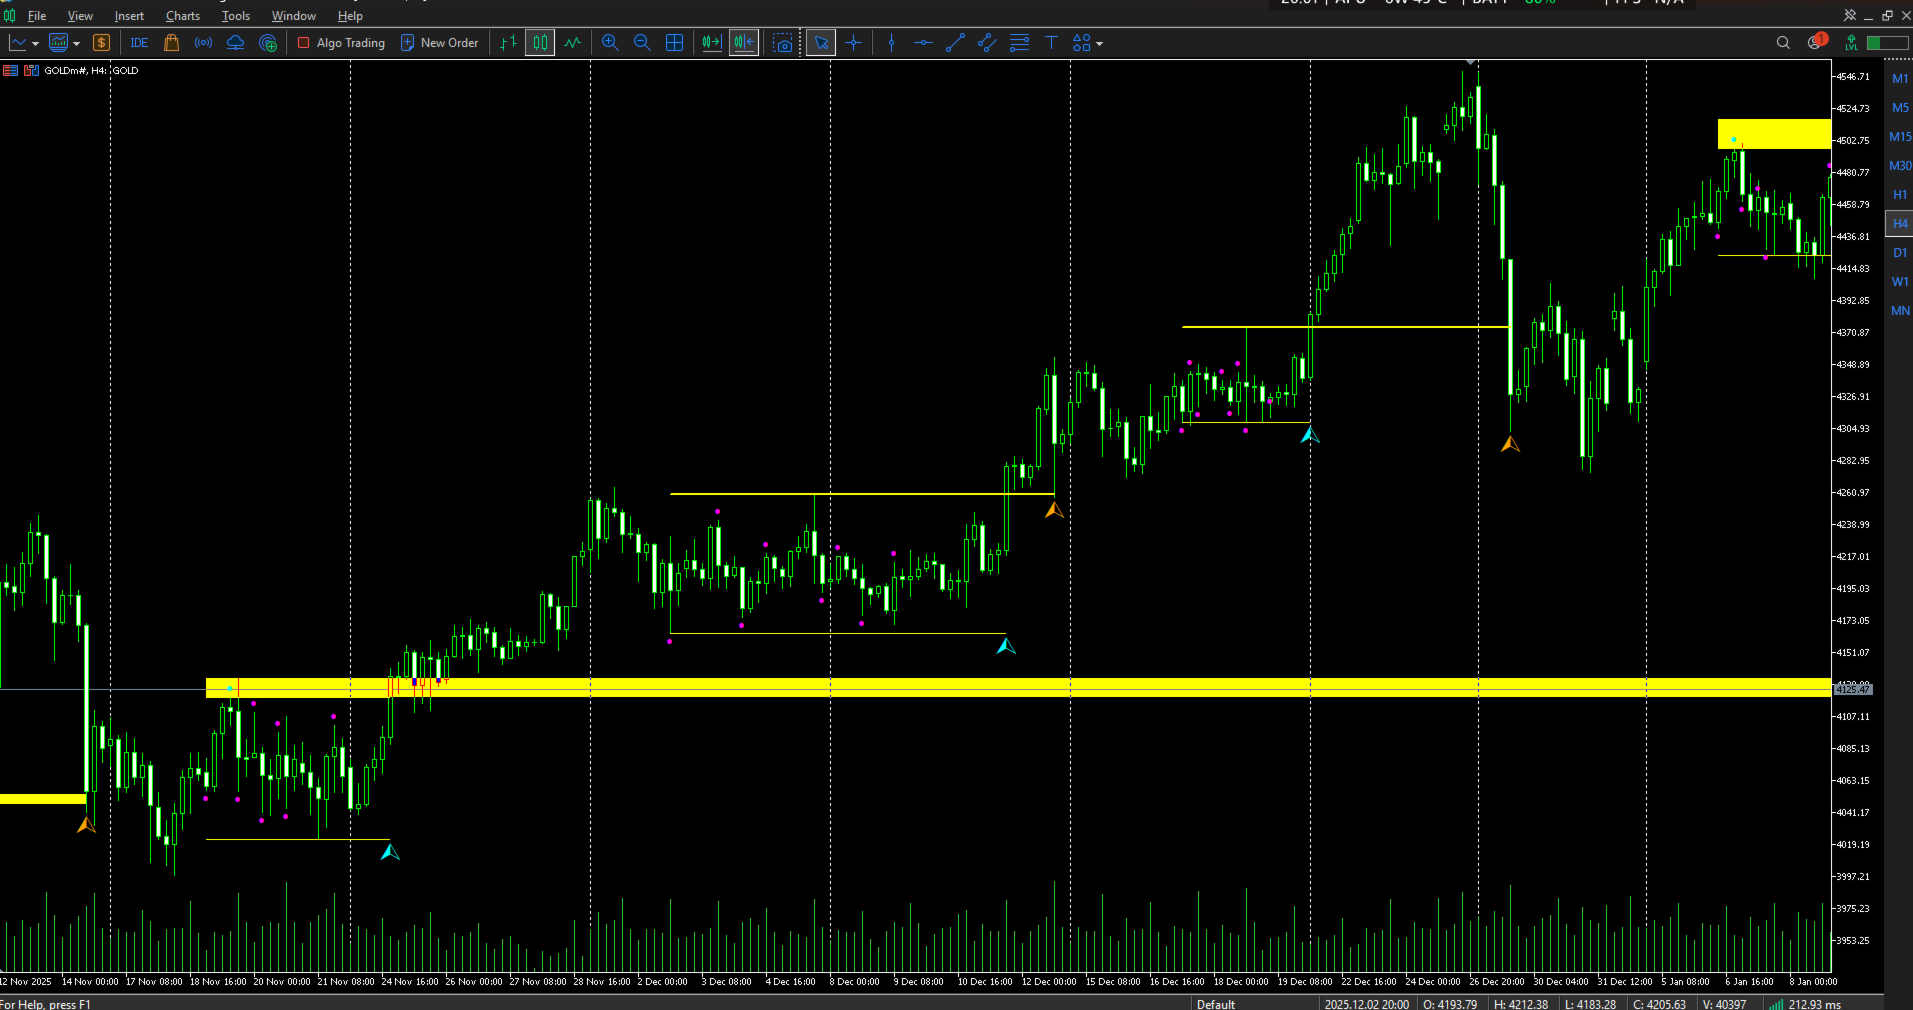
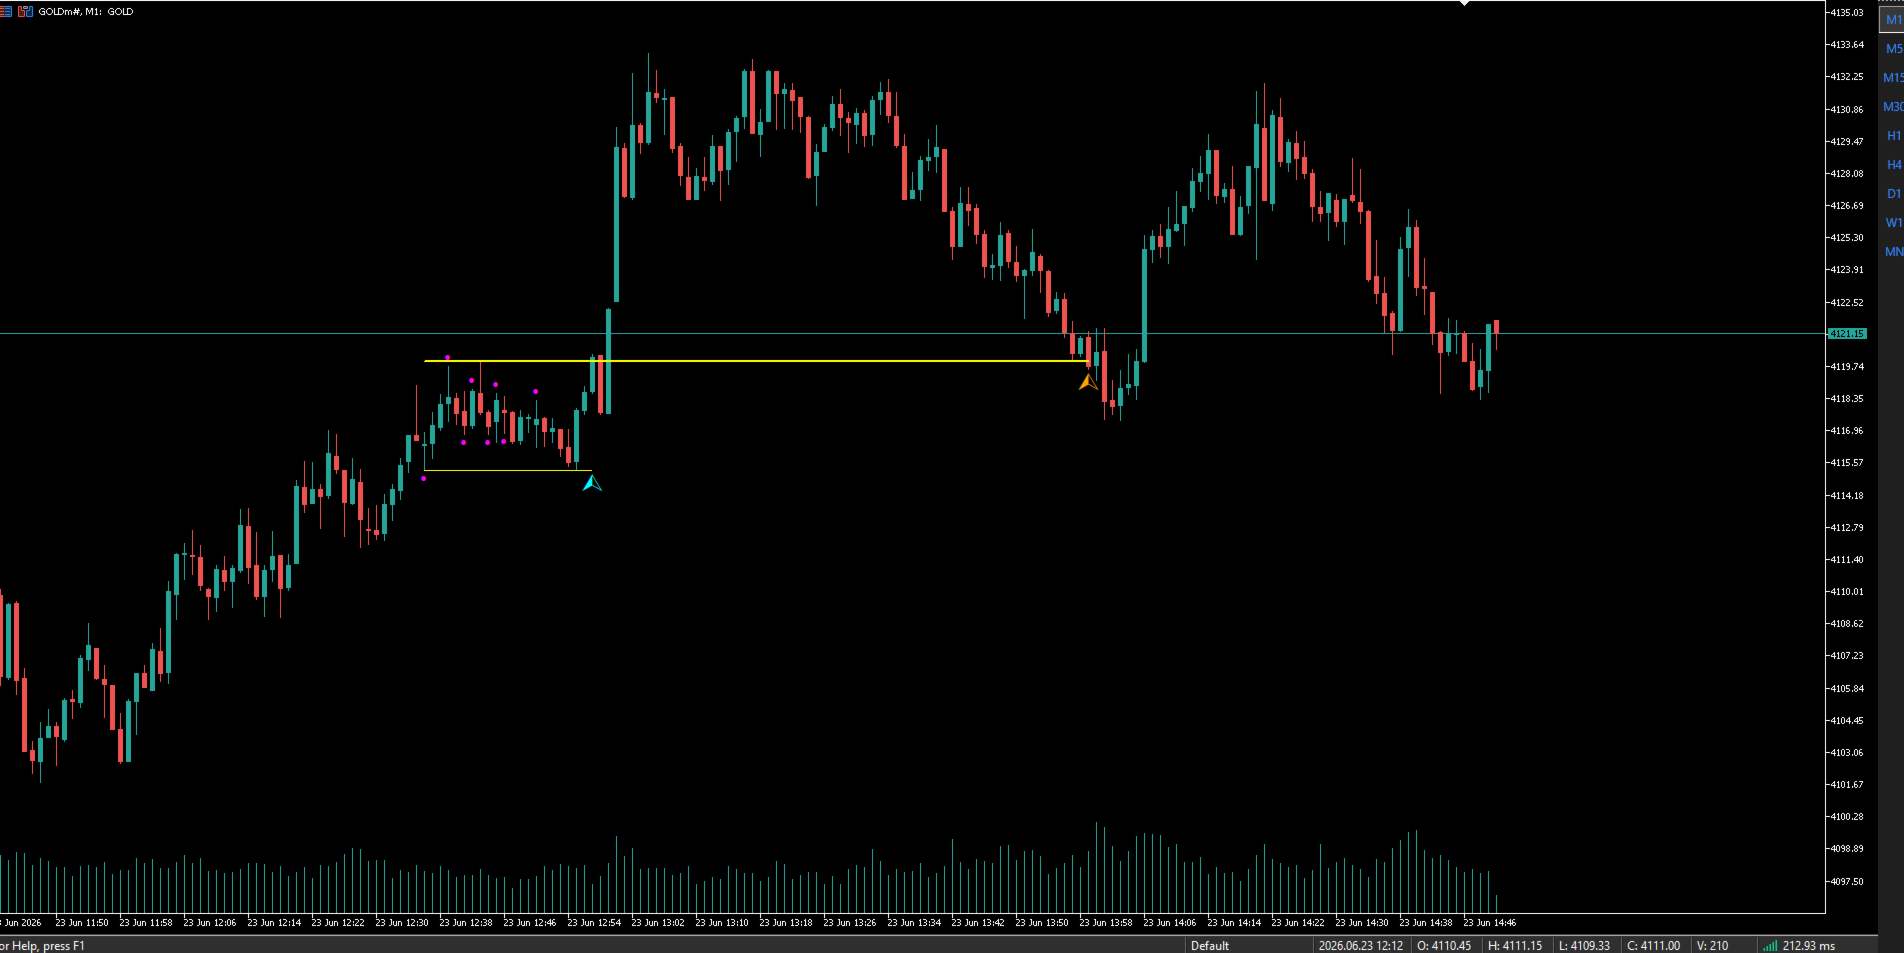
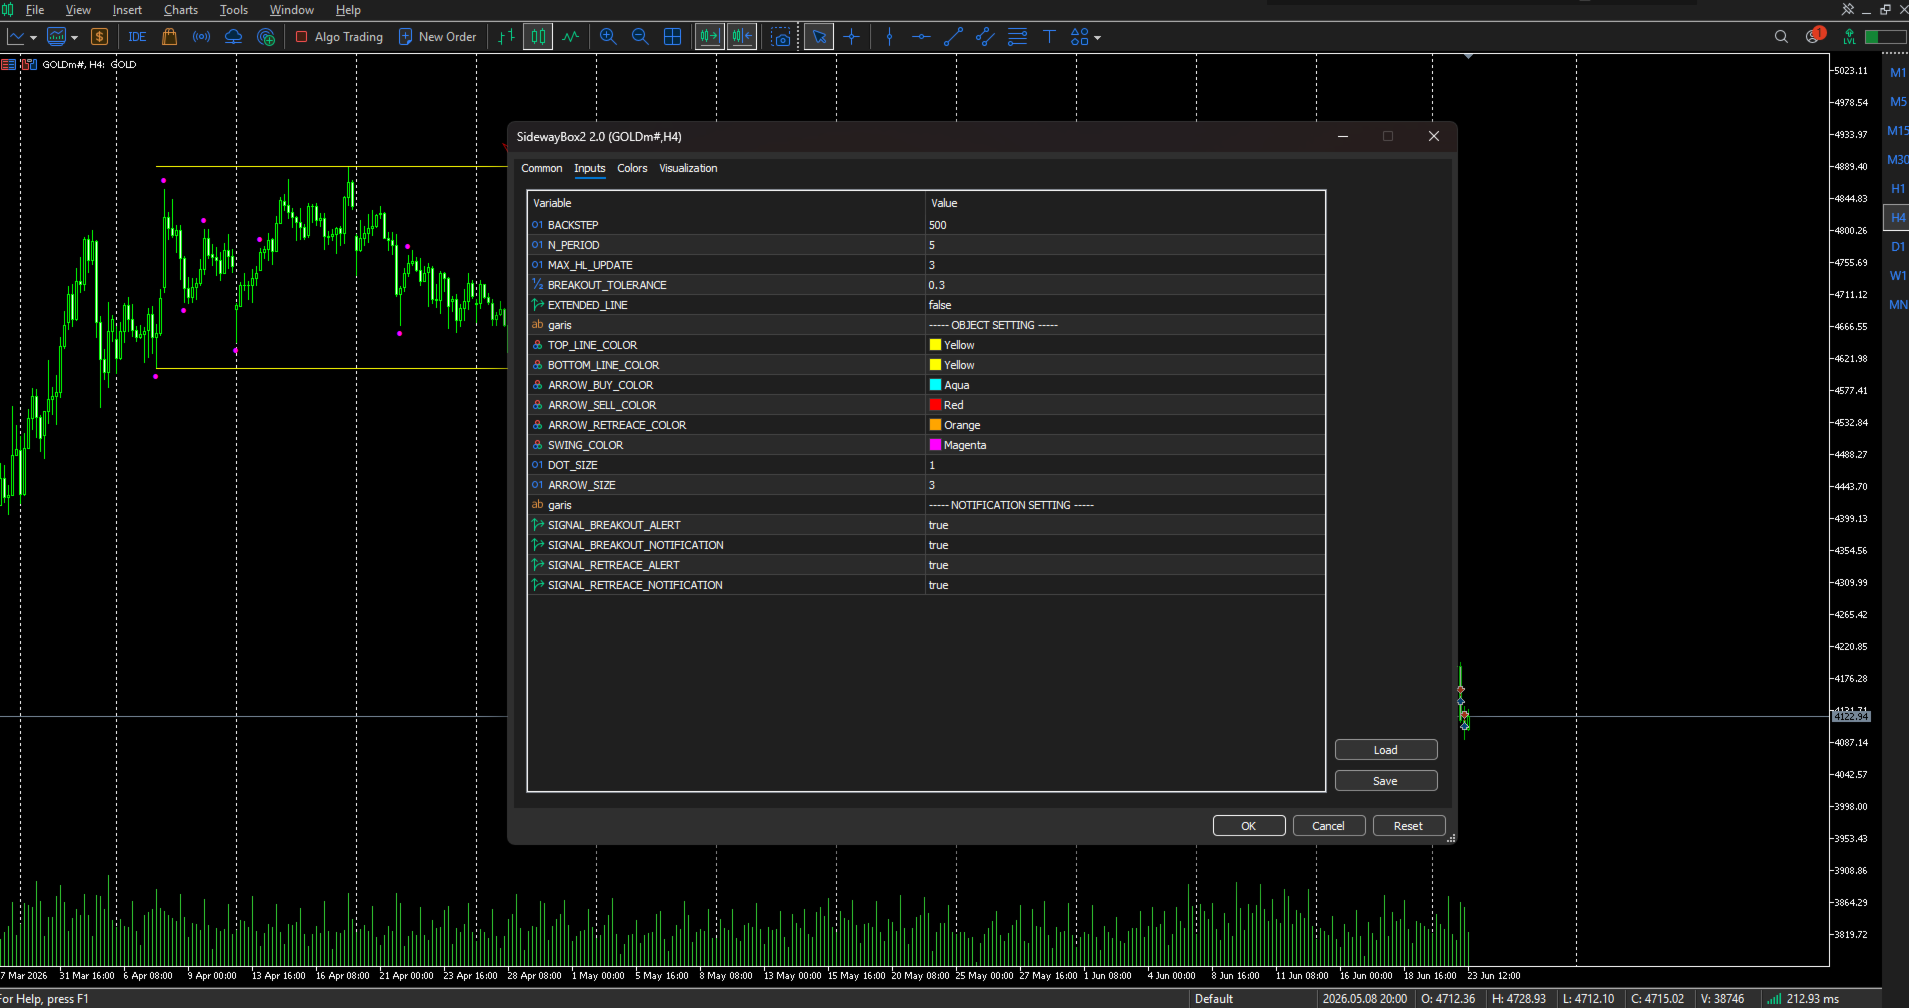
Sideway Box Indicator
The Sideway Box Indicator is an advanced trading tool designed to help traders identify and capitalize on sideways market conditions. This powerful indicator detects periods when the market is in a sideways (ranging) phase, providing traders with clear visual cues.
Key Features
-
Sideways Market Detection: The Sideway Box Indicator accurately identifies sideways market conditions, allowing traders to recognize when the price is consolidating within a specific range.
-
Buy/Sell Signals: The indicator generates precise buy and sell signals when the price breaks out of the identified sideways range. This helps traders make informed decisions on entering or exiting positions.
-
Customizable Settings: Tailor the indicator's sensitivity and appearance to match your trading style and preferences, ensuring it fits seamlessly into your trading strategy.
-
Real-time Alerts: Receive instant alerts when the market transitions from a sideways phase to a trending phase, so you can act quickly and confidently.
-
Buffer Data: equipped with a data buffer for advanced development purposes.
The Sideway Box Indicator is an essential tool for traders looking to enhance their trading strategies and make the most of market fluctuations. Whether you're trading forex, stocks, or cryptocurrencies, this indicator provides valuable insights and actionable signals.