MACD Divergen MT5
- インディケータ
-
Komang Putra Riswanjaya
 I am a freelance developer specializing in MQL4, MQL5, and Pine Script, focused on building custom trading solutions for MetaTrader and TradingView platforms.
My services include:
* Expert Advisors (EA)
* Custom Indicators
* Trading Tools & Utilities
* Strategy Automation - バージョン: 1.0
- アクティベーション: 5
Overview
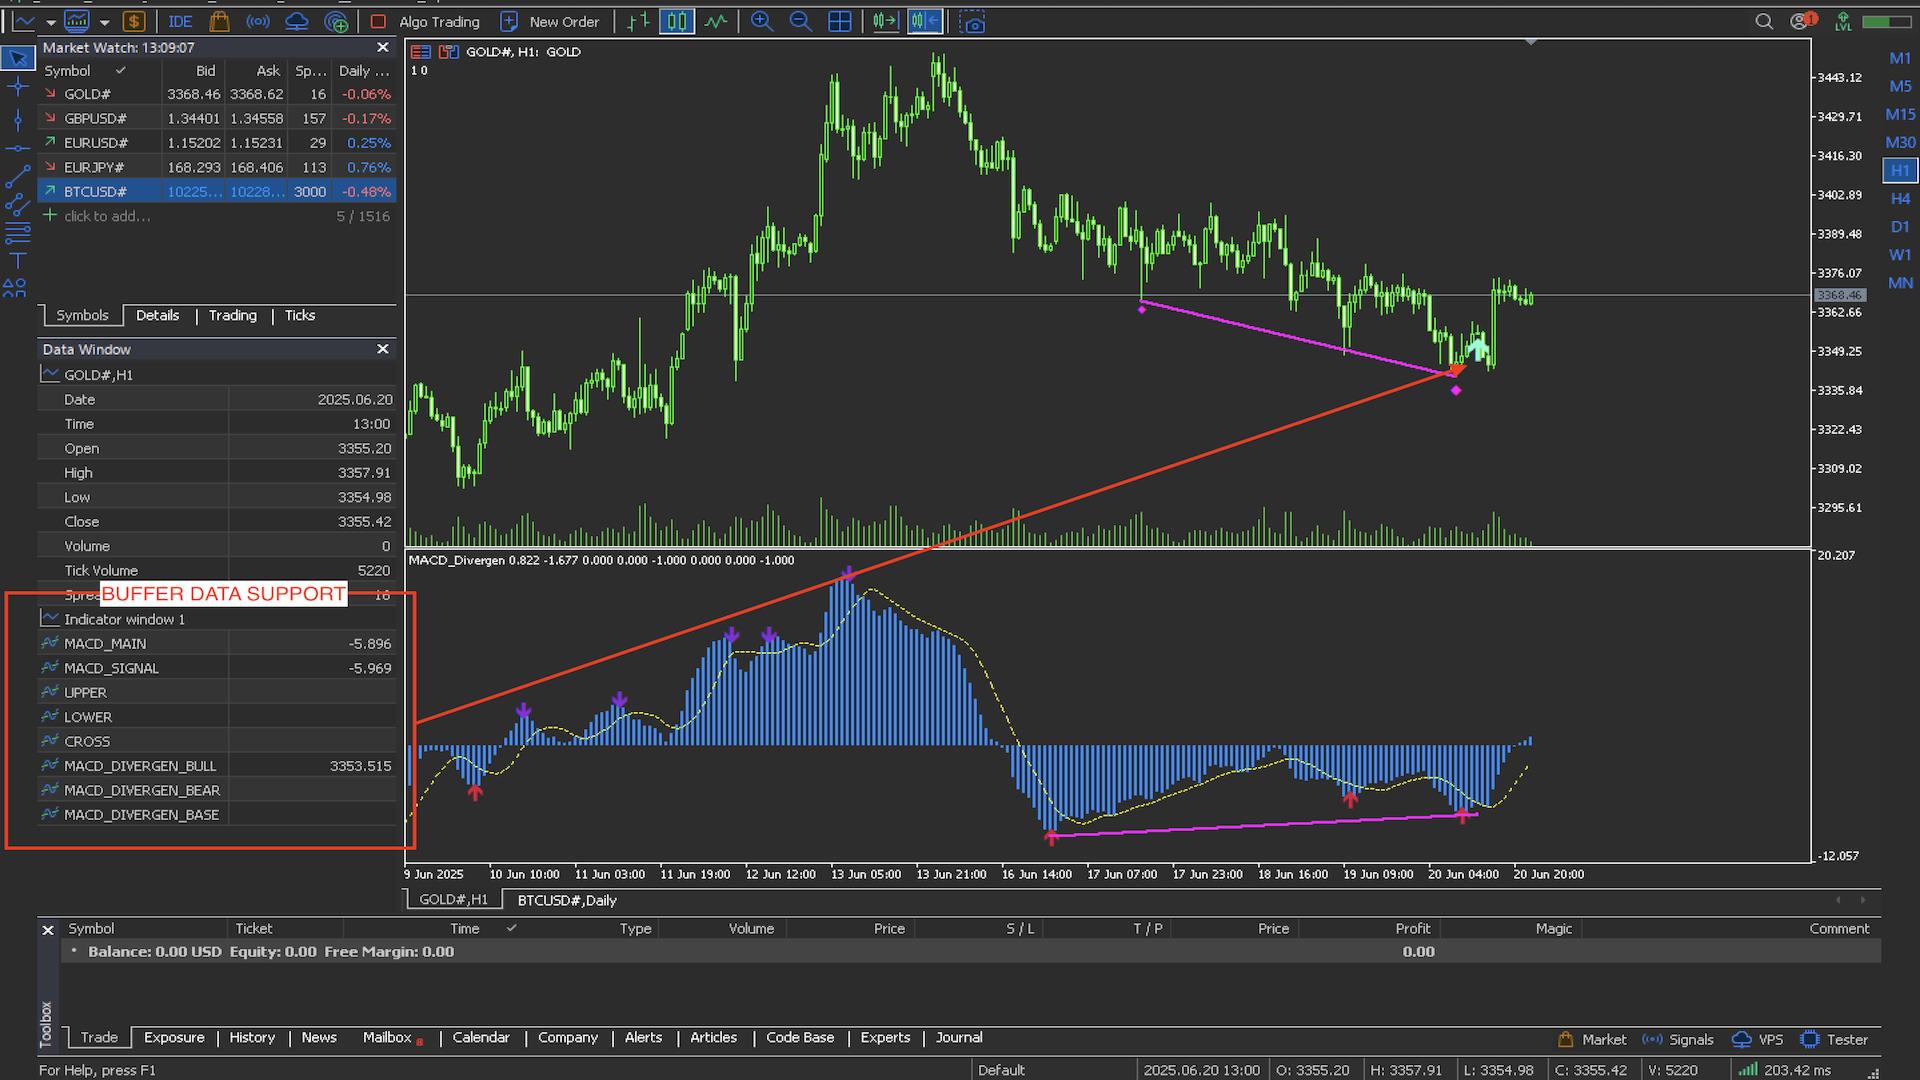
The MACD Divergence Indicator is a powerful tool designed to detect potential trend reversals by analyzing divergences between price action and the MACD (Moving Average Convergence Divergence) indicator. It automatically identifies and highlights bullish and bearish divergence signals directly on the chart, making it easier for traders to spot high-probability trading opportunities.
Key Features
-
Customizable Settings: Includes adjustable parameters to suit various trading styles and timeframes.
-
Visual Markers: Bullish and bearish divergences are displayed with arrows and lines on the chart.
-
Alert System: Provides on-screen alerts, sound alerts, and push notifications to stay informed in real time.
-
EA Integration Ready: Includes data buffer support for use in Expert Advisors and automated strategies.
-
Multi-Instrument Support: Compatible with a wide range of trading instruments including forex, stocks, indices, and commodities.
Usage
When a divergence is detected between price and the MACD line, the indicator plots an arrow and a connecting line to indicate a potential change in trend direction. Traders can use these signals as part of a broader technical analysis strategy. For best results, combine the MACD Divergence Indicator with other technical tools and sound risk management practices.
A usage example is shown in the screenshot below.