GGP ADX and DI MT5

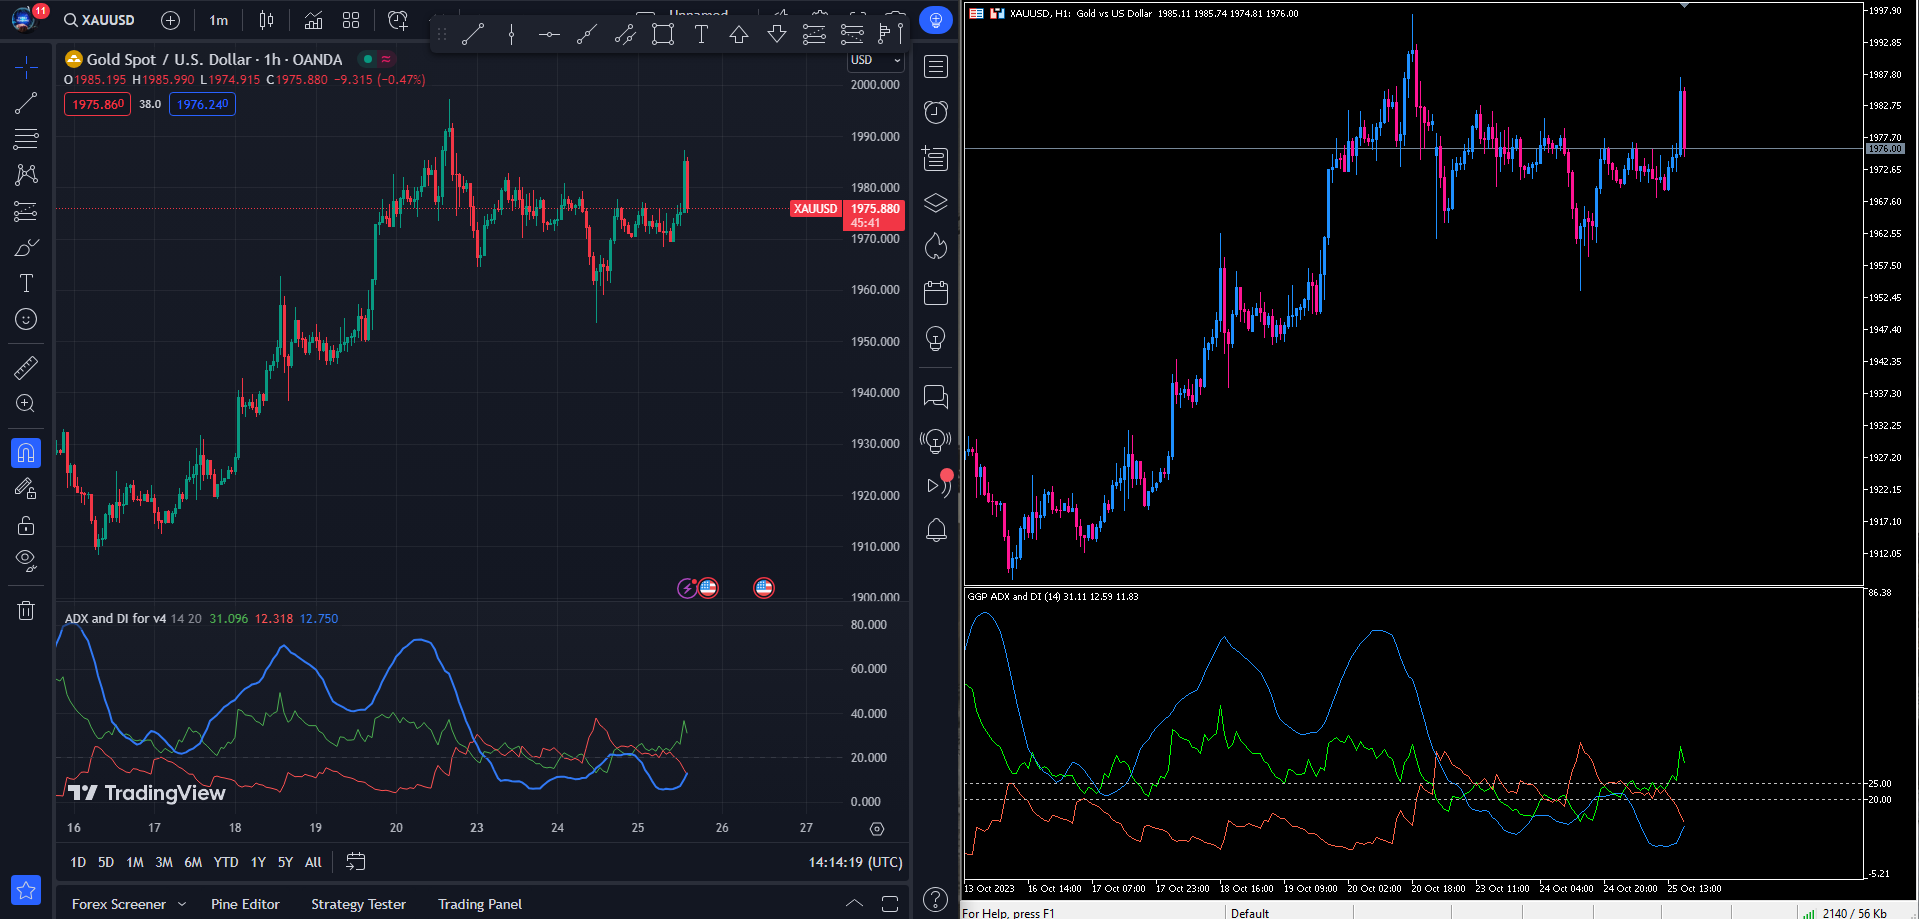
The GGP ADX and DI MT5 Indicator is used to quantify trend strength. ADX calculations are based on a moving average of price range expansion over a given period of time.

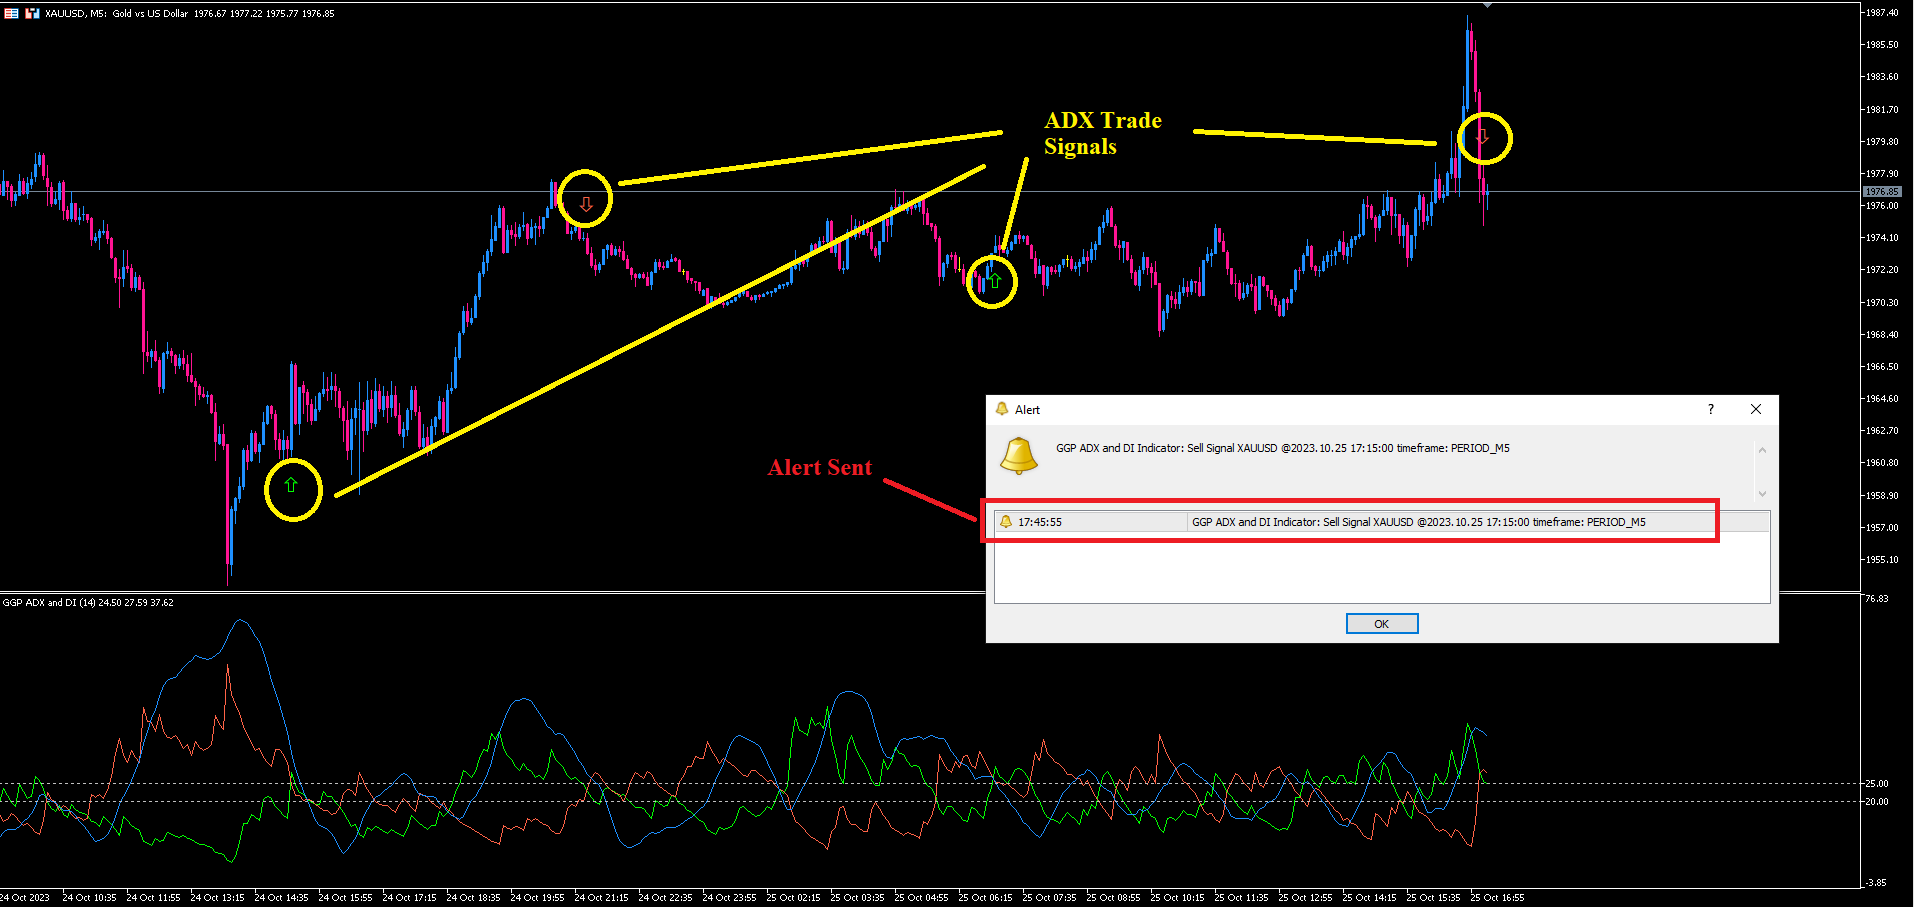
This indicator is MT5 conversion of the ADX and DI Indicator by “BeikabuOyaji “ in Trading View website and some alert methods are added to provide real-time alerts when a trading signal is generated, in order to allow traders to act quickly and efficiently.

For MT4 version please click here.

ADX is plotted as a single line with values ranging from a low of zero to a high of 100. ADX is non-directional; it registers trend strength whether price is trending up or down.

When the +DMI is above the -DMI, prices are moving up, and ADX measures the strength of the uptrend. When the -DMI is above the +DMI, prices are moving down, and ADX measures the strength of the downtrend.

ADX values help traders identify the strongest and most profitable trends to trade. The values are also important for distinguishing between trending and non-trending conditions. Many traders will use ADX readings above 25 to suggest that the trend is strong enough for trend-trading strategies. Conversely, when ADX is below 25, many will avoid trend-trading strategies.

The series of ADX peaks are also a visual representation of overall trend momentum. ADX clearly indicates when the trend is gaining or losing momentum. Momentum is the velocity of price. A series of higher ADX peaks means trend momentum is increasing. A series of lower ADX peaks means trend momentum is decreasing. Any ADX peak above 25 is considered strong, even if it is a lower peak.

ADX can also show momentum divergence. When price makes a higher high and ADX makes a lower high, there is negative divergence, or non-confirmation. In general, divergence is not a signal for a reversal, but rather a warning that trend momentum is changing. It may be appropriate to tighten the stop-loss or take partial profits.

Key Features:

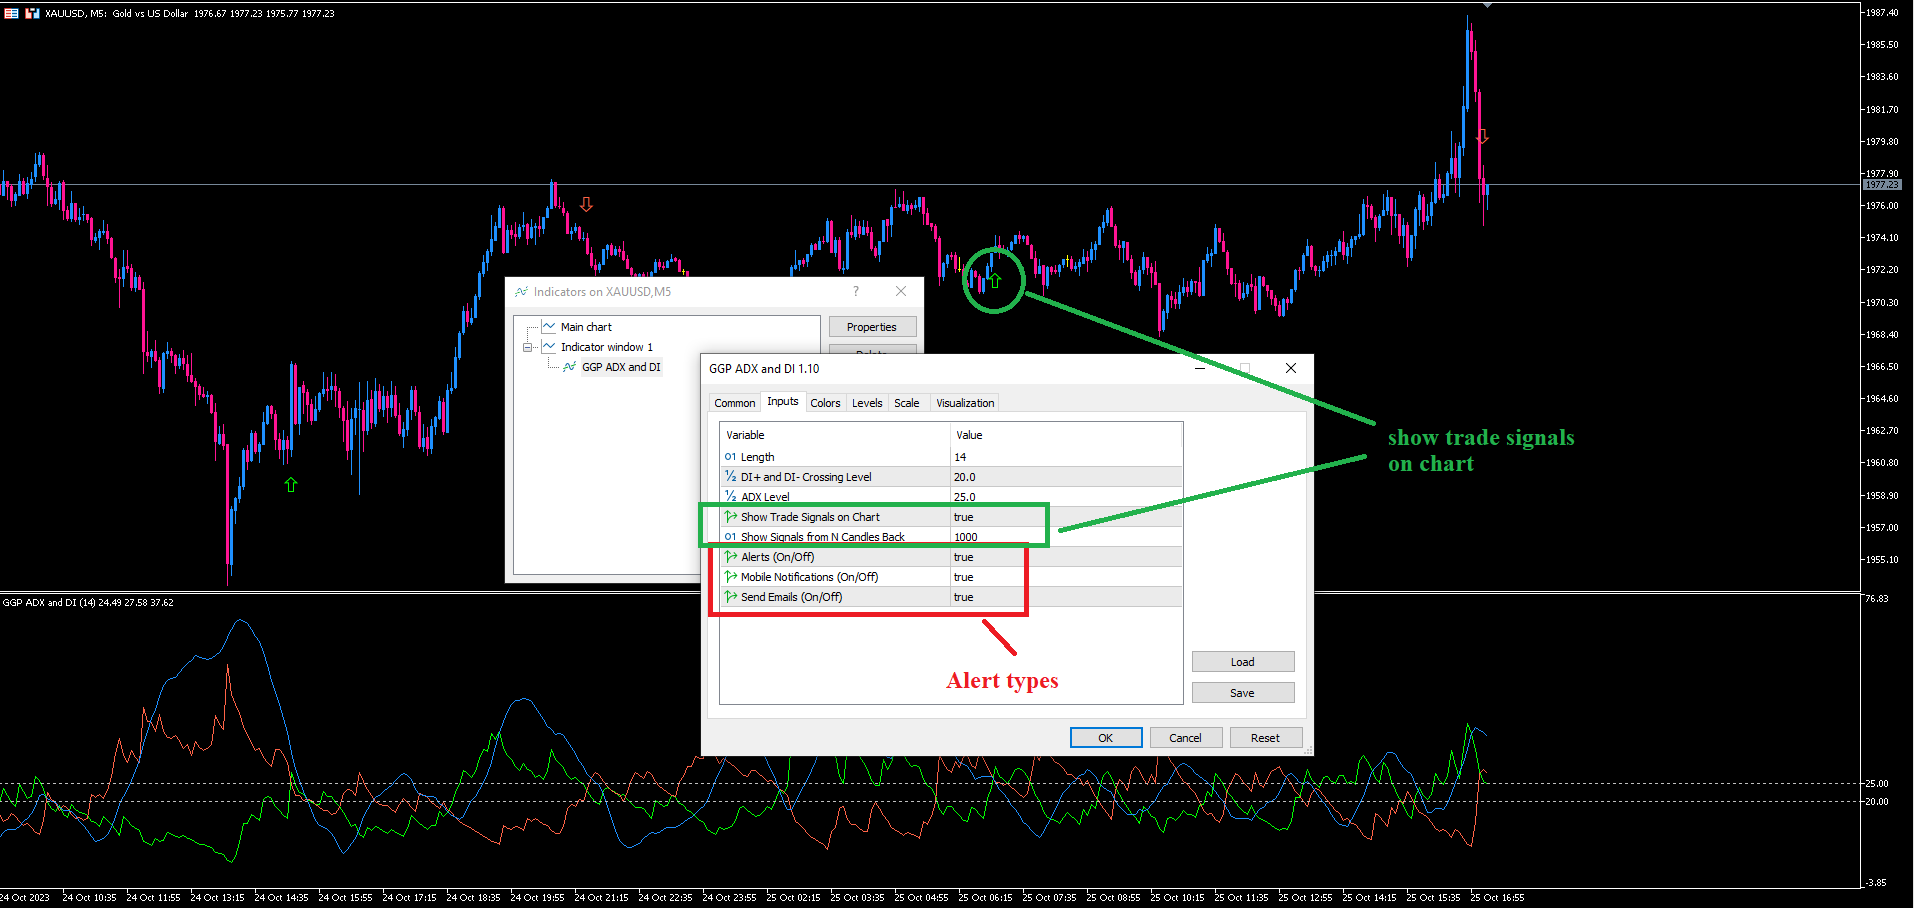
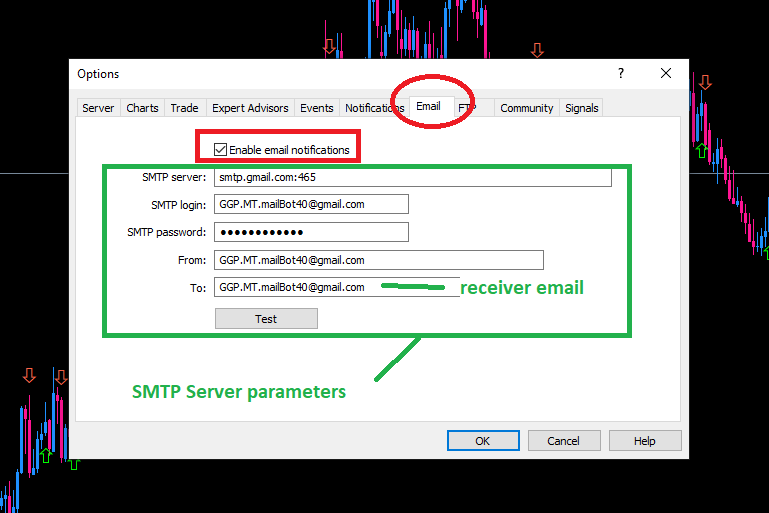
Alert Types: in addition to the terminal pop-up alerts, the mobile notification sends the alerts directly to your cell phone and by sending emails you will never lose a signal. All these alert methods can be turned on/off to fit your trading style and preferences.

                MetaTrader alert boxes.

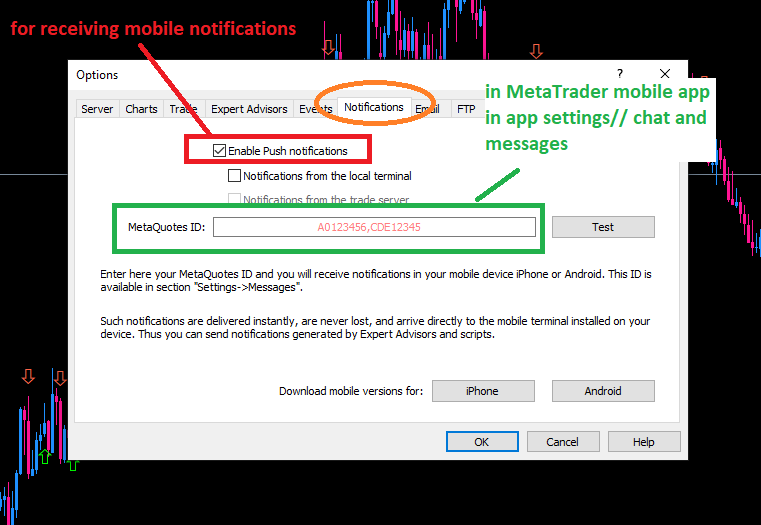
                Mobile Notifications.

                Sending Emails.

      * For sending and receiving emails a SMTP server is needed.

The indicator is compatible with a wide range of financial instruments, including forex, stocks, indices, and commodities.

All buffers and entry signals are included as a buffer and available for processing in EAs.

User-friendly Interface: The user-friendly interface ensures traders of all levels can easily access and utilize this advanced tool.

I would greatly appreciate a positive review if you are happy with your purchase. Please contact me to find a solution if you are not.

See other products here.


おすすめのプロダクト
RBreaker Gold Indicatorsは、金先物の短期日内取引戦略であり、トレンドフォローと日内反転の2つの取引手法を組み合わせたものです。トレンド相場での利益を捉えるだけでなく、相場が反転した際には迅速に利確し、その流れに沿ってポジションを反転させることができます。 この戦略は、アメリカの雑誌『Futures Truth』において、15年連続で最も収益性の高い取引戦略トップ10に選ばれた実績を持ち、非常に長いライフサイクルを誇り、現在も国内外で広く使用・研究されています。 本インディケーターは、2026年の金先物の値動きに対応し、14日間のATR指標に基づいて、ブレイクアウト係数A、観察係数B、リバーサル係数Rをより合理的な値で定義しています。非常に優れたインディケーターであり、安定的な年間収益を実現しています。ぜひおすすめします〜
Prime Power ML は、シグナルを表示する前に勝率でフィルタリングする2つのONNXニューラルネットワークモデルを搭載した高度なCurrency Strength Meterです。通貨間のすべての乖離を表示する従来のCSMインジケーターとは異なり、Prime Power MLはAIが統計的優位性を確認したシグナルのみを強調表示します。 仕組み このインジケーターは、28の通貨ペアすべてにわたるRSIスコアリングを使用して、8つの主要通貨(USD、EUR、GBP、JPY、AUD、CAD、CHF、NZD)の強度をリアルタイムで計算します。2つの通貨間に強度の乖離が現れると、組み込みAIモデルが14の市場特徴を評価し、シグナルにWin Probability(0-100%)スコアを割り当てます。 最低閾値を満たすシグナルのみが AI TOP SIGNALS として表示されます — 信頼度順にランク付けされた現在のチャート上の2つの最良機会です。 2つのAIモデル — タイムフレームに合わせた選択 モード タイムフレーム 学習データ Win Rate(サンプル外) INTRADAY
PipFinite Trend PRO MT5
Karlo Wilson Vendiola
4.84 (558)
Breakthrough Solution For Trend Trading And Filtering With All Important Features Built Inside One Tool! Trend PRO's smart algorithm detects the trend, filters out market noise and gives entry signals with exit levels. The new features with enhanced rules for statistical calculation improved the overall performance of this indicator. Important Information Revealed Maximize the potential of Trend Pro, please visit www.mql5.com/en/blogs/post/713938 The Powerful Expert Advisor Version Automatin
サポート線と抵抗線のプロットにうんざりしていませんか? サポートレジスタンス は、非常に興味深いひねりを加えてチャート内のサポートとレジスタンスラインを自動検出およびプロットするマルチタイムフレームインジケーターです。価格レベルは時間とともにテストされ、その重要性が高まるにつれて、ラインは太くなり、暗くなります。 [ インストールガイド | 更新ガイド | トラブルシューティング | よくある質問 | すべての製品 ] 一晩でテクニカル分析を強化 チャートを閲覧せずに重要な価格レベルを検出 一目ですべての価格レベルの相対的な強さを認識する すべての取引で最大30時間のプロットラインを節約 インジケーターは、すべての価格レベルの年齢を表示します インジケーターは再描画されていません 過去および現在の価格レベルは近接によって崩壊し、現在の市場行動に合わせて調整されます。動作は、必ずしもピークではない場所に線が引かれます。 価格レベルは、時間とともに拒否されるにつれて、より暗く、より広くなります ノイズを避けるために、重要でない価格レベルは定期的にクリアされます カスタマイズ可能な時間枠の
Volality Index scalper indicator  Meant for Volality pairs such as Volality 10, 25, 50, 75 and 100 The indicator works on all timeframes from the 1 minute to the monthly timeframe the indicator is non repaint the indicator has 3 entry settings 1 color change on zero cross 2 color change on slope change 3 color change on signal line cross Orange line is your sell signal Blue line is your buy signal.
Inverted_Chart_EA Utility Expert Advisor Inverted_Chart_EA creates and maintains a mirror-inverted chart of any symbol and timeframe. It automatically generates a custom instrument (e.g. US30_INV ) and keeps its price history updated in real time, with bars mirrored around a chosen pivot. This utility gives traders a new way to analyze the market from a different perspective by flipping the chart upside down. Why use an inverted chart? Highlight hidden patterns – price formations that look ordin
# DRAWDOWN INDICATOR V4.0 - The Essential Tool to Master Your Trading ## Transform Your Trading with a Complete Real-Time Performance Overview In the demanding world of Forex and CFD trading, **knowing your real-time performance** isn't a luxury—it's an **absolute necessity**. The **Drawdown Indicator V4.0** is much more than a simple indicator: it's your **professional dashboard** that gives you a clear, precise, and instant view of your trading account status. --- ## Why This Indicator
"Impulses and Corrections 5" is created to help traders navigate the market situation. The indicator shows multi-time frame upward and downward "Impulses" of price movements. These impulses are the basis for determining the "Base" , which is composed of zones of corrections of price movements, as well as "Potential" zones for possible scenarios of price movement. Up and down impulses are determined based on a modified formula of Bill Williams' "Fractals" indicator. The last impulse is always "U
TRI Visualizer Enhanced - 熱力学的市場分析の革命 概要 TRI(Thermal Range Indicator)Visualizer Enhanced は、従来のテクニカル分析を超越した、物理学の熱力学理論を応用した革新的なマーケット分析インジケーターです。市場の価格変動を「熱力学的エネルギー」として捉え、これまで見落とされていた市場の微細な変化を高精度で検出します。 革新的な仕組み 1. デュアル計算エンジン クラシックTRIモード 基本公式: |終値-始値| + (高値-安値) ローソク足の実体とヒゲを統合した純粋なボラティリティ測定 シンプルで直感的、あらゆる市場環境で安定動作 熱力学的TRIモード(独自開発) 価格加速度 :2次微分による価格変化の勢いを測定 出来高変化率 :相対的な出来高の変化を動的に評価 ポジションエネルギー :正規化された価格変動エネルギーを計算 熱力学的係数 :物理学の熱力学法則を市場分析に応用 2. 高度な平滑化システム SMA(単純移動平均) :基本的なノイズ除去 EMA(指数移動平均) :最新データ重視の平滑化
STRICTLY FOR BOOM INDEX ONLY!!!!! Here I bring the Maximum Trend Arrows OT1.0 MT5 indicator. This indicator is made up of a combination of different trend indicators for entries and exits, for entries an orange arrow will paint on the chart below the current market and a red flag for closing of trades and it produces buy arrows only. When the orange arrow appears, it will appear along with it's sound to notify you. The 1H timeframe is recommended, don't use it anywhere else than on the 1H timefr
Universal Soul Reaper is an atmospheric market-flow oscillator designed to interpret price behavior as a cycle of spiritual energy. Instead of reacting to raw price alone, it visualizes the state of the market’s soul —revealing when momentum is awakening, stabilizing, or fading. The indicator operates in a separate window and presents three interwoven entities: the Ectoplasmic Veil , the Spirit Boundary , and the Soul Core . Together, they form a living framework that helps traders sense pressu
Trend Master Chart、必要なトレンド指標です。 チャートをオーバーレイし、色分けを使用してさまざまな市場のトレンド/動きを定義します。 2 つの移動平均と異なるオシレーターを組み合わせたアルゴリズムを使用します。 これら 3 つの要素の周期は変更可能です。 どの時間枠やペアでも機能します。 上昇トレンドまたは下降トレンド、およびこのトレンドへのさまざまなエントリーポイントを一目で識別できます。 たとえば、顕著な上昇トレンド (薄緑色) では、このトレンド内のさまざまな市場インパルスが濃い緑色のローソク足で表示されます。 設定可能なアラートを使用すると、これらの衝動を決して見逃すことがなくなります。 MT4のバージョンです。 入力パラメータ: Period 1: 高速期間移動平均。 Period 2: 低速期間の移動平均。 Oscillator period: オシレーター周期。 Sell/Buy alert: 市場衝動アラート、トレンドエントリーポイント。 Bullish/Bearish alert: トレンドが変化した場合のアラート。 ポップ
ATrend
Zaha Feiz
4.83 (18)
ATrend: その仕組みと使い方 仕組み MT5プラットフォーム向けの「ATREND」インジケーターは、テクニカル分析手法の組み合わせを利用して、トレーダーに堅牢な買いと売りのシグナルを提供するように設計されています。このインジケーターは主に、ボラティリティ測定のために平均真の範囲(ATR)を活用し、潜在的な市場動向を特定するためのトレンド検出アルゴリズムを併用しています。 購入後にメッセージを残すと、特別なボーナスギフトが贈呈されます。 主な特徴: - ダイナミックなトレンド検出: インジケーターは市場トレンドを評価し、シグナルを適宜調整することで、トレーダーが優位な市場環境に合わせて戦略を立てるのを支援します。     - ボラティリティ測定: ATRを使用することで、インジケーターは最適なストップロス(SL)とテイクプロフィット(TP)レベルを決定するために不可欠な市場ボラティリティを測定します。 - シグナルの視覚化: インジケーターは、チャート上に買いと売りのシグナルを視覚的に表示することで、トレーダーの意思決定を強化します。 操作手順 入力とセッティング - TimeF
CosmiCLab SMC FIBO CosmiCLab SMC FIBO is a professional trading indicator designed for traders who use Smart Money Concepts (SMC), market structure analysis and Fibonacci retracement levels. The indicator automatically detects market swings and builds Fibonacci levels based on the latest impulse movement. It also identifies market structure changes such as BOS (Break of Structure) and CHOCH (Change of Character), helping traders understand the current market direction. CosmiCLab SMC FIBO also pr
プレミアムレベルは、正しい予測の精度が80%を超える独自の指標です。 この指標は、最高のトレーディングスペシャリストによって2か月以上テストされています。 あなたが他のどこにも見つけられない作者の指標! スクリーンショットから、このツールの正確さを自分で確認できます。 1は、1キャンドルの有効期限を持つバイナリーオプションの取引に最適です。 2はすべての通貨ペア、株式、商品、暗号通貨で機能します 手順: 赤い矢印が表示されたらすぐにダウントレードを開き、青い矢印が表示されたら閉じます。青い矢印の後に開くこともできます。 試してテストしてください!推奨設定はデフォルトです! 日足チャートで最高の精度を示します! インディケータは、2600 Pipsの収益性に対して、約10Pipsという非常に小さなマージンを使用します。
DYJ BoS インジケーターは、次のような市場構造の変化の主な要素を自動的に識別してマークします。 構造のブレイクアウト (BoS): 価格が大きく変動し、構造の前のポイントを突破したときに発生します。 彼は上昇トレンドと下降トレンドの可能性のあるライン(UP と DN、つまり連続した新高値と新安値)をマークし、価格がこれらのラインを突破すると、赤(弱気)と緑(強気)の矢印でマークします。 BoS は通常、価格が以前の価格変動によって確立されたスイング安値または高値を決定的に突破したときに発生します。価格がスイング高値を上回ったりスイング安値を下回ったりすると、単に以前に形成された市場構造から抜け出すだけなので、「ブレイクアウト」構造と呼ばれます。これは多くの場合、市場センチメントとトレンドの方向の変化を示し、既存のトレンドの継続または新しいトレンドの始まりを示唆します。 ポジションのクローズの精度を高めるために、通常はストップロスとテイクプロフィットを設定しないことが推奨されます。最終ポジションは通常、同じ方向の次のブレイクスルー ポイント、または反対方向のブレイクスルー
Naturu
Ivan Stefanov
5 (1)
「Naturu(ナチュル)」は自然の対称性をアルゴリズムとして用いる手動インジケーターです。 シンプルな戦略と隠された知恵でマーケットを制覇しましょう! インジケーターを読み込むと、上側(Top)と下側(Bottom)の2本のラインが表示されます。 ラインを一度クリックするとアクティブ化され、移動させたいローソク足をクリックするだけでその位置に移動できます。 高値ポイントと安値ポイントを設定すると、インジケーターが自動的に以下を計算します: マゼンタのゾーン:ブル(買い勢)とベア(売り勢)の関心が最も接近する、サポート/レジスタンスになりやすいエリア グレーのゾーン:次に注目されるエリア アクア色のライン:ブルの価格目標 ゴールド色のライン:ベアの価格目標 手動インジケーターは完全なコントロールと柔軟性を提供し、リアルタイムの相場状況や個人の直感に応じてラインを調整できます。 価格の動きを自ら深く分析することで、サポートやレジスタンス、チャートパターンの形成を本質的に理解できます。 人間の判断を活かすことで、自動システムが誤認しがちなノイズを除去し、誤シグナルを減らします。 また、自分
No Demand No Supply MT5
Trade The Volume Waves Single Member P.C.
No Demand No Supply   This indicator identifies   No Demand –No Supply candles to your chart and plots volume bars colored according to the signal. It can be applied to all timeframes or to a specific one only. It can also be used as regular volume indicator  with exceptional future of WEIGHTED VOLUME. Furthermore is has an alert notification, sound and email when a signals occurs. The indicator does not repaint but the alert will come on two candles back due to the definition of No Demand No Su
This is an advanced multi-timeframe version of the popular Hull Moving Average (HMA) Features Two lines of the Hull indicator of different timeframes on the same chart. The HMA line of the higher timeframe defines the trend, and the HMA line of the current timeframe defines the short-term price movements. A graphical panel with HMA indicator data from all timeframes at the same time . If the HMA switched its direction on any timeframe, the panel displays a question or exclamation mark with a tex
Trend Monitor MT5
Pavel Zamoshnikov
4.5 (2)
The indicator generates early signals basing on ADX reading data combined with elements of price patterns. Works on all symbols and timeframes. The indicator does not redraw its signals. You see the same things on history and in real time. For better visual perception signals are displayed as arrows (in order not to overload the chart). Features The best results are obtained when the indicator works on two timeframes. For example: M30 – the indicator shows the main trend; M5 – the indicator gen
A scalping indicator based on mathematical patterns, which on average gives signals with relatively small SL, and also occasionally helps to catch big moves in the markets (more information in the video) This indicator has three main types of notifications: The first type warns of a possible/upcoming signal on the next bar The second type indicates the presence of a ready signal to enter the market/open a position The third type is for SL and TP levels - you will be notified every time price re
Your Trend Friend
Luigi Nunes Labigalini
5 (1)
The trend is your friend! Look at the color of the indicator and trade on that direction. It does not  repaint. After each candle is closed, that's the color of the trend. You can focus on shorter faster trends or major trends, just test what's most suitable for the symbol and timeframe you trade. Simply change the "Length" parameter and the indicator will automatically adapt. You can also change the color, thickness and style of the lines. Download and give it a try! There are big movements w
Divergent Stochastic Filter II Catch Reversals Early, Filter Noise, Trade with Confidence The Edge: Why This Stochastic is Different  Every trader knows the Stochastic oscillator. But knowing when to trust its signals, that's the real challenge. The Divergent Stochastic Filter II transforms this classic indicator into a precision reversal detection system by adding critical elements: divergence intelligence, signal filtering and exhaustion detection.  While standard Stochastic oscillators fire s
The Trend Duration Forecast MT5 indicator is designed to estimate the probable lifespan of a bullish or bearish trend. Using a Hull Moving Average (HMA) to detect directional shifts, it tracks the duration of each historical trend and calculates an average to forecast how long the current trend is statistically likely to continue. This allows traders to visualize both real-time trend strength and potential exhaustion zones with exceptional clarity. KEY FEATURES Dynamic Trend Detection:   Utiliz
Noize Absorption Index - is the manual trading system that measures the difference of pressure between bears forces and bulls forces. Green line - is a noize free index that showing curent situation. Zero value of index shows totally choppy/flat market.Values above zero level shows how powerfull bullish wave is and values below zero measures bearish forces.Up arrow appears on bearish market when it's ready to reverse, dn arrow appears on weak bullish market, as a result of reverse expectation.
Smart Market Structure Pro is a complete Smart Money Concepts and ICT indicator that maps institutional order flow on any chart, any timeframe, for MetaTrader 5 and MetaTrader 4. Please see the comments section for the full user guide  Attach it to a chart and the indicator draws Break of Structure (BOS), Change of Character (CHoCH), Order Blocks, Fair Value Gaps, Liquidity Sweeps, Premium/Discount zones, ICT session windows, and a real-time Confluence Score from 0 to 10 — all controlled from a
SMC Venom Model BPR インジケーターは、スマート マネー (SMC) コンセプトで取引するトレーダー向けのプロフェッショナル ツールです。価格チャート上の 2 つの主要なパターンを自動的に識別します。 FVG   (フェアバリューギャップ) は、3 本のローソク足の組み合わせで、最初のローソク足と 3 番目のローソク足の間にギャップがあります。ボリュームサポートのないレベル間のゾーンを形成し、価格修正につながることがよくあります。 BPR   (バランス価格範囲) は、2 つの FVG パターンの組み合わせで、「ブリッジ」を形成します。これは、価格がボリュームアクティビティの少ない動きで動くときに、ブレイクアウトしてレベルに戻るゾーンで、ローソク足の間にギャップを作成します。 これらのパターンは、大規模な市場プレーヤーと一般参加者の相互作用が発生するチャート上のボリュームと価格動向の分析に基づいて、トレーダーが主要なサポート/レジスタンス レベル、ブレイクアウト ゾーン、エントリ ポイントを識別するのに役立ちます。 インジケーターは、長方形と矢印の形でパターンを視覚
Was: $249  Now: $99   Market Profile defines a number of day types that can help the trader to determine market behaviour. A key feature is the Value Area, representing the range of price action where 70% of trading took place. Understanding the Value Area can give traders valuable insight into market direction and establish the higher odds trade. It is an excellent addition to any system you may be using. Inspired by Jim Dalton’s book “Mind Over Markets”, this indicator is designed to suit the
Market Shift Levels This indicator detects trend shifts and visualizes key market structure turning points using Hull Moving Average logic. It highlights potential areas of support and resistance where price is likely to react, empowering traders to spot early trend transitions. Market Shift Levels   are horizontal zones that mark the moment of a directional change in market behavior. These shifts are based on crossovers between two smoothed Hull Moving Averages (HMA), allowing the indicator
The indicator is designed to help in making a decision on the direction of trading (buy or sell). It is a history scanner that searches for matches of the current pattern (combination of several current bars) with historical data in percentage terms by the relative vertical position of candles relative to each other, the size of each candle, the size of the candle body and the candle shadows. In history, the matches found are indicated by vertical lines on the candle of the beginning of the soug
このプロダクトを購入した人は以下も購入しています
SuperScalp Pro
Van Minh Nguyen
4.57 (21)
SuperScalp Pro – 高度なマルチフィルタースキャルピングインジケーターシステム SuperScalp Pro は、クラシックな Supertrend と複数のインテリジェント確認フィルターを組み合わせた高度なスキャルピングインジケーターです。M1 から H4 まで複数の時間足で効率的に動作し、XAUUSD、BTCUSD、主要 Forex 通貨ペア向けに最適化されています。 このインジケーターは明確な Buy / Sell シグナルを提供し、ATR に基づいてエントリー価格、Stop Loss、Take Profit を自動計算します。Fibonacci Take Profit 機能により、重要な価格帯で早期決済し、到達時に通知を送信します。 初期設定では Fibonacci Take Profit が有効化されており、より安定した取引体験を重視しています。チャートに適用するだけですぐ利用可能です。上級者向けに、すべてのパラメータは自由にカスタマイズできます。 EMA、RSI、ADX、Volume、VWAP、Bollinger Bands、MACD Divergence な
このインジケーターを購入された方には、以下の特典を 無料 で提供しています: 各トレードを自動で管理し、ストップロスとテイクプロフィットを設定し、戦略ルールに基づいてポジションを決済する補助ツール 「Bomber Utility」 様々な銘柄に合わせたインジケーターの設定ファイル(セットファイル) 「最小リスク」、「バランスリスク」、「待機戦略」 の3つのモードで使用できる Bomber Utility 用の設定ファイル このトレーディング戦略をすぐに導入・設定・開始できる ステップバイステップのビデオマニュアル ご注意: 上記の特典を受け取るには、MQL5のプライベートメッセージシステムを通じて販売者にご連絡ください。 オリジナルのカスタムインジケーター 「Divergence Bomber(ダイバージェンス・ボンバー)」 をご紹介します。これは、MACDのダイバージェンス(乖離)戦略に基づいた 「オールインワン」型のトレーディングシステム です。 このテクニカルインジケーターの主な目的は、価格とMACDインジケーターの間に発生するダイバージェンスを検出 し、将来の価格の動きを示す
Entry In The Zone and SMC Multi Timeframe is a real-time 2-in-1 market analysis tool that combines market structure analysis and a No Repaint BUY / SELL signal system into a single indicator, built on Smart Money Concepts (SMC) — a widely adopted framework used by professional traders to understand market structure. This indicator helps you see the market more clearly, make decisions based on structure rather than guesswork, and focus on high-probability zones where price is more likely to react
Azimuth Pro
Ottaviano De Cicco
5 (6)
Azimuth Pro V2:MT5向けシンセティック・フラクタル構造分析と確認済みエントリー 概要 Azimuth Pro は Merkava Labs によるマルチレベルスイング構造インジケーターです。4つのネストされたスイングレイヤー、スイングアンカーVWAP、ABCパターン検出、3タイムフレーム構造フィルタリング、そして確定バーでの確認済みエントリー — 1つのチャートで、ミクロスイングからマクロサイクルまでを網羅するワークフロー。 これはブラインドシグナル製品ではありません。ロケーション、コンテキスト、タイミングを重視するトレーダーのための構造ファーストワークフローです。 V2発売記念オファー — Azimuth Pro V2をUSD 399で(次の100本)。最終価格:USD 499。 1. V2での変更点 シンセティック・マルチタイムフレームエンジン 上位タイムフレーム分析をMeridian Proと同じ独自のシンセティックアーキテクチャで一から再構築。よりクリーンなHTFコンテキスト、安定したライブ動作、従来のMTF同期問題なし。シンセティックエンジンは 固定比率タ
Quantum TrendPulse を ご紹介します。これは、   SuperTrend   、   RSI   、および Stochastic のパワーを 1 つの包括的なインジケーターに組み合わせて、取引の可能性を最大限に引き出す究極の取引ツールです。精度と効率を求めるトレーダー向けに設計されたこのインジケーターは、市場のトレンド、勢いの変化、最適なエントリー ポイントとエグジット ポイントを自信を持って特定するのに役立ちます。 主な特徴: SuperTrend 統合: 現在の市場動向に簡単に追従し、収益性の波に乗ることができます。 RSI精度: 買われすぎと売られすぎのレベルを検出し、市場の反転のタイミングに最適で、SuperTrendのフィルターとして使用されます。 確率的精度: 確率的振動を活用して、変動の激しい市場で隠れたチャンスを見つけます。SuperTrend のフィルターとして使用されます。 マルチタイムフレーム分析:   M5 から H1 または H4 まで、さまざまなタイムフレームで市場を常に把握します。 カスタマイズ可能なアラート: カスタム取引条件が満たされ
このインジケーターを購入すると、プロ仕様のトレードマネージャーを無料で差し上げます。 まず第一に、このトレーディングシステムがノンリペイント、ノンリドロー、ノンラグのインジケーターであることを強調する価値がある。これにより、手動取引とロボット取引の両方に理想的なものになっています。 オンラインコース、マニュアル、プリセットのダウンロード。 「スマートトレンドトレーディングシステム MT5」は、新規および経験豊富なトレーダー向けにカスタマイズされた包括的なトレーディングソリューションです。10以上のプレミアムインジケーターを組み合わせ、7つ以上の堅実なトレーディング戦略を備えており、多様な市場状況に対応する多目的な選択肢となっています。 トレンドフォロー戦略:トレンドを効果的に乗り越えるための正確なエントリーとストップロス管理を提供します。 リバーサル戦略:潜在的なトレンドの反転を特定し、トレーダーがレンジ相場を活用できるようにします。 スキャルピング戦略:高速で正確なデイトレードおよび短期取引のために設計されています。 安定性:すべてのインジケーターはノンリペイント、ノンリドロー、ノ
Power Candles – あらゆる市場に対応した強度ベースのエントリーシグナル Power Candles は、Stein Investments が長年培ってきた強度分析を価格チャート上に直接反映します。価格だけに反応するのではなく、各ローソク足は実際の市場の強さに基づいて色分けされ、モメンタムの蓄積、強度の加速、明確なトレンド転換を瞬時に把握できます。 すべての市場に共通する単一ロジック Power Candles は すべての取引シンボル で自動的に動作します。現在のシンボルが Forex か非 Forex 市場かを自動判別し、内部で適切な強度モデルを適用します。 Forex および Gold :FX Power のデルタ値を使用(絶対値レンジ最大 100) 指数、暗号資産、CFD :IX Power の強度値を使用(絶対値レンジ最大 50) 必要な強度計算は Power Candles に直接組み込まれています。ローソク足のカラーリングやシグナルロジックに、追加のインジケーターは不要です。 価格ノイズではなく「強度状態」 各ローソク足は、以下の 9 つの明確に定義された強
OmniSync Projection
Antonio-alin Teculescu
5 (1)
Chronos Fractal Engine is an innovative price projection indicator for MetaTrader 5, designed to transform your technical analysis by intelligently identifying and projecting historical price patterns. Built upon an advanced correlation algorithm and the fractal principles of the market, this powerful tool visualizes potential future price movements, giving you a unique edge in your trading decisions. What is Chronos Fractal Engine? At its core, the Chronos Fractal Engine employs a sophisticat
FX Trend NG:次世代マルチマーケット・トレンドインテリジェンス 概要 FX Trend NG は、複数の時間足に対応したプロフェッショナル向けトレンド分析およびマーケット監視ツールです。 市場全体の構造を数秒で把握することができます。 複数のチャートを切り替える必要はありません。どの銘柄がトレンド中なのか、どこでモメンタムが弱まっているのか、そしてどの時間足で強い整合性があるのかを瞬時に確認できます。 ローンチ特別オファー – FX Trend NG を $30(6ヶ月) または $80 永久ライセンス でご利用いただけます。 すでに Stein Investments のユーザーですか? -> メッセージを送信 して、プライベートグループへアクセスしてください。 セットアップや詳細情報が必要ですか? -> Stein Investments 公式ページ をご覧ください。 1. FX Trend NG が他と異なる理由 3ステート・トレンドロジック ― Buy と Sell だけではない • 多くのインジケーターは Buy または Sell の2状態のみを表示します。
Gann Made Easy   は、ミスター・ギャンの理論を使用した取引の最良の原則に基づいた、プロフェッショナルで使いやすい外国為替取引システムです。 W・D・ガン。このインジケーターは、ストップロスとテイクプロフィットレベルを含む正確な買いと売りのシグナルを提供します。 PUSH通知を利用して外出先でも取引可能です。 ご購入後、取引方法の説明と優れた追加インジケーターを無料で入手するには、私にご連絡ください! おそらく、ギャンの取引手法についてはすでに何度も聞いたことがあるでしょう。通常、ギャンの理論は初心者のトレーダーだけでなく、すでにある程度の取引経験がある人にとっても非常に複雑なものです。なぜなら、ギャンの取引手法は理論的にはそれほど簡単に適用できるものではないからです。私はその知識を磨き、最良の原則を私の外国為替インジケーターに組み込むために数年を費やしました。 このインジケーターは非常に簡単に適用できます。必要なのは、それをチャートに添付し、簡単な取引推奨事項に従うだけです。このインジケーターは常に市場分析の仕事を行い、取引の機会を探します。適切なエントリーポイントを検
ご紹介     Quantum Breakout PRO は 、ブレイクアウト ゾーンの取引方法を変革する画期的な MQL5 インジケーターです。 13年以上の取引経験を持つ経験豊富なトレーダーのチームによって開発されました。     クォンタム ブレイクアウト プロ   は、革新的でダイナミックなブレイクアウト ゾーン戦略により、あなたのトレーディングの旅を新たな高みに押し上げるように設計されています。 クォンタム ブレイクアウト インジケーターは、5 つの利益ターゲット ゾーンを備えたブレイクアウト ゾーン上のシグナル矢印と、ブレイクアウト ボックスに基づいたストップロスの提案を提供します。 初心者トレーダーにもプロのトレーダーにも適しています。 量子EAチャネル:       ここをクリック 重要!購入後、インストールマニュアルを受け取るためにプライベートメッセージを送ってください。 推奨事項: 時間枠: M15 通貨ペア: GBPJPY、EURJPY、USDJPY、NZDUSD、XAUUSD アカウントの種類: ECN、Raw、またはスプレッドが非常に低い R
CGE Trading Suite
Carl Gustav Johan Ekstrom
5 (2)
Institutional-Grade Analytics for MT5 C GE Trading Suite delivers the analytical edge typically reserved for professional trading desks. The platform integrates a full suite of analytical tools into one seamless workflow: dynamic grid mapping, liquidity behavior analysis, ECM, trend lines, MIDAS, trade cycles, and directional channel projections. Together, these provide a unified view of market structure and momentum. Directional clarity is further enhanced by the capital flow index, which meas
まず正直に言いましょう。 どんなインジケーターも、それ単体であなたを利益化させることはできません。もしそう言う人がいるなら、それは夢を売っているだけです。完璧な売買シグナル(矢印)を表示するインジケーターは、いくらでも“完璧に見せる”ことができます。正しい過去の区間を拡大して、勝ちトレードだけを切り取ればいいだけです。私たちはそれをしません。 SMC Intraday Formula はツールです。 市場構造を読み取り、最も高い確率の価格ゾーンを特定し、今この瞬間のスマートマネーの痕跡をシンプルな言葉で正確に示します。最終判断はあなたが行います。トレードを実行するのもあなたです。しかし今は「希望」ではなく「精度」でエントリーできます。 私たちはこのインジケーターを、ゴールド(XAUUSD)および主要FX通貨ペアで約3年間、日々のスキャルピングに使用してきました。M1、M5、M15、M30の主要ツールです。これは未来を予測しようとするのではなく、今まさに形成されている高確率セットアップを示し、その理由を説明します。 他のすべてのインジケーターと何が違うのか? ほとんどのトレーディングイ
あなたのシンボルでどの戦略が実際に機能するか確認しましょう - リアルマネーをリスクにさらす前に。 Power Barは、あらゆるシンボルとあらゆるタイムフレームで 極端な価格バー を検出し、3つの異なるトレード戦略を即座にバックテストします。勝率、プロフィットファクター、損益を並べて比較できます。すべてが1つのインタラクティブなパネルに集約されています。 推測なし。カーブフィッティングなし。データだけです。 Power Barが特別な理由 ほとんどのインジケーターはシグナルを出すだけで、それが機能するかどうかは推測に任されます。Power Barはさらに先を行きます - すべてのシグナルを 3つの戦略 に対してテストし、統計を表示します。FlipFlop、Momentum、Reversalをワンクリックで切り替え、数値が即座に変化するのを確認できます。 FlipFlop - 常にポジションを保有。シグナルでエントリーし、反対シグナルでイグジット。当社のリサーチでは、US30、US500、DAXなどのトレンドのあるインデックスで最も効果的です。 Momentum - シグナルの方向に
優れたテクニカルインジケーター「Grabber」をご紹介します。これは、すぐに使える「オールインワン」トレーディング戦略として機能します。 ひとつのコードに、市場のテクニカル分析ツール、取引シグナル(矢印)、アラート機能、プッシュ通知が強力に統合されています。 このインジケーターを購入された方には、以下の特典を無料で提供します: Grabberユーティリティ:オープンポジションを自動で管理するツール ステップバイステップのビデオマニュアル:インジケーターのインストール、設定、取引方法を解説 カスタムセットファイル:インジケーターをすばやく自動設定し、最大限の成果を出すための設定ファイル 他の戦略はもう忘れてください!Grabberだけが、あなたを新たなトレードの高みへと導いてくれるのです。 Grabber戦略の主な特徴: 推奨タイムフレーム:M5〜H4 対応通貨ペア・資産:どれでも使用可能ですが、私が実際に検証した以下を推奨します(GBPUSD、GBPCAD、GBPCHF、AUDCAD、AUDUSD、AUDSGD、AUDCHF、NZDUSD、NZDCAD、EURCAD、EURUSD、E
まず第一に、この取引インジケーターは再描画されず、再描画されず、遅延しないことを強調する価値があります。これにより、手動取引とロボット取引の両方に理想的なものになります。 ユーザーマニュアル:設定、入力、戦略。 アトミックアナリストは、価格の強さとモメンタムを利用して市場でより良いエッジを見つけるためのPA価格アクションインジケーターです。ノイズや誤ったシグナルを除去し、取引ポテンシャルを高めるための高度なフィルターを備えています。複雑なインジケーターの複数のレイヤーを使用して、アトミックアナリストはチャートをスキャンし、複雑な数学的計算をシンプルなシグナルと色に変換します。これにより、どのような初心者トレーダーでも理解して使用し、一貫した取引の決定を行うことができます。 「アトミックアナリスト」は、新規および経験豊富なトレーダー向けにカスタマイズされた包括的な取引ソリューションです。プレミアムインジケーターとトップノッチの機能を1つの取引戦略に組み合わせ、すべてのタイプのトレーダーにとって汎用性のある選択肢にします。 デイリートレーディングとスキャルピング戦略:高速で正確なデイ
FX Power: 通貨の強弱を分析して、より賢い取引を実現 概要 FX Power は主要通貨と金の実際の強弱をあらゆる市場状況で理解するための必須ツールです。強い通貨を買い、弱い通貨を売ることで、 FX Power は取引の意思決定を簡素化し、高い確率の取引機会を見出します。トレンドを追従する場合でも、極端なデルタ値を使用して反転を予測する場合でも、このツールはあなたの取引スタイルに完全に適応します。ただ取引するだけではなく、 FX Power で賢く取引をしましょう。 1. なぜ FX Power がトレーダーにとって非常に有益なのか 通貨と金のリアルタイム強弱分析 • FX Power は主要通貨と金の相対的な強弱を計算し、マーケットダイナミクスに関する明確な洞察を提供します。 • どの資産がリードしているか、または後れを取っているかを監視して、取引するペアを賢く選びましょう。 マルチタイムフレームの包括的なビュー • 短期、中期、長期のタイムフレームで通貨と金の強弱を追跡し、マーケットトレンドに基づいて取引戦略を調整できます。 • スキャルピングからスイングトレード
Bill Williams Advanced is designed for automatic chart analysis using Bill Williams' "Profitunity" system. The indicator analyzes four timeframes at once. Manual (Be sure to read before purchasing) Advantages 1. Analyzes the chart using Bill Williams' "Profitunity" system. Signals are displayed in a table in the corner of the screen and on the price chart. 2. Finds all known AO and AC signals, as well as zone signals. Equipped with a trend filter based on the Alligator. 3. Finds "Divergence Bar
トレンド スクリーナー インジケーターでトレンド取引の力を解き放ちます。ファジー ロジックと複数通貨システムを活用した究極のトレンド取引ソリューションです。 ファジー ロジックを活用した革新的なトレンド インジケーターである Trend Screener を使用して、トレンド取引を向上させます。 これは、13 を超えるプレミアム ツールと機能、および 3 つの取引戦略を組み合わせた強力なトレンド追跡インジケーターであり、Metatrader をトレンド アナライザーにする多用途の選択肢となります。 期間限定オファー : トレンド スクリーナー インジケーターは、わずか 100 ドルで生涯ご利用いただけます。 (元の価格 50$ ) (オファー延長) Trend Screener の 100% 非再描画精度の揺るぎない精度を体験して、取引の決定が過去の価格変動の影響を受けないようにしてください。 マルチタイムフレームおよびマルチ通貨機能の多用途性を解放し、比類のない自信を持って外国為替、商品、暗号通貨、インデックスの世界を取引できるようにします。 Trend Screener の包括的な
BTMM State Engine Pro is a MetaTrader 5 indicator for traders who use the Beat The Market Maker approach: Asian session context, kill zone timing, level progression, peak formation detection, and a multi-pair scanner from a single chart. It combines cycle state logic with a built-in scanner dashboard so you do not need the same tool on many charts at once. What it does Draws the Asian session range; session times can follow broker server offset or be set in inputs. Tracks level progression (L
SignalTech MT5 is a trading system for EURUSD, USDCHF, USDJPY, AUDUSD, NZDUSD, EURJPY, AUDJPY, NZDJPY, CADJPY H2 and H3 Timeframe.  It can generate signals with Buy/Sell Arrows and Pop-Up/Sound Alerts. Each signal has clear Entry and Stop Loss levels, which should be automatically flagged on the chart, as well as potential Targets 1, 2, and 3. The Entry and TP levels are fixed after the trade is taken. The exit level is dynamic. If there are signs of a potential short-term trend reversal, the
Crystal Heikin Ashi Signals - Professional Trend & Signal Detection Indicator Advanced Heikin Ashi Visualization with Intelligent Signal System for Manual & Automated Trading Final Price: $149 ---------> Price goes up $10 after every 10 sales . Limited slots available — act fast . Overview Crystal Heikin Ashi Signals is a professional-grade MetaTrader 5 indicator that combines pure Heikin Ashi candle visualization with an advanced momentum-shift detection system. Designed for both manual traders
Berma Bands
Muhammad Elbermawi
5 (8)
Berma Bands (BBs) インジケーターは、市場のトレンドを特定して活用したいトレーダーにとって貴重なツールです。価格と BBs の関係を分析することで、トレーダーは市場がトレンド段階にあるか、レンジ段階にあるかを判断できます。 詳細については、[ Berma Home Blog ] をご覧ください。 バーマ バンドは、上部バーマ バンド、中部バーマ バンド、下部バーマ バンドの 3 つの異なる線で構成されています。これらの線は価格の周りにプロットされ、全体的な傾向に対する価格の動きを視覚的に表します。これらのバンド間の距離から、ボラティリティや潜在的な傾向の反転についての洞察を得ることができます。 バーマ バンドの線がそれぞれ離れると、市場が横ばいまたはレンジ相場の期間に入っていることを示すことがよくあります。これは、明確な方向性の偏りがないことを示しています。トレーダーは、これらの期間中にトレンドを特定するのが難しいと感じる可能性があり、より明確なトレンドが出現するまで待つ場合があります。 バーマ バンドの線が 1 本の線に収束すると、強いトレンド環境の兆候となること
Meridian Pro
Ottaviano De Cicco
5 (1)
Meridian Pro:MT5用プロフェッショナル・マルチタイムフレーム・トレンドマトリックス 概要 Meridian Pro は Merkava Labs が開発したマルチタイムフレーム・トレンドマトリックスで、方向性の状態、強度、モメンタムの状況、マトリックスの合意をひとつのコンパクトなパネルに集約します。ひとつのアダプティブエンジンがM1からW1まで一貫して適用されます。シンボルごとの調整は不要。インジケーターの積み重ねも不要。すべてのアセットとすべてのタイムフレームをカバーするひとつの構造化された読み取りです。 発売キャンペーン — Meridian Proを USD 99 (導入価格)で入手。通常価格:USD 149 。 1. Meridian Proが他と異なる理由 ひとつのエンジン、バラバラなインジケーターのダッシュボードではない 多くのMTFダッシュボードは、タイムフレームごとに生のインジケーター値を繰り返すだけです。Meridian Proはマトリックス全体でひとつのアダプティブ・トレンドエンジンを使用するため、パネルの各行が同じ構造化フレームワークから導出されます
Auto Optimized Parabolic RSI: 高度な3Dモメンタムエンジン ほとんどのリテール向けインジケーターは、市場のボラティリティが変化した瞬間に破綻する静的な入力値に依存しているため、失敗に終わります。Auto Optimized Parabolic RSIは、自らの数学的優位性を継続的に再計算することで「インジケーターの陳腐化」問題を解決し、機関投資家レベルの定量的適応力をMT5ターミナルに直接もたらします。 最大の強み: カスタムインメモリ3D最適化 標準的な自動最適化ツールは、インジケーターの呼び出しで端末に過負荷をかけるため、頻繁にMT5プラットフォームをフリーズさせます。本ツールは、このボトルネックを完全に回避しています。RAMベースのカスタムネイティブ計算機を内蔵した内部エンジンは、チャートを読み込んだりタイムフレームを変更したりするたびに、超高速の3Dグリッド探索を実行します。RSI期間(頻度)、SARステップ(加速度)、SAR最大値(制限速度)を同時にスイープし、プラットフォームを遅延させることなく、数万通りものパラメーターの組み合わせを絶対的なミ
ARICoin is a powerful trading companion designed to generate high-probability entry signals with dynamic TP/SL/DP levels based on volatility. Built-in performance tracking shows win/loss stats, PP1/PP2 hits, and success rates all updated live. Key Features: Buy/Sell signals with adaptive volatility bands Real-time TP/SL/DP levels based on ATR Built-in MA Filter with optional ATR/StdDev volatility Performance stats panel (Success, Profit/Loss, PP1/PP2) Alerts via popup, sound, push, or email Cust
IX Power MT5
Daniel Stein
4.92 (13)
IX Power: 指数、商品、暗号資産、外国為替市場の洞察を発見 概要 IX Power は、指数、商品、暗号資産、外国為替市場の強弱を分析するための多用途ツールです。 FX Power が全ての利用可能な通貨ペアデータを活用して外為ペアで最高の精度を提供する一方、 IX Power は基礎資産の市場データにのみ焦点を当てています。この特性により、 IX Power は非外為市場に最適であり、単純な外為分析にも信頼性の高いツールです。どのチャートでもスムーズに機能し、取引判断を向上させるための明確で実行可能な洞察を提供します。 1. IX Power がトレーダーにとって価値がある理由 複数市場での強弱分析 • IX Power は指数、商品、暗号資産、外為シンボルの強弱を計算し、それぞれの市場に合わせた洞察を提供します。 • US30、WTI、ゴールド、ビットコイン、または通貨ペアなどの資産を監視して取引機会を発見できます。 幅広い市場に適応 • 外為取引では、 FX Power が関連する全ての通貨ペアを分析することで比類のない精度を提供します。 • IX Power
MERAVITH SCANNERは、MetaTrader 5用のプロフェッショナルな金融市場インジケーターで、複数の分析ツールを一つの統合システムにまとめています。独自の出来高加重平均価格(VWAP)手法を使用してすべての計算を自動で行い、主観的な解釈を完全に排除します。 このインジケーターは、すべての資産クラス(FX、株式、指数、商品、暗号通貨)およびM1から月足までのすべての時間軸で動作します。基本原理は「価格は出来高に従う」というものです。MERAVITHは機関投資家の出来高が集中するポイントを特定し、その集中から数学的に正確な価格レベルを導き出します。予測や投機は行わず、計算のみを行います。 MERAVITH SCANNERを使用すると、28の主要FX通貨ペアをすべての時間軸でわずか2~3分でスキャンできます。また、任意の市場をスキャンすることも可能です。例えば、約100銘柄の株式を約10分でスキャンできます。 インジケーターは、消耗レベル、均衡線、偏差、統計レベル、およびターゲット予測を算出します。 チャート要素 Origin Point :すべての計算が始まる起点です。イン
Market Structure Patterns
Samuel Manoel De Souza
4.47 (19)
Available for   MT4   and   MT5 . Join the Market Structure Patterns channel to download materials available for study and/or additional informations. Related posts: Market Structure Patterns - Introduction Beyond Fancy Order Blocks: Using True Volumetric Analysis with Market Structure Patterns & Timeless Charts Market Structure Patterns – Complete SMC Indicator Guide (Concepts + Settings) Market Structure Patterns   is an indicator based on   smart money concepts   that displays   SMC/ICT   e
FX Levels: あらゆる市場における非常に高精度なサポート&レジスタンス 概要 通貨ペア、株式指数、個別銘柄やコモディティなど、どのような市場でも信頼できるサポートとレジスタンスを特定したいですか? FX Levels は伝統的な “Lighthouse” メソッドと先進的な動的アプローチを融合し、ほぼ汎用的な精度を実現します。ブローカーの実務経験を活かし、自動化されたデイリー更新とリアルタイム更新を組み合わせることで、 FX Levels は反転ポイントを見つけ、利益目標を設定し、自信をもってトレードを管理するための手助けをします。今すぐ試してみて、サポート/レジスタンス分析の正確性がどれほどトレードを向上させるかを実感してください! 1. FX Levels がトレーダーにとって非常に有用な理由 非常に正確なサポート&レジスタンスゾーン • FX Levels は異なるブローカー環境でもほぼ同一のゾーンを生成するよう設計されており、データフィードの差異や時刻設定のずれによる不一致を解消します。 • つまり、どのブローカーを利用していても一貫したレベルが得られるため、戦
作者のその他のプロダクト
The GGP Squeeze Momentum  MT4 Indicator is a volatility and momentum tool designed to help traders optimize their trading performance and providing traders with actionable insights to make well-informed trading decisions. This indicator is MT4 conversion of the Squeeze Momentum Indicator by “LazyBear “ in Trading View website and some alert methods are added to provide real-time alerts when a trading signal is generated, in order to allow traders to act quickly and efficiently. For MT5 version p
This indicator easily calculates the reward to risk ratio and indicates the stop out level and take profit limit with graphical boxes. Also shows the reward steps with fibonacci levels without changing the fibonacci default levels, this is a lot useful for people who use fibonacci retracement. Very user friendly interface and easily to use with graphical buttons.
GGP Trade Copier  EA is an automatic trading bot that can help traders automatically replicate the trading strategies and operations from one trading terminal to others by experiencing exceptionally fast trade copying system. Its easy-to-use setup allows you to copy trades between multiple MetaTrader terminals on the same Windows computer or Windows VPS with lightning-fast copying speeds of under 0.5 seconds. The software supports multiple trading varieties, including Forex, commodities, stocks,
The UT Bot Alert MT5 Indicator is an advanced technical analysis tool designed to help traders optimize their trading performance. This indicator is MT5 conversion of the UT Bot alerts indicator by “QuantNomad “ in Trading View website and some alert methods are added to provide real-time alerts when a trading signal is generated, in order to allow traders to act quickly and efficiently. Key Features: Alert Types: in addition to the terminal pop-up alerts, the mobile notification sends the alert
The   GGP Williams Vix Fix MT4   Indicator is based on the volatility of the market and grants a huge support for finding out when a correction is coming to end. This indicator is MT5 conversion of the CM_Williams_Vix_Fix Finds Market Bottoms Indicator by “ChrisMoody “ in Trading View website and some alert methods are added to provide real-time alerts when a trading signal is generated, in order to allow traders to act quickly and efficiently. For MT5 version please click here . Larry Williams
The GGP Wave Trend Oscillator MT4   Indicator is a volatility and momentum tool designed to help traders optimize their trading performance and providing traders find the most accurate market reversals. This indicator is MT4 conversion of the Indicator: WaveTrend Oscillator [WT] by “ LazyBear “ in Trading View website and some alert methods are added to provide real-time alerts when a trading signal is generated, in order to allow traders to act quickly and efficiently. When the oscillator is ab
The GGP ADX and DI MT4   Indicator is used to quantify trend strength. ADX calculations are based on a moving average of price range expansion over a given period of time. This indicator is MT4 conversion of the ADX and DI Indicator by “BeikabuOyaji “ in Trading View website and some alert methods are added to provide real-time alerts when a trading signal is generated, in order to allow traders to act quickly and efficiently. For MT5 version please click here . ADX is plotted as a single line w
The GGP SuperTrend MT4  Indicator is a technical analysis tool that can assist investors in identifying market trends. The indicator is based on ATR and is very useful for capturing the direction of an asset’s momentum and is widely employed when looking at stocks, currencies, and commodities. It plots a line on the price chart, which acts as a dynamic level of support or resistance, helping traders and investors make informed decisions about entry and exit points. This indicator is MT5 conversi
The GGP Trendlines with Breaks Alert MT4 Indicator is a technical analysis tool that can assist investors in identifying market trends. The indicator returns pivot point based trendlines with highlighted breakouts. Users can control the steepness of the trendlines as well as their slope calculation method. This indicator is MT4 conversion of the Trendlines with Breaks Indicator by “ LuxAlgo “ in Trading View website and some alert methods are added to provide real-time alerts when a trading sign
The   GGP Chandelier Exit Alert MT4   Indicator is a volatility-based indicator that identifies stop loss exit points for long and short trading positions. Chandelier Exit is based on the Average True Range (ATR) indicator. It is designed to keep traders in the trend until a defined trend reversal happens. Traders use CE to maximize their returns in a trade and make stop loss exit decisions. It is based on the principle that a trend reversal is highly probable when the price of an asset moves ag
This indicator shows: The market spread Current candle time left to be closed and the pips of market movement from the beginning of the day play sound when candle is going to be closed This is an extremely useful tool for watching the spread rise and fall, allowing you to enter the market at just the right time. This indicator will help you stay out of the market when the spread begins to rise and help you get into the market as the spread begins to fall again. very useful for day trading and s
GGP Trade Copier  EA is an automatic trading bot that can help traders automatically replicate the trading strategies and operations from one trading terminal to others by experiencing exceptionally fast trade copying system. Its easy-to-use setup allows you to copy trades between multiple MetaTrader terminals on the same Windows computer or Windows VPS with lightning-fast copying speeds of under 0.5 seconds. The software supports multiple trading varieties, including Forex, commodities, stocks
The UT Bot Alert MT5 Indicator is an advanced technical analysis tool designed to help traders optimize their trading performance. This indicator is MT5 conversion of the UT Bot alerts indicator by “QuantNomad “ in Trading View website and some alert methods are added to provide real-time alerts when a trading signal is generated, in order to allow traders to act quickly and efficiently. Key Features: Alert Types: in addition to the terminal pop-up alerts, the mobile notification sends the alert
The GGP Squeeze Momentum MT5 Indicator is a volatility and momentum tool designed to help traders optimize their trading performance and providing traders with actionable insights to make well-informed trading decisions. This indicator is MT5 conversion of the Squeeze Momentum Indicator by “LazyBear “ in Trading View website and some alert methods are added to provide real-time alerts when a trading signal is generated, in order to allow traders to act quickly and efficiently. For MT4 version pl
The GGP Williams Vix Fix MT5 Indicator is based on the volatility of the market and grants a huge support for finding out when a correction is coming to end. This indicator is MT5 conversion of the CM_Williams_Vix_Fix Finds Market Bottoms Indicator by “ChrisMoody “ in Trading View website and some alert methods are added to provide real-time alerts when a trading signal is generated, in order to allow traders to act quickly and efficiently. For MT4 version please click here . Larry Williams Deve
The GGP Wave Trend Oscillator MT5 Indicator is a volatility and momentum tool designed to help traders optimize their trading performance and providing traders find the most accurate market reversals. This indicator is MT5 conversion of the Indicator: WaveTrend Oscillator [WT] by “ LazyBear “ in Trading View website and some alert methods are added to provide real-time alerts when a trading signal is generated, in order to allow traders to act quickly and efficiently. When the oscillator is abov
The GGP SuperTrend MT5  Indicator is a technical analysis tool that can assist investors in identifying market trends. The indicator is based on ATR and is very useful for capturing the direction of an asset’s momentum and is widely employed when looking at stocks, currencies, and commodities. It plots a line on the price chart, which acts as a dynamic level of support or resistance, helping traders and investors make informed decisions about entry and exit points. This indicator is MT5 conversi
The GGP Trendlines with Breaks Alert MT5 Indicator is a technical analysis tool that can assist investors in identifying market trends. The indicator returns pivot point based trendlines with highlighted breakouts. Users can control the steepness of the trendlines as well as their slope calculation method. This indicator is MT5 conversion of the Trendlines with Breaks Indicator by “ LuxAlgo “ in Trading View website and some alert methods are added to provide real-time alerts when a trading sign
The GGP Chandelier Exit Alert MT5 Indicator is a volatility-based indicator that identifies stop loss exit points for long and short trading positions. Chandelier Exit is based on the Average True Range (ATR) indicator. It is designed to keep traders in the trend until a defined trend reversal happens. Traders use CE to maximize their returns in a trade and make stop loss exit decisions. It is based on the principle that a trend reversal is highly probable when the price of an asset moves agains
フィルタ:
レビューなし
レビューに返信