DragonsTail Indicator
- インディケータ
- バージョン: 2.10
- アクティベーション: 5

"Dragon's Tail" is an integrated trading system, not just an indicator. This system analyzes each candle on a minute-by-minute basis, which is particularly effective in high market volatility conditions.
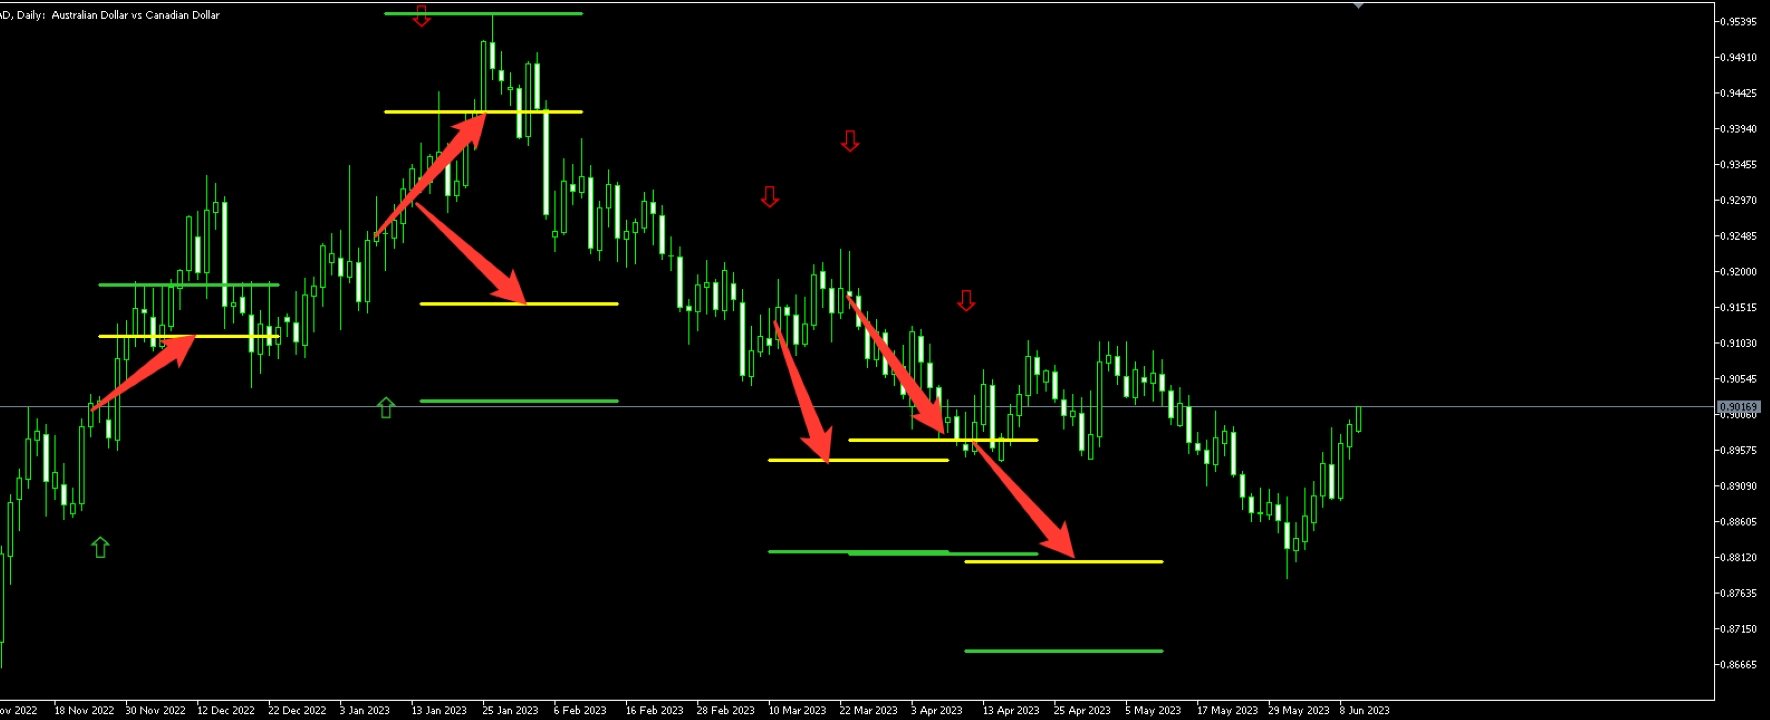
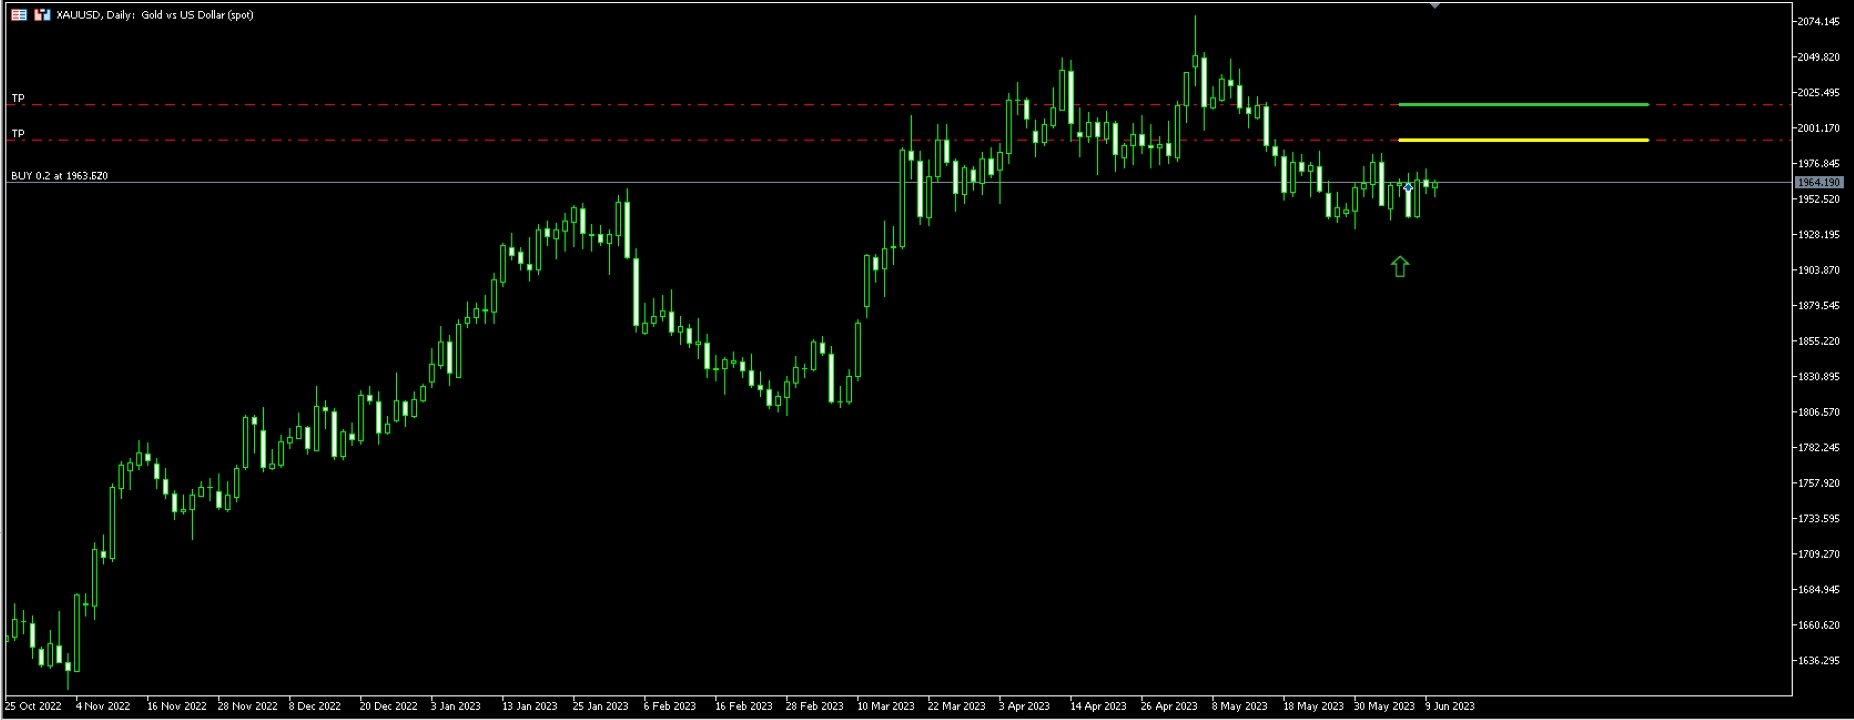
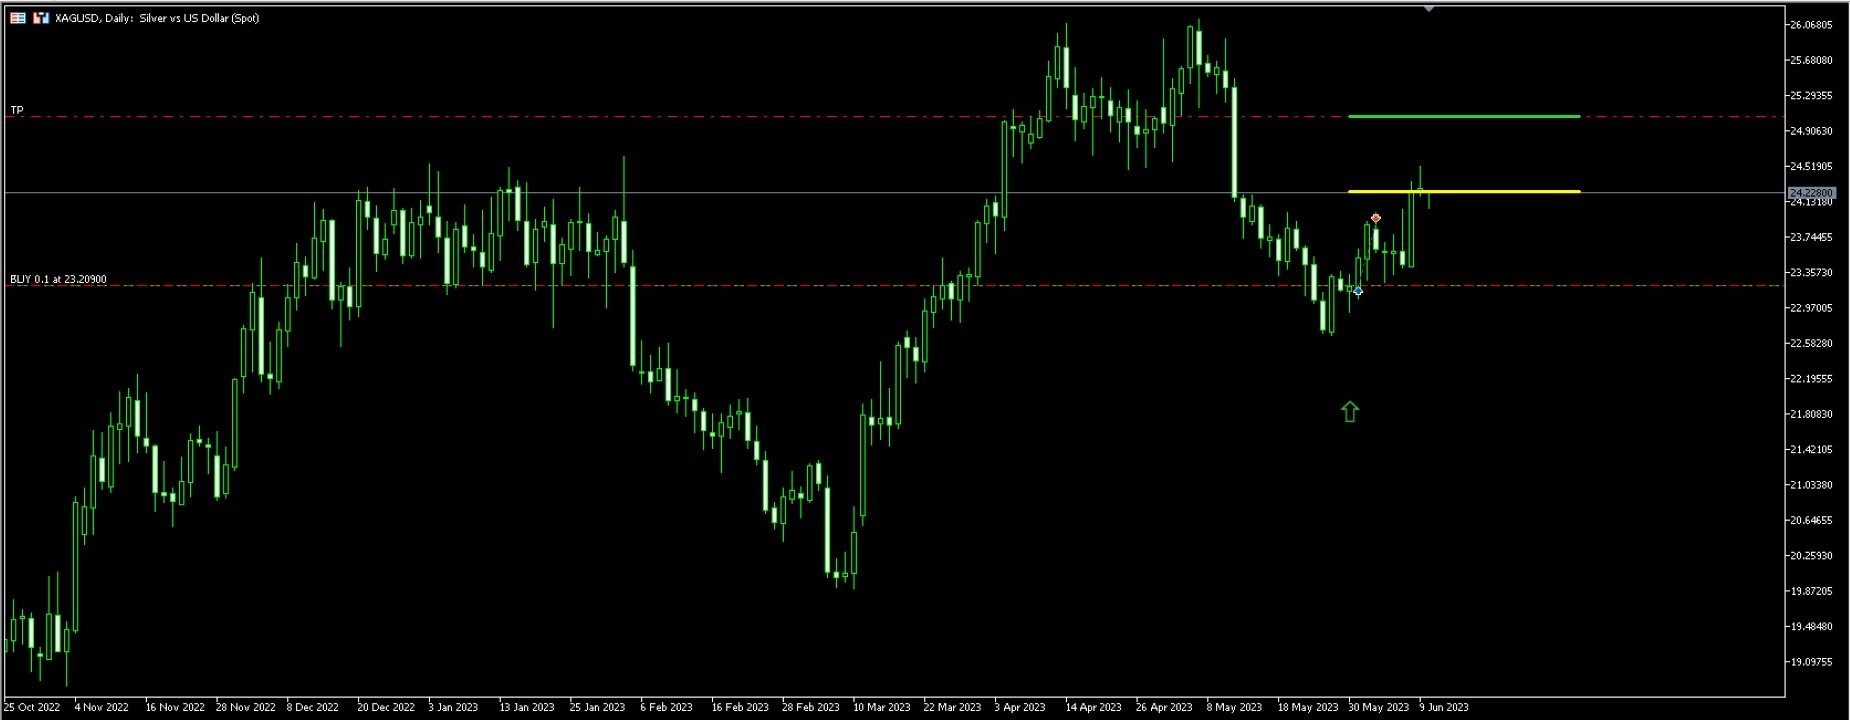
The "Dragon's Tail" system identifies key market moments referred to as "bull and bear battles". Based on these "battles", the system gives trade direction recommendations. In the case of an arrow appearing on the chart, this signals the possibility of opening two trades in the indicated direction. The yellow and green lines function as take-profit levels for the first and second trades respectively. After closing the first trade upon reaching the yellow line level, it is recommended to set a stop-loss for the second trade at the level of its opening.
The choice of timeframe and tools depends on the trader's preferences, however, for achieving optimal results it is recommended to use the H4 and D1 timeframes, taking into account the spread size of the selected instrument.
The settings parameters of "Dragon's Tail" can be divided into two groups:
- Parameters directly affecting trade results:
- History depth - only affects the display of entry points on the chart. Recommended values: D1 - 10, H4 - 15, H1 - 20.
- Take-profit 1 and take-profit 2 - affect the final result. Recommended values depending on the timeframe: D1 - 250/450, H4 - 150/250, H1 - 75/150.
- Parameters responsible for the visual design of the system. These can be set as per the trader's wish.
It's important to remember that "Dragon's Tail" is a system that requires active participation from the trader and cannot operate autonomously. It's crucial to monitor the load on your trading account and make decisions about averaging positions only in cases where it's justified from a market situation and your trading strategy standpoint.