 MetaTrader 5
 エキスパート
 インディケータ
 ライブラリ
ライブラリ
 ユーティリティ
 ウィジェット
 ルール
ルール
YouTubeにあるマーケットチュートリアルビデオをご覧ください
ロボットや指標を購入する
仮想ホスティングで
EAを実行
EAを実行
ロボットや指標を購入前にテストする
マーケットで収入を得る
販売のためにプロダクトをプレゼンテーションする方法
MetaTrader 5のためのエキスパートアドバイザーとインディケータ - 95
 自動売買ロボットとインジケータを使用して、外国為替取引の収益性を高めます。 自動売買ロボットを使用すると、取引の開始と終了を自動化でき、インジケータは市場の行動をより正確に予測するのに役立ちます。
このページには、MetaTrader5アプリケーションのカタログが掲載されています。
自動売買ロボットとインジケータを使用して、外国為替取引の収益性を高めます。 自動売買ロボットを使用すると、取引の開始と終了を自動化でき、インジケータは市場の行動をより正確に予測するのに役立ちます。
このページには、MetaTrader5アプリケーションのカタログが掲載されています。 
Pairs Spread ZScore — is a statistical pairs-trading indicator for two correlated instruments. By default it is configured for BTCUSD against ETHUSD, a widely traded crypto pair, but any two correlated symbols available on your broker can be used as the second instrument. How it works The indicator builds a normalized spread between the base symbol and a second symbol (Symbol2) using a rolling lookback window (Period). Both price series are standardized before the spread is calculated, so the
FREE

Candles is a comprehensive chart visualization indicator for MetaTrader 5 that transforms how traders view price action. Instead of displaying standard candlesticks, this indicator plots price bars using over 34 different moving average calculations, along with the traditional Heiken Ashi chart and the renowned Kagi chart. This unique approach provides traders with smoothed price visualization that filters out market noise while maintaining critical trend information. What Makes Candles Differen
FREE

Based on Brazilian trader André Moraes' Difusor de Fluxo theory, the indicator is a more reliable version of the original MACD. It is a great confirmation indicator for Swing Trading and also can be used as a Day Trading tool. If you are not familiar with the concept or André's trading strategies, I strongly recommend his excelent book named "Se Afastando da Manada" in which he explains in detail how this indicator is used. Even if you don't know the Portuguese language it is not difficult to un
FREE

RangeAnalyzer is an indicator designed specifically to analyze the impact of the dollar index price movement on currency pairs that include it, but it can also be used for:
News reaction analysis . Place lines 5 minutes before an important news release (NFP, inflation, interest rates) and an hour after. You'll instantly see which instrument generated the strongest movement and where the volumes have shifted. Currency Strength Index . For example, enter USD as the first value in the filter. The
FREE

Session Map - a free trading sessions and ICT KillZone indicator for MetaTrader 5. See at a glance when Sydney, Tokyo, London and New York open and close, and mark the high-probability ICT kill zones directly on your chart. The biggest moves happen when sessions overlap and during the London and New York kill zones. Session Map shades every session and kill zone automatically, labels each one, and can alert you before they start - so you are at the chart when volatility arrives. Features: Sydney
FREE
Indicator measures strength of each currency in your list.
Main idea: It simply iterates through all combinations of pairs and adds difference between open and close in percent. Parameters: List of currencies - what currencies will be calculated (maximum is 8) Calculation type - from which data will be strength calculated Calculation data input - used as input related to calculation type Symbol suffix - used in case of suffix on symbols, e.g: when your symbols look like EURUSDm, EURUSDmicro etc
FREE

Trade Risk Desk answers one question at the moment you need it answered: what volume makes this stop cost exactly what you decided to risk. Drag the stop line to where it belongs on the chart and the panel prints the volume, the money behind it, and the margin the position will hold. What It Answers Set the risk as a percent of balance or as a fixed amount in account currency. Put the stop where your idea says it belongs. The panel reads the symbol settings your broker publishes and prints: the
FREE

Complete Trade Manager (MT5)
Manages each open position individually Automate exit strategy (great for prop firm challenges) Use R: R based exit or Fixed Pips exit models Scale out of positions (3 x Targets possible) Breakeven after 1 st 2 nd or 3 rd partial take profit Trail Stop Loss Stop Break Even Fixed Target Exit (Without Partial Profit) Equity Target Based Exit Expect More features in the future Having a plan to exit with trades based on predefined set of rules provides consistency and
FREE

Краткое описание:
Индикатор для визуальной оценки стоимости ценового движения в валюте депозита с интерактивным вводом объема сделки прямо на графике. Описание:
PriceRiskRuler — новый инструмент для оценки финансового результата движения цены перед открытием позиции.
Индикатор отрисовывает вертикальный ценовой отрезок и рассчитывает его стоимость в зависимости от заданного объема и спецификаций торгового инструмента. Основные функции: Интерактивный ввод объема: Поле для ввода лота расположен
FREE
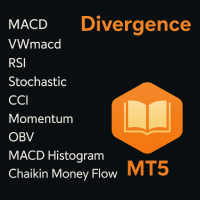
Multiple Divergence Detection System for MT5
マルチインディケータ「ダイバージェンス」検出および可視化ツール(Regular / Hidden、10種類のインジケータソース、軽量・高効率)
主要価値
• 一目でわかる統合表示:価格とインジケータの間で発生する**通常ダイバージェンス(Regular)および隠れダイバージェンス(Hidden)**を自動検出し、ラインとラベルで明確に表示します。 • 複数ソースの共鳴分析:MACD / MACDヒストグラム / RSI / ストキャスティクス / CCI / モメンタム / OBV / VWMACD / CMF / MFI を同時に分析。最小合成数を設定し、ノイズ信号を排除してより強力なダイバージェンスを抽出。 • 柔軟な表示制御:ラインやピボットの表示、インジケータ名の形式(フル・頭文字・非表示)、最新のセットのみを表示など、多様な設定が可能。 • 軽量で高速:最大バー数・ライン数・ラベル数を制限し、マルチタイムフレームや複数銘柄での同時稼働に最適化。
推奨通貨ペアおよび市場タイプ

Live Signal MT5 (Running since 2023): View Live Performance Preset File & Quick-Start Guide: Download Here MT4 Version: Velocity Algo MT4 Dynamic Grid Martingale for USDCAD — Adaptive, Proven, Running Since 2023. Velocity Algo is an Expert Advisor built specifically for the USDCAD M15 timeframe. It uses a Dynamic Grid Martingale strategy that adapts its lot sizing and grid spacing in real time based on current market volatility — making it flexible across a wide range of market conditio

Opening Levels Indicator MT5 Opening Levels is an MT5 indicator that displays open price levels from multiple timeframes directly on the chart. It provides a structured way to observe how price behaves around key reference levels such as the daily, weekly, and monthly open. Overview The indicator plots open price levels across selected timeframes and keeps them updated in real time. These levels can be used as reference points for: intraday trading levels market structure observation support and
FREE

Broker Preflight は、Expert Advisor を実行する前に現在の取引環境をすばやく確認するための無料 MetaTrader 5 ユーティリティです。 自動売買に影響する可能性のある口座、ターミナル、シンボルの主要な条件を分析し、PASS / WARNING / FAIL の分かりやすい形式で結果を表示します。 Broker Preflight は注文の発注、変更、決済を行いません。純粋な診断ツールとして動作します。 主な機能 口座モードを検出:Hedging、Netting、Exchange 取引および Expert Advisor の権限を確認 ターミナル接続と価格データの利用可否を確認 シンボルの執行方式と取引制限を表示 最小取引量、最大取引量、取引量ステップ、制限を表示 Stops Level と Freeze Level を確認 現在のスプレッドとシンボル仕様を表示 テストロットがブローカーの取引量ルールに適合するか確認 テストストップ距離がブローカーの制限を満たしているか確認 注文を出さずに利用可能証拠金を確認 欠落または利用不可のシンボルデータを検出
FREE

ダイナミックRSIガーディアン – 精密な取引と完全なリスク管理 ダイナミックRSIガーディアンは、一貫したパフォーマンス、厳格なリスク管理、柔軟性を重視するトレーダーのためのプロフェッショナルなアルゴリズム取引システムです。高度なピップベースの計算とRSI駆動のインテリジェントなフィルターを基盤としており、すべての取引が厳格なルールに従い、リスクを最小限に抑えつつ機会を最大化します。 主な機能 : スマートエントリーシステム
• RSIに基づく多層フィルター確認
• 高確率シグナルの検出とチャート上での矢印視覚化 完全なリスク管理
• リスクパーセンテージに基づく動的手数計算
• 最大ポジション数と取引チェック(過剰取引防止)
• 無効なストップロスレベルの保護 高度な出口戦略
• ATRまたは固定ピップに基づくトレーリングストップ
• 調整可能なストップロスとテイクプロフィット(ピップベース)
• ブローカーの制限に対応した自動ストップロス修正 ビジュアルHUDダッシュボード
• リアルタイムステータス(買い、売り、ブロック)
• 市場状況の表示
• シグナル追跡と分
FREE
Stop guessing where the market will turn. Our advanced High/Low Indicator for MT5 is the ultimate tool for mastering price action and identifying key market structure. It automatically scans the chart to identify and clearly plot all critical swing highs and lows in real-time, helping you see the true story behind the candles. These crucial, non-repainting levels form the backbone of any successful trading strategy. Use them to instantly visualize the market's framework, allowing you to pinpoint
FREE
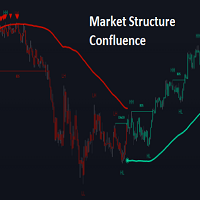
OVERVIEW
This script is called "Market Structure Confluence" and it combines classic market structure analysis with a dynamic volatility-based band system to detect shifts in trend and momentum more reliably. It tracks key swing points (higher highs, higher lows, lower highs, lower lows) to define the trend, then overlays a basis and ATR-smoothed volatility bands to catch rejection signals and highlight potential inflection points in the market.
CONCEPTS
Market structure is the foundation

Description:
The Dynamic Color Stochastic is an enhanced version of the classic Stochastic Oscillator that provides instant visual feedback on market momentum through color-coded line transitions. Unlike the standard indicator, this version automatically changes the color of both the Main (%K) and Signal (%D) lines based on their relative positions. This allows traders to identify bullish and bearish crossovers instantly without squinting at the lines. Bullish Momentum (Green): When the Main
FREE

Эксперт торгует по сигналам индикатора SystZ Trend Lines . Входные параметры: Take in atr, 0 - do not use a take profit - размер тейк профита по ATR (50) , рассчитанному на текущем таймфрейме. Если значение параметра равно 0, то не используется; Stop in atr, 0 - do not use a stop - размер стоп лосса. Если значение равно 0, то не используется; Risk factor, volume eq Equty*Risk factor/1000 - используется для расчета размера рабочего лота, который вычисляется как Эквити*Risk factor/1000. Нап
FREE

TradePilot MT5 は、トレードをほぼ完全にコントロールできる包括的なトレーディングパネルです。幅広い戦略に対応するよう設計されており、手動トレードとエンジンによる自動トレードの2種類の取引に基づいて構築されています。
1/ EAの手動機能 Multi-Positions = メインポジション:Stop Loss(SL)、Take Profit(TP)、ロットサイズの設定とともに常に開かれます。 サブポジション:0〜20の追加ポジション。
同じStop Loss(SL)とロットサイズを共有しますが、Take Profit(TP)はユーザーが設定した値に応じて段階的に増加します。
(例:TP増分 = 30ポイント → TP1 = 30、TP2 = 60 など。 モード:トグルボタンで3つのエントリーモードを選択可能:
MARKET、LIMIT、STOP。
保留注文はメインポジションとサブポジションの両方をトリガーします。 Basket Engine = バスケットにより、ポジションおよびポジショングループの情報(タイプ(Buy/Sell)、ポジション数、利益など)を確認でき
FREE

Haven QQE PRO - 全ての時間足におけるトレンドのビジュアルガイド Haven QQE PRO をご紹介します。これはQQEアルゴリズムをベースにした実用的なツールで、トレーダーの主要な課題である「現在のトレンドを迅速に特定し、その方向に沿って取引する」を解決するために作られました。このインジケーターは、複数の時間足のデータを一度に分析し、市場を支配しているのが買い手か売り手かを明確に示します。 その他の製品 -> こちら . チャートを切り替える必要はもうありません。意思決定に必要なすべての情報が1か所に集約されています。 具体的にどのようなシグナルを受け取れますか? このインジケーターは、連携して機能する3種類のビジュアルシグナルを提供します: マルチタイムフレーム・ダッシュボード(パネル)
これがあなたの主要な指針です。チャートの隅にあるパネルが、すべての主要な時間足(例:M5、M15、H1、H4)のトレンド状況( Bullish, Bearish, Sideways )を表示します。これにより、全体像を瞬時に把握できます。 サブウィンドウのヒストグラム

The advisor NewsCatcher Free opens trades when the price makes a reversal move from support and resistance levels. Market entries should be confirmed by the Relative Strength Index (RSI). The RSI is implemented as a tachometer. It is recommended to use this advisor in a highly volatile market after a political event or a release of major economic data.
You can use this advisor in the semi-automated mode (the RSI performs an information role) or in the fully automated mode (the RSI decides when t
FREE

Grid Ultimate EA – Documentation for MQL5 Market Overview Grid Ultimate EA is a fully automated trading system based on a grid strategy.
It places trades at predefined price intervals (grid steps) and manages them with take profit and optional stop loss levels. The EA is designed for major currency pairs and includes risk management features to protect account equity. Want to Collaborate or have any Queries? Contact Us By: Join Us on Telegram and also reach out via Email via Gmail: zenithlan
FREE

JYPF Trade Panel is a professional, interactive trading assistant for MT5. It features dynamic 3-line synchronization (Entry/SL/TP) with "Instant Click-and-Drag" technology. Avoid mouse blockages with our cutting-edge translucent trend-zone visualization. Real-time floating profit/loss projections and Risk-to-Reward (R:R) ratios are calculated instantly on your chart. Complete with one-click break-even, 50% partial close, trailing pips, and global equity protection—the ultimate toolkit for scalp
FREE

This is our version of the Bull Market Support Band indicator.
This indicator contains two moving averages: one simple and one exponential. Together, they represent a support band that can be used in both bull and bear markets.
Although originally designed for the weekly chart, it can be used on any timeframe.
Our version adds a candle coloring rule: green for closes above the band and red for closes below.
The default value is 20 for the Simple Moving Average (SMA) and 21 for the Exponentia
FREE

======================================================== GOLD WAVE MONSTER - MQL5/MT5 MARKET DESCRIPTION (formatting: **bold** = Bold button; lines with • = bullet list; UPPERCASE = heading) ========================================================
OVERVIEW ------------------------------------------------------- **Gold Wave Monster** shows the current chart's **Wave-3 start lines** and live **wave count**. When an H1/M15 Wave-3 line is broken upward it flags a BUY; broken downward, a SELL - vis
FREE

One Click Close Lite 是一款專為 MT5 手動交易者與多持倉使用者設計的簡易平倉工具。
當帳戶中同時存在多張交易持倉時,不需要再逐張點擊關閉,只需要透過圖表上的按鈕,即可快速執行批量平倉。
工具提供三個主要功能:
CLOSE ALL
一鍵關閉帳戶目前所有持倉。
例如帳戶中同時存在:
XAUUSD BUY EURUSD BUY GBPUSD SELL USDJPY BUY 按下:
CLOSE ALL
工具會依序嘗試關閉目前帳戶中的全部持倉。
---
CLOSE BUY
只關閉帳戶目前所有 BUY 持倉。
例如:
XAUUSD BUY EURUSD BUY GBPUSD SELL USDJPY BUY
按下:
CLOSE BUY
則會關閉:
XAUUSD BUY EURUSD BUY USDJPY BUY
而:
GBPUSD SELL
會保持不變。
CLOSE SELL
只關閉帳戶目前所有 SELL 持倉。
BUY 持倉不會受到影響。
---
即時持倉資訊
工具面板會顯示目前帳戶的基本持倉資訊,包括:
* 總持倉
FREE

Fer Goldhunter works by opening trades in favor of the trend, using three moving averages and an ADX filter. The EA has dynamic lot size, increasing based on account growth; take profit, stop loss, and trailing stop options are optimized to deliver optimal results on an M15 timeframe with XAUUSD (Gold/Dollar).
Characteristics: The bot is optimized to work with XAUUSD on M15 timeframe. It can be optimized for use with other symbols.
Recommended balance: 50 USD with a CENT account 500 US
FREE

XAU London Breakout H1 Expert Advisor for MetaTrader 5 — Gold / XAUUSD focus
Version: 1.00 What it is XAU London Breakout H1 is an Expert Advisor for gold on the H1 chart. London session range breakout participation for gold H1. Built for structured automated participation — not grid , not martingale . Evaluate on your broker and risk profile before any live use. This product is a technical system . Exact thresholds and entry equations remain internal product design and are not published here.
FREE

NovaTrend Adaptive Trend Strength ELITE A professional MT5 indicator that identifies trend direction, measures trend strength and highlights high-quality market activation points. Key features Clear 0–100 trend-strength display Bullish, bearish and neutral market states Adaptive market-regime detection Closed-bar, non-repainting signals Bullish and bearish activation markers Intelligent control of repeated signals Historical signals for chart evaluation Customizable calculation settings Compact
FREE

Symbols: USDJPY- recomended other JPY pairs - please try in backtest Timeframe: M5 Recomended: M5 Money management: Fix TP and SL Backtest 2020- 2024 till now ,lot size:0.2 Recomended Lot size settings: Deposit. Lotsize 1000€. 0.02 2000€. 0.04 5000€. 0.1 10000€. 0.2 You can Multiply lot size by 1,5x (more risky) Recomended other settings: deafult Note: Please use good money management If you need help or other recomendations please ask me More
FREE

FiboEvo FX: Hybrid Fibo & Adaptive Grid Strategy USE ON HEDGE ACCOUNTS ONLY Short Description "Graybox" Expert Advisor specialized in Forex . It combines technical Fibonacci entries, Flow Filters (VWAP/ADX), and an ATR Adaptive Grid system for position recovery. Overview FiboEvo FX was designed for dynamic Forex market conditions. It trades breakouts and Fibonacci retracements in favor of the trend. Its key differentiator is the Auto-Adaptive (ATR) system: instead of using fixed distances for th
FREE
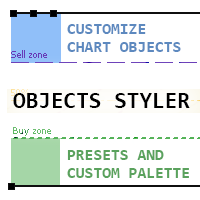
Objects Styler は、チャート上で標準的なグラフィックオブジェクトのプロパティを直接編集するための コンテキスト対応パネル を提供するユーティリティです。その主要機能は、ユーザーが複雑なスタイルセットをオブジェクトに保存・管理・即時適用できる強力な テンプレートシステム です。 主な機能 インターフェースと操作 コンテキスト起動: グラフィックオブジェクトをクリック(または Shift + クリック)することでパネルが起動します。すべての標準オブジェクトとそのほとんどのプロパティに対応しています。 ドラッグ可能なインターフェース: パネルはチャートの任意の場所に自由に移動できます。 ポップアップウィンドウ: スタイル選択、カラーパレット、タイムフレームリストなどの追加オプションはコンパクトなポップアップウィンドウで開き、メインインターフェースをすっきりと保ちます。 テンプレート管理システム スタイルの保存と適用: オブジェクトのプロパティの完全なセットを名前付きテンプレートとして保存できます。テンプレートはワンクリックで適用されま
FREE
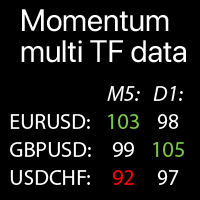
選択したシンボルのマルチタイムフレームモメンタム値:現在の市場トレンドを比較 この インジケーター は 、 選択した すべての タイムフレーム と シンボルの モメンタム インジケーター 値を 1つの テーブルに 表示 し、 現在の 市場 価格 トレンドを すばやく 分析 できます。
私の 多機能ユーティリティ : 66+ 機能 | ご質問はこちら まで | MT4版 各 シンボル はカスタマイズ可能です:削除/置換。最大40シンボルまで追加できます。 パネルはチャート上の任意の場所に移動できます(どこにでもドラッグできます)。
設定 で以下を構成できます: モメンタムインジケーター設定: 期間、適用価格タイプ 。 各タイムフレーム を有効/無効にできます 。 ハイライト オプション:有効にすると - キーレベルがカスタムカラーで強調表示されます。 極値(キーレベル) : 高値と低値; アラート : 極値レベルに対して有効にできます:高モメンタム/低 モメンタム /両方。 ビジュアル スタイル:サイズ、ダーク/ライトテーマ、ハイライトカラー。 モメン

The trend can change while your attention is focused elsewhere. And sometimes, by the time you notice that the market has changed direction, the move is already several candles ahead. Cartwright TrendTrace Classic makes the current direction and confirmed trend changes easy to recognize — clearly, visually and without filling your chart with unnecessary tools. The indicator transforms a standard moving average into a simple directional guide. The line turns blue when it is rising and red when it
FREE

AutoAdapt Pro - 通貨ペア用自己最適化エキスパートアドバイザー:GBPUSD, NZDUSD, EURCHF, USDCAD 基本パラメータ パラメータ 値 説明 最大注文件数 1 最大同時ポジション数 固定ロットサイズ 0.01 固定ロットサイズ 自動ロット使用 false 自動ロット計算(オン/オフ) リスクパーセント 10 自動ロット計算のリスク割合 スリッページ 3 ポイント単位のスリッページ マジックナンバー 54321 エキスパートアドバイザーID 自己最適化システム
️ 最適化パラメータ パラメータ 値 説明 最適化期間 1000 自己最適化分析のためのバー数 最適化頻度 9600 チェック間のティック数 最適化閾値 0.05 (5%) 新規自己最適化のトリガー閾値 最適化最大スプレッド 30.0 最適化のための最大スプレッド ️ 最適化可能なストップロスパラメータ パラメータ 最小値 最大値 ステップ ストップロス 20 200 20 最適化可能なトレーリングストップパラメータ パラメータ 最小値 最大値 ステップ 最小価格ショッ
FREE

Unleash the Power of Precision Trading Prime H1 Trader is a sophisticated, professional-grade EA engineered for the EURUSD currency pair on the H1 timeframe. This expert advisor isn't just another automated system; it's a meticulously crafted trading tool that integrates a powerful technical strategy to pinpoint optimal entry signals with high accuracy.
The core of Prime H1 Trader's strategy is its unique dual-indicator approach. It leverages Envelope signals as the primary market trigger , th
FREE
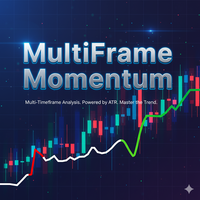
MultiFrame Momentum インジケーター (マルチタイムフレーム・モメンタム指標) MultiFrame Momentum は、 複数の市場時間軸 を同時に分析し、 方向性の収束 の瞬間を特定する高度なインジケーターです。その独自の設計は、異なる時間軸間でのモメンタムの一致を探し、 緑(強気) 、 赤(弱気) 、 灰色(中立) の間で変化するラインを通じて、明確な視覚的シグナルを生成します。 必須の 設定とテスト このインジケーターの有効性は、 時間軸のカスタム設定 に完全に依存します。すべてのトレーダーは、自分の戦略に最も適した時間軸の組み合わせをテストし、評価する必要があります。 スキャルピング (Scalping): M1 から M15 をアクティブにする デイトレード (Day Trading): M30 と H1-H4 を組み合わせる スイングトレード (Swing Trading): H4 から W1 に焦点を当てる さまざまな組み合わせをアクティブにしたり非アクティブにしたりして試行し、ご自身のトレーディングスタイルに最適な 設定 を見つけてください。 実践
FREE

Are you tired of erasing the objects on chart and then having to put them back in? What if you had a tool that would allow you to hide and show all objects any time? Cool, huh? That is why I developed this tool as an indicator. With it you hide all objects using a shortcut button on chart or the keyboard (customizable). If you have any suggestions or find a bug, please, contact us. Enjoy!
FREE

Session Highlighter V3.0F – Market Session Visualizer Overview The Session Highlighter is a professional MT5 indicator that automatically displays colored backgrounds for the three major trading sessions: Asia, London, and US . No more guessing when sessions open or calculating time zones – just look at your chart and see. What it does Draws three separate boxes on your chart (one for each session) Boxes grow dynamically with price during the session (highest high / lowest low) To
FREE

NIKA QUANT ANALYZER — MT5ストラテジーテスター専用最適化分析ツール
最適化結果のどれが本物で、どれがカーブフィッティングの罠かを推測するのはやめましょう。
Nika Quant AnalyzerはMT5ストラテジーテスターのXMLエクスポートを読み込み、QM+スコアで各パラメータ組み合わせを即座にランキング。PF、シャープレシオ、RF、最大DD、Return/DD、取引数を一つの数値に統合。
マルチファイルグローバルランキング対応:複数のXMLを配置するだけで、全パスをシンボル・タイムフレーム横断で統合ランキング。
主な機能
- QM+複合スコア — 一つの数字で意思決定。調整可能なウェイト公式。 - マルチファイルグローバルランキング — 複数XMLをロード。GLOBAL RANKとBY FILEモード切替。 - シンボル・タイムフレーム表示 — 各行にシンボルとTFを表示。 - QMスコア分布ヒストグラム — 対数スケールで品質レベル別分布。 - エクイティスパークライン — 各行にミニエクイティカーブ。 - 2ページダッシュボード — P1:
FREE

The Stochastic Momentum Index (SMI), developed by William Blau and featured in the January 1993 edition of Technical Analysis of Stocks & Commodities magazine, introduces a unique perspective to trading analysis. Distinguished from the conventional Stochastic Oscillator, which evaluates the current close in relation to the recent x-period high/low range, the SMI assesses the close's position relative to the midpoint of this range. This innovation yields an oscillator with a range of +/- 100, re
FREE

Emegencyrifyは、体系的な実行のために設計されたトレンドフォロー型トレーディングシステムです。トレンド要素とボラティリティフィルターを組み合わせて、市場の動きを特定し管理します。このシステムは、エントリーの整合性とリスク管理に焦点を当て、さまざまな市場環境でも安定性を維持します。
特徴
トレンド識別:特定のトレンド要素と出来高加重平均価格フィルターを使用して、トレードを市場の方向性に合わせます。 ボラティリティベースの管理:トレードの出口や調整は、ボラティリティ指標を使用して計算され、現在の市場状況に適応します。 ステルス執行:ポジションを内部的に管理するための仮想出口のオプションを含みます。 資金管理モデル:フラクショナルサイジングやボラティリティ調整済みロット割り当てなど、複数のサイズ決定モデルを提供します。 保護プロトコル:組み込みの安全機能が、日次のドローダウンとシンボル間の相関を監視します。
パラメータ
戦略アーキテクチャ
テンカンセン:短期トレンド要素の期間。 キジュンセン:中期トレンド要素の期間。 センコウスパンB:長期トレンド要素の期間。 Entr
FREE

Trade with Quotes for MT5 Inspirational indicator displaying scrolling trading quotes in English and Vietnamese, with a real-time bar countdown timer. Customizable font, speed, and position. Optimized for all timeframes, lightweight, and MQL5 Market-compliant. Toggle scrolling with Spacebar. Indicator truyền cảm hứng hiển thị quote trading chạy ngang bằng tiếng Anh và Việt, kèm bộ đếm ngược nến theo thời gian thực. Tùy chỉnh font, tốc độ, vị trí. Tối ưu cho mọi khung thời gian, nhẹ, đạt chuẩn MQ
FREE

TimeToClose The "TimeToClose" indicator is an essential tool for traders who need to monitor the remaining time before a candle closes. This indicator displays the remaining time directly on the BID line, providing a clear and precise reference during real-time trading. Key Features: Displays the remaining time for the current candle to close. Direct integration on the BID line for better visualization. Simple and user-friendly configuration. Ideal for all types of traders, from beginners to pro
FREE
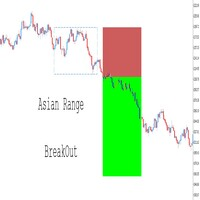
完全カスタマイズ可能 – レンジ時間、カラー、ラインスタイル、リスク・リワード設定などのパラメータを調整して、あなたのトレードスタイルに合わせてインジケーターをカスタマイズできます。 トレードレベルの視覚化 – ブレイクアウト条件に基づいて、エントリー価格、ストップロス (SL)、テイクプロフィット (TP) レベルを自動的に描画します。 エキスパートアドバイザー (EA) とシームレスに統合 – RSI、移動平均線、ブレイクオブストラクチャー (BOS) などの追加の確認を加えて、自動売買戦略を完全にコントロールできます。また、 バッファ名をカスタマイズ して EA の要件に適合させることで、戦略の柔軟性をさらに高められます。 マルチアセット & マルチタイムフレームのバックテスト – FXペア、仮想通貨、その他の金融商品 でさまざまな設定をテストし、最適なトレード戦略を見つけましょう。 シンプルで見やすいインターフェース – 非干渉型のデザインで価格アクションに集中でき、トレードシグナルを簡単に解釈できます。 このインジケーターはブレイクアウト戦略の 強固な基盤
FREE

私たちのインジケーターは、複数のペアのスプレッドを同時に監視するスプレッドスクリーナーを提供します。また、キャンドルタイマーのカウントダウンは、現在のバーが閉じて新しいバーが形成されるまでの残り時間を表示します。
期間限定オファー:すべてのプレミアムインジケーターはわずか50ドルでご利用いただけます。MQL5ブログにアクセスすると、プレミアムインジケーターのすべての詳細を確認できます。 ここをクリック。
主な機能 同時に広がるマルチペアを監視します。 現地時間ではなく、サーバー時間を追跡します。 構成可能なテキストの色とフォントサイズ CPU使用率を削減するために最適化 ペアのパーソナライズされたリスト。 コンタクト ご不明な点がある場合やサポートが必要な場合は、プライベートメッセージでご連絡ください。
警告 警告すべてのインジケーターとツールは、公式のMetatrader Store(MQL5 Market)からのみ入手できます。
著者 SAYADI ACHREF、フィンテックソフトウェアエンジニアおよびFinansyaの創設者
FREE

This indicator is based on the Parabolic SAR indicator. It helps the user identifying whether to buy or sell. It comes with an alert that will sound whenever a new signal appears. It also features an email facility. Your email address and SMTP Server settings should be specified in the settings window of the "Mailbox" tab in your MetaTrader 5. Blue arrow up = Buy. Red arrow down = Sell. Line = Trailing Stop. You can use one of my Trailing Stop products that automatically move the Stop Loss and i
FREE
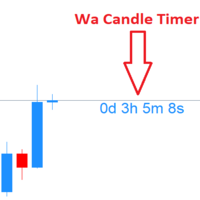
Wa Candle Timer MT5 は、次のローソク足が形成されるまでの残り時間をMT5チャート上に表示する、強力で使いやすいインジケーターです。ローソク足の終了時間を把握することで、より正確なトレードと意思決定を支援します。 主な機能 :
現在のローソク足のカウントダウンを表示
残り時間がユーザー定義のパーセンテージを下回ると色が変化
指定したパーセンテージに達するとアラート通知
フォントとカラーの完全なカスタマイズが可能
時間管理とトレード精度の向上 カスタマイズ可能な設定 :
1️⃣ 閾値以上のタイマー色
2️⃣ 閾値以下のタイマー色
3️⃣ フォントサイズ
4️⃣ フォントスタイル
5️⃣ アラート発生パーセンテージ(%)
FREE

TrendPro_MultiPairs_Lite
TrendPro_MultiPairs_Lite is a professional multi-currency Expert Advisor (EA) for MetaTrader 5, designed to identify high-probability trend opportunities while maintaining disciplined trade management. The EA is built for traders who want to automate trading across multiple Forex pairs from a single platform with a simple, efficient, and reliable trading system. this is lite free version with limited features, Pro Version will be available very soon with full features.
FREE

ValetTrader AUDCAD Stable Trading Instead of Chasing Fast Wealth ValetTrader AUDCAD is an automated trading Expert Advisor for MetaTrader 5, created for consistent long-term capital management. Its purpose is not to demonstrate extreme returns over a few weeks, but to seek a reasonable balance between profitability, trading exposure, and risk. ValetTrader is designed for traders who want to use automated trading without constant intervention, manual adjustment of dozens of parameters, or endless

SilentTrader Pro - Advanced Gann Square of 9 - V2.13 SilentTrader Pro is a professional implementation of W.D. Gann’s famous Square of 9 methodology for MetaTrader 5. The indicator generates dynamic Gann price levels from a selectable High or Low reference point, helping traders identify potential market reaction areas, cycle levels, and key support/resistance zones. Designed with a clean and interactive interface, SilentTrader Pro allows traders to manually control spacing, instantly reposition

M-Sync EA Description Stop guessing on news days. M-Sync News Trader is a semi-automated tool built for traders who want control and clarity during high-impact events like NFP, CPI, and rate decisions. It helps you plan, execute, and manage a professional news straddle — automatically placing Buy/Sell Stop orders before the event, triggering one as the news hits, and instantly cancelling the other. You define your rules, and M-Sync handles the rest.
Key Features Smart Straddle Setup: Automatica
FREE

Product Title: IQ Expected Move SAR SuperTrend Stop Guessing Volatility Boundaries – Trade Inside the Institutional Football Field! Do you know where the institutional boundaries of your asset are for today? Most retail traders place their stops and targets based on gut feeling, running straight into the traps of market makers. Institutions look at the mathematical expected range of the day to define their playground. The IQ Expected Move SAR SuperTrend engine calculates this institutional vo
FREE

This is a simple RSI indicator, but unlike the original one, it sends alerts when volume falls below the upper level or rises above the lower level, so you never miss a trading opportunity. Combined with support and resistance levels, it can provide strong entry opportunities into the market. I recommend keeping the levels as they are, i.e. 75 above and 25 below Check out my signal " PipStorm Invest ", save it to your favorites and come back from time to time to check it again :)
FREE
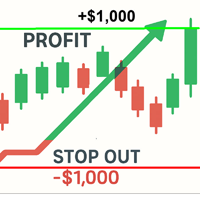
I s a professional visual radar for your trading account. The indicator calculates and displays the key mathematical levels of your open positions directly on the chart in real-time (fully accounting for commissions and swaps). No more blind spots or mental math: you will clearly see exactly where your desired profit will be reached and where the broker will forcefully close your account. Key Features Complete Margin Level Map: Automatic calculation and drawing of Margin Call, Stop Out, "Loc
FREE

What is Liquidity Sweep Reversal EA? Liquidity Sweep Reversal EA is an automated Expert Advisor based on Smart Money Concepts (SMC) . It identifies liquidity pools (swing highs and lows) and waits for the price to sweep those levels with a rejection wick, then enters a reversal trade in the opposite direction. This strategy exploits a well-known institutional behavior: market makers push price beyond obvious support/resistance levels to trigger retail stop losses and collect liquidity, before
FREE

Recovery Booster ついに登場 – 多くの EAオーナー が待ち望んでいたソリューションです。 お使いの EA は素晴らしいパフォーマンスを発揮しています。しかし、負けトレードの後、「今すぐ少しだけ 大きめのロット で取引できれば完璧なのに」と思うことがよくありませんか?なぜなら、次の取引は高確率で利益になるからです。
「課題のある」EAでのリアル運用パフォーマンス: 多くのEAはバックテストでは完璧に見えますが、 実際のドローダウン では苦戦します。Recovery Boosterは現在、これらの一番人気のある戦略の1つが 深い落ち込み を管理し、そこから回復するのをサポートしています。 結果はこちらでご確認いただけます: Recovery Boosterを使用したリアルシグナル Recovery Booster は、優れたEAが損失からより早く回復できるように支援する MetaTrader 5 用のトレーディングユーティリティです。 メインEA を監視し、 ドローダウン 期間中に、選択した ロット乗数 で追加のポジションをオープンします。 しかし、それだけではありませ
FREE

Neural FX is a high-performance automated trading solution specifically designed for the MetaTrader 5 platform. This system utilizes a sophisticated Trend-Following strategy to identify high-probability entries during strong market momentums, ensuring you stay on the right side of the market. Whether you are a professional trader or a beginner, this EA provides a "set-and-forget" experience with advanced risk management protocols.
FREE

Introduction to the Candle Time Indicator The Candle Time Indicator for MetaTrader 5, helps users know how much time on a candlestick is remaining.
Overview of Candle Time Indicator settings. TextColor: set the color of the countdown clock; FontSize: set the size of the font; Installation Guide Copy and paste the CandleTime.ex5 indicator files into the MQL5 folder of the Metatrader 5 trading platform. You can gain access to this folder by clicking the top menu options, that goes as follows: Fil
FREE

The Cybernetic Cycle Oscillator for MetaTrader 5 is an indicator designed to reduce the lag inherent in traditional indicators. This MT5 version is a direct adaptation of the classic CyberCyclesOscillator found on the Thinkorswim platform, whose mathematical logic is based on John Ehlers' developments presented in his book Cybernetic Analysis for Stocks and Futures . Mathematical Foundations and Code Structure Unlike conventional oscillators, which tend to react late to trend changes because the
FREE
Next Arrival : Flip or Die Trading Arena. Flip a trading account: https://flipordie.com/chapter-1-thirteen-doublings-double-a-trading-account/
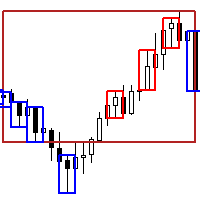
The Expert Advisor for this Indicator can be found here: https://www.mql5.com/en/market/product/116472 Introducing the Rejection Candle MT5 Indicator, a robust tool designed to revolutionize your trading experience on the MetaTrader 5 platform. Built to pinpoint potential reversals with precision, this indicator offers unparalleled insights into market
FREE
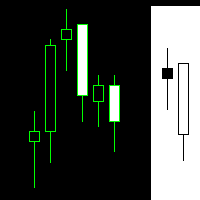
The Martinware Manual Trading Helper indicator is aimed at helping people start their lives in manual trading. It can be used to display both some generic images at the right side of the graph, where custom operational remarks may be displayed or just a blank rectangle hiding the chart while backtesting. Moreover, it can periodically play a list of sounds. To show a blank rectangle, let the first image name input field empty and select the desired color. To show one or more custom images inste
FREE

KS News Direction with Alert
これは、リアルタイムの経済カレンダー・ニュースパネルと、取引の方向性(バイアス)を示すシグナルを表示するMetaTrader 5(MT5)用カスタムインジケーターです。
主な機能
MT5内蔵の経済カレンダーからリアルタイムデータを取得。
設定可能な時間範囲(デフォルト:過去30時間~未来48時間)内の直近および今後のニュースイベントを表示。
指定した行数(デフォルト14行)まで表示可能。
重要度フィルター(トグルボタン):重要度「高(HIGH)」「中(MEDIUM)」「低(LOW)」のニュースを選択可能。
シグナル表示列(個別に切り替え可能、排他制御なし):
ゴールド(金)のバイアス
ピボット通貨(デフォルト:USD)のバイアス
イベント対象通貨のバイアス
パネル全体の表示/非表示をワンボタンで切り替え可能。
時刻はすべてローカルPCの時刻に変換して表示。
縦横の区切り線を用いた、すっきりとした列レイアウト。
直近の発表データに基づく通貨強弱(カレンシーストレングス)表をオプションで表示可能。
バイ

Reborn — A Trend Robot With Strategies Built In
Reborn is a trend-following trading robot built on the Investment Castle Indicator, with several ready-made strategies inside so you can match it to your style — from straightforward stop-loss and take-profit to kill-and-switch direction changes with recovery.
What it does for you Multiple built-in strategies: choose the approach that fits your market and risk appetite. Trend-driven entries: powered by the Investment Castle Indicator. Smart recov
FREE
Linear Regression Channel – Indicator The Linear Regression Channel is a custom MT5 indicator that plots a regression line through price over a specified number of bars, with dynamic support and resistance boundaries. Central Line (BlueViolet):
Represents the linear regression line (best-fit line) based on the selected price type (Close or High/Low). Upper Line ( Li me):
Represents the regression-based resistance level, adjusted dynamically according to the highest deviation from the regressi
FREE

MetaTrader 5 (MT5)用のUZFX - Delete Only Pending Ordersスクリプトは、取引口座からすべての未決注文(買い指値、売り指値、買い逆指値、売り逆指値)を自動的に削除するシンプルで効果的なツールです。このスクリプトは、有効な市場ポジションに影響を与えることなく、保留中の注文を即座に消去したいトレーダーに最適です。
私の他のMT4/MT5インジケーターとEAをチェックする >> こちら 特徴: すべての未決注文(買い指値、売り指値、買い逆指値、売り逆指値)を削除します。 未決済のマーケットポジションには影響しません。 Expertsタブを介してリアルタイムの執行フィードバックを提供します。 トレーダーが手動で操作することなく、未決注文のストラテジーを素早くリセットできます。 使用方法 MT5チャートにスクリプトを添付します。 スクリプトはすべての未決注文をスキャンし、自動的に削除します。 注: このスクリプトは有効な取引を決済するのではなく、未決注文を削除するだけです。 スクリプトを実行する前に、すべての未決注文を削除することを確認してくだ
FREE
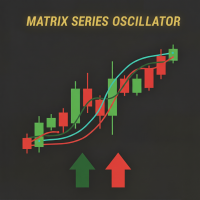
Matrix Series – Support, Resistance & Momentum Indicator Visualize key support/resistance zones, overbought/oversold levels, and market strength in a single indicator. The Matrix Series combines dynamic CCI , smoothed moving averages, and standard deviation bands to provide a clear view of market direction and critical levels. It colors candles according to bullish or bearish pressure and displays dynamic support/resistance zones along with visual overbought/oversold alerts. Main Features Trend-
FREE

Live MTF Trend Panel for MT5 Live MTF Trend Panel adalah indikator MetaTrader 5 yang menampilkan arah pergerakan candlestick secara real-time pada berbagai timeframe dalam satu panel modern dan ringan. Indikator ini dirancang khusus bagi trader yang ingin melihat kondisi market secara cepat tanpa menggunakan indikator teknikal tambahan. Berbeda dengan indikator trend pada umumnya, indikator ini tidak menggunakan Moving Average, RSI, MACD, ATR, ADX, Supertrend, Ichimoku, ZigZag, Fractal, Volume,
FREE
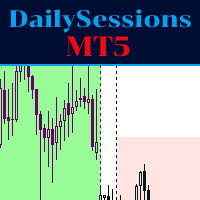
The indicator represents the session boxes for the Asian, European and American sessions. It is possible to change the time of each session, such as color. It is also possible to disable the display of each session. You will find in input parameters variables to modify in format hh:mm. In Colors tab you can change the color of boxes of each sessions. If you need some implementations please contact me.
FREE

A dual moving-average crossover Expert Advisor (EA) designed to provide traders with a transparent, rule-based trading system that is both easy to understand and highly customizable. Rather than relying on hidden algorithms or complex decision-making processes, this EA uses the classic crossover of two moving averages to identify potential market trends and generate buy or sell signals. Every aspect of the strategy can be adjusted, allowing traders to tailor the system to different market condit
FREE
MetaTraderプラットフォームのためのアプリのストアであるMetaTraderアプリストアで自動売買ロボットを購入する方法をご覧ください。
MQL5.community支払いシステムでは、PayPalや銀行カードおよび人気の支払いシステムを通してトランザクションをすることができます。ご満足いただけるように購入前に自動売買ロボットをテストすることを強くお勧めします。

取引の機会を逃しています。
- 無料取引アプリ
- 8千を超えるシグナルをコピー
- 金融ニュースで金融マーケットを探索