 MetaTrader 5
 Experts
 지표
 라이브러리
 유틸리티
 위젯
 규칙
MetaTrader 5용 무료 Expert Advisor 및 지표 - 95
 트레이딩 로봇과 지표를 사용하여 외환 거래를 더 수익성 있게 만들 수 있습니다. 트레이딩용 로봇을 사용하면 개점 및 폐점 거래를 자동화할 수 있으며, 지표는 시장 행동을 보다 정확하게 예측할 수 있습니다.
이 페이지에는 MetaTrader 5 응용 프로그램의 카탈로그가 나와 있습니다.
The Close In Quick Script is an optimized, high-performance MQL5 script designed to swiftly close all open positions for the current chart's symbol on the MetaTrader 5 platform. Engineered for speed and reliability, it leverages asynchronous trading, minimal system checks, and robust error handling to ensure seamless trade closure. Whether you're a day trader, scalper, or portfolio manager, this script is an essential tool for efficiently managing and exiting trades. Key Features: Asynchronous t
FREE
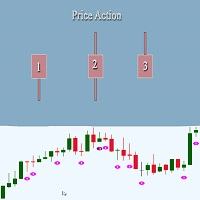
This indicator looks for 3 rather strong patterns: Spinning Top pattern Hammer or Hanging Man Inverted Hammer or Shooting Star These patterns may indicate a trend continuation or its reversal, depending on the location of the patterns.
Input parameters Distance - distance between the signal and the formed signal Note: the higher the timeframe, the greater the value should be used in Distance to display the signal correctly
Indicator Features Suitable for any currency pair Operating timeframe:
FREE
NewTest https://backoffice.aurum.foundation/u/DHXP1U
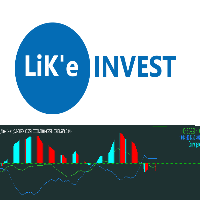
The 2indtompson indicator is an indicator for comparing two instruments for determining volumes, for balancing in pair trading or arbitrage trading, prepared from an analog version for the MT4 terminal. So if you need to compare how much two instruments will weigh and you don't know how to do it, then put an indicator on the chart and it will automatically calculate the volumes needed for balancing. Additionally, the indicator shows the stat
FREE

Our offer also includes a free panel — Indicator Panel — which allows you to show or hide indicators created by BOToBRACIA -> MT4 / MT5 Our offer also includes a version for MetaTrader 4 -> https://www.mql5.com/en/market/product/179248?source=Site+Market+Product+Page#description
Indicator Panel is a tool designed to manage the visibility of technical analysis objects generated by our indicators. Instead of enabling/disabling individual indicators or manually removing chart objects, a si
FREE

Max Drawdown Guardian watches your equity against the drawdown rule you trade under and acts before the rule is broken.
What it does - Static or trailing drawdown, measured from initial balance, peak equity or highest closed balance. A trailing limit can stop at the initial balance. - Eight ready-made rule presets (for example 10% static, 5% trailing from peak equity), or your own percentage or money amount. - Two warnings before the limit, at 50% and 75% by default, sent as a pop-up, a push n
FREE

Stochastic Multi-Timeframe Dashboard shows the Stochastic reading of four timeframes at the same time, so you can judge momentum across the market without opening several charts. By default it displays the M15, H1, H4 and D1 timeframes, and the K period, D period, slowing and levels are all configurable. Each timeframe is color coded, with red when the reading is overbought, green when it is oversold and grey when it is neutral, which makes extremes easy to spot. Alerts are based on the closed b
FREE

Sweep Hunter Basic is the simplified entry version of Sweep Hunter Pro for MetaTrader 5. It detects basic Buy-Side and Sell-Side Liquidity zones directly on the chart and marks simple sweep events. The Basic version is limited to 3 new zones per broker day and uses a reduced visual style. For the full version with dashboard, alerts, extended history, tooltips, advanced settings and unlimited zone workflow, visit Sweep Hunter Pro: https://www.mql5.com/de/market/product/177937?source=Site
FREE

Bitcoin Daily Top Bottom Engine
Bitcoin Daily Top Bottom Engine is a MetaTrader 5 indicator created for Bitcoin market structure analysis.
The indicator is designed to help traders observe daily price behavior, possible daily extreme areas, liquidity sweep conditions, and market status. It is a manual decision-support tool and does not execute trades automatically.
Overview
Bitcoin often moves through wide daily ranges. This indicator helps organize that movement into a simple structure vie
FREE

"Are you tired of losing money on unsuccessful trades? Look no further than EA Trailing Stop! Our program is designed to help you prevent losses and control your trades efficiently. With features such as adjustable stop loss and more, you can rest assured that your trades are in good hands. Don't wait any longer to start making successful trades. Try EA Trailing Stop today!"
You can use this as a starting point and tailor it to your audience and the platform you're using. This EA Trailing Stop
FREE

Spacing Audit measures the grid spacing your EA REALLY uses, from its own closed trades, not from its inputs and not from the gaps between open layers. Why: I spent a week believing my grid used ATR-based spacing because UseATR was true. It did not. Every pair sat on the minimum-spacing floor, 2.8x to 5.1x tighter than intended, and the book kept clogging. The inputs said one thing; 1,120 closed trades said another. The method: in a grid where each layer carries a take-profit one spacing away fr
FREE

Win Streak Size Creep Mirror는 오직 자신의 계좌에서 이미 청산된 거래 이력만 읽어서, 연승이 이어지는 동안 평소보다 큰 랏으로 새 포지션을 여는 패턴 하나만을 셉니다. 이 도구는 아무것도 예측하지 않고 아무런 조언도 하지 않습니다. 패널에 나오는 모든 숫자는 이 계좌에서 이미 일어난 일입니다.
숫자가 만들어지는 방식: 모든 종목과 모든 매직 넘버를 대상으로 최대 31일치 청산된 거래를 읽습니다 - 이는 차트의 종목만이 아니라 계좌 전체에 대한 그림입니다. 오늘 이전 30일 동안의 신규 진입 랏 크기의 중앙값을 계산해 30d median lot으로 표시하고, 같은 기간의 일별 신규 진입 건수 중앙값인 30d daily median도 함께 표시합니다. 둘 다 평균이 아니라 중앙값을 쓰는데, 이는 유난히 큰 거래 하나가 전체 기준을 왜곡하지 않도록 하기 위해서입니다. 이 30일 구간 안에 진입이 5건 미만이면 공정한 기준을 세우기에 이력이 충분하지 않다고 보고,
FREE
Volume Thermal Vision Basic은 널리 알려진 Volume Thermal Vision 지표의 간소화된 버전으로, 거래량 강도를 실용적이고 효율적으로 분석하려는 트레이더를 위해 설계되었습니다. 총 6가지 생생한 색상 수준을 제공하며, StealthMode, NightVision, FrostVision 모드를 통해 거래량 데이터를 명확하고 전략적으로 시각화할 수 있습니다. 이 인디케이터는 가볍고 직관적인 인터페이스로 초보자에게 이상적이며, 숙련된 트레이더의 분석 도구로도 매우 유용합니다. MQL5 Market에서 전체 버전으로 업그레이드하면, 고급 기능과 다양한 시각화 옵션을 통해 트레이딩 결정을 보다 효과적으로 내릴 수 있습니다. 거래 전략 최적화에 유용한 도구입니다.
FREE
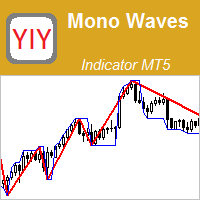
The Mono Waves indicator is designed to display the wave behavior of the market on a chart. Its appearance is presented on slide 1. This indicator uses the PPPC (Point-Percent Price Channel) indicator, which can be downloaded for free from the Market . When the market moves up, the upper border of the price channel is built on High candlestick prices (for more details, see the description of the PPPC indicator at the link given above). The higher the High prices rise
FREE

This indicator shows the direction of the trend and trend change. Ganesha Trend Viewer is a trend indicator designed specifically for gold and can also be used on any financial instrument. The indicator does not redraw. Recommended time frame H1. Ganesha Trend Viewer is perfect for all Meta Trader symbols. (currencies, metals, cryptocurrencies, stocks and indices..)
Parameter setting
MA Short Period ----- Moving Average short period MA Long Period ----- Moving Average long period Alerts ON
FREE

Smart money is a powerful currency. This money is available to major investors who can identify, predict or even generate capital movements ahead of others. This money can flow into financial and capital markets and create dramatic price changes in various stocks. Therefore, detecting smart cash flow, which usually enters the market in a coherent manner and confronts the volume and value of transactions in a market with high returns, is one of the methods that some investors use to invest. But h
FREE

Prop Guardian — 일일 손실 및 드로다운 모니터 (무료) OneFunded가 자체 발표한 데이터에 따르면, 프랍 펌(prop-firm) 평가에서 탈락하는 이유의 78.7%는 전체 드로다운이 아닌 '일일 손실 한도 초과' 때문입니다. 대부분의 트레이더는 전략이 실패해서 잃는 것이 아니라, 가장 중요한 단 하나의 숫자가 결정적인 순간에 화면에 보이지 않았기 때문에 실패합니다. Prop Guardian은 그 숫자를 당신의 화면 위에 바로 보여줍니다. 주요 기능 일일 손실 한도와 최대 드로다운을 금액 및 퍼센트(%)로 실시간 병렬 추적 트레이더가 설정한 건당 리스크(Risk-per-trade)를 바탕으로 남은 허용 손실금을 '남은 손실 거래 횟수'로 환산 3가지 드로다운 모드 지원: 고정(static), 트레일링(trailing), 트레일링 잠금(trailing-with-lock) — 각 프랍 펌의 실제 규칙 정의에 정확히 부합 한도에 도달한 후가 아니라 접근하기 전에 알려주는
FREE

使用此EA可以通过币安交易所的API连接到MT5交易端,利用MT5强大的量化功能实现交易策略的回测。 操作方法: 1、首先 必须 把( http://api2.0.mt5.vip 、 https://fapi.binance.com )这两个 地址 填写到:mt5——工具——选项——EA交易下的WebRequest列表中,否则所有数据无法同步。 2、在导航栏找到EA,双击之后添加币安的API KEY ,保存后KEY自动保存; 3、KEY保存后会出现交易面板,通过MT5下的订单可以实时展现在面板,同事也可以监控币安交易所是否有同样的订单; 4、交易面板只展示订单的总持仓,请仔细核对,以防止漏单; 5、API KEY会自动保存在本地,第二次打开后无需重复输入; 6、目前只能支持BTCUSDT、ETHUSDT、LTCUSDT合约产品 7、最小交易量以币安的最小交易量为准; 8、币安KEY是存储在本地,不会上传到任何第三方,请放心使用; 9、如果想更换KEY ,请直接在EA内修改即可。
FREE
ZigZag Reversal Detector Signals This is a technical indicator based on the ZigZag principle, designed to automatically detect market reversal points and generate clear buy and sell signals. Customizable Parameters ️: Level : Determines the sensitivity of the ZigZag to price changes. Ecart : Sets the minimum distance between two ZigZag points. Rebond : Adjusts the confirmation threshold for a reversal. Alerts & Notifications : Enable or disable according to your needs. Pe
FREE

EMA Offset Bands is a MetaTrader 5 indicator that plots a central EMA surrounded by percentage-based offset bands. The bands act as dynamic support and resistance that adjust automatically as the EMA moves. Features Central EMA trend line as the directional anchor. Percentage offset bands: upper and lower bands set as a percent of the EMA, so they scale with price. Dynamic support/resistance: the bands move with the market instead of being fixed lines. Simple, clean overlay that works on any sym
FREE
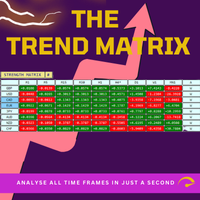
Trend Teller는 모든 주요 통화쌍과 모든 시간대(M1부터 MN1까지)의 시장 트렌드를 한눈에 파악할 수 있는 강력하고 직관적인 대시보드 도구입니다.
트레이더가 직접 만든 이 도구는 시장 트렌드 분석에서 추측을 제거하고, 더 큰 흐름에 맞춰 거래할 수 있도록 도와줍니다. 대부분의 초보 트레이더는 시장 방향을 파악하는 데 어려움을 겪으며, 심지어 숙련된 전문가들조차도 방향을 잘못 판단할 때가 있습니다. 그래서 Trend Teller는 초보자부터 전문가까지 모든 트레이더에게 이상적인 도구입니다. 주요 기능: 다중 시간대 분석
모든 주요 통화쌍의 강도와 방향을 즉시 스캔합니다. 스캘핑이든 스윙 트레이딩이든, Trend Teller는 모두를 지원합니다. 사용자 맞춤형 표시
데이터가 너무 많다고 느껴진다면? 걱정 마세요. 숫자만 표시하거나 색상 신호만 표시하거나, 원한다면 특정 시간대를 숨길 수도 있습니다. 내장 알림 기능
하루 종일 화면을 바라볼 필요 없습니다! 강한 추세나 거래 아
FREE

http://www.tradepositive.lat
Eleva tu Journaling al Nivel Institucional. Olvídate de registrar tus operaciones a mano, de los errores de cálculo y de la recolección tediosa de datos. TPI Notion Sync es la herramienta definitiva desarrollada por el Trade Positive Institute, diseñada para conectar tu plataforma MetaTrader directamente con tu base de datos de Notion en tiempo real. Diseñado originalmente para los traders del ALGO Smart Flow Model , este puente tecnológico extrae la matemática pur
FREE

Moving Average Sentiment "Transform Raw Market Data into Clear Sentiment Vision" Moving Average Sentiment is a next-generation adaptive trend sentiment indicator that visualizes the true bias of the market — bullish, bearish, or neutral — in real time. It combines Moving Average dynamics with ATR-based volatility zones , creating a fluid, self-adjusting sentiment curve that reacts instantly to price structure and volatility shifts. This tool goes beyond a simple MA — it reads the behavior of th
FREE

설치 전에 확인하십시오: 이 도구가 하지 않는 것. 이 부분을 먼저 읽으십시오. 아래 항목 중 하나가 찾으시는 기능이라면 이 도구는 맞지 않으며, 차트에 올리기 전에 아는 것이 낫습니다.
- 가상 스탑이나 숨김 스탑은 절대 없습니다. 모든 스탑은 브로커 서버에 실제로 등록되는 스탑이며, 브로커와 프랍 회사 모두에게 보입니다. 어느 쪽에도 아무것도 숨기지 않는 것이 설계 원칙입니다. - 차트당 하나의 심볼. 무료 버전은 부착된 차트의 심볼만 거래합니다. 여유 한도 예측도 이 패널이 이 심볼에서 수행하는 거래만을 대상으로 합니다. 여러 심볼을 동시에 거래하신다면 예측이 계좌 전체를 볼 수 없습니다. 이는 단일 차트 도구의 실제 기능 한계이지, 꺼 놓은 기능이 아닙니다. - 스트래티지 테스터 거래 불가. 클릭 패널은 테스터에서 의미 있게 클릭할 수 없습니다. 패널이 그려지기는 하지만 그것이 전부입니다. - Risk Sentinel 또는 Prop Guardian과 같은 차트에서 사용할
FREE

# ️ VUI LÒNG ĐỌC KỸ TRƯỚC KHI SỬ DỤNG CHỈ CẢNH CẢNH KHÔNG!
** Trước khi bắt đầu sử dụng công cụ Fibonacci này, vui lòng dành thời gian đọc kỹ tất cả các chi tiết, hướng dẫn và cảnh báo về sự chênh lệch giá thị trường bên dưới. Bạn đã thành công trong giao dịch và đảm bảo an toàn vốn phụ thuộc vào việc hiểu các quy tắc này. Cảm ơn bạn đã dành thời gian và tâm huyết!**
---
### ️ HƯỚNG DẪN SỬ DỤNG & ĐO LƯỜNG THỦ CÔNG
Việc sử dụng công cụ này cực kỳ đơn giản, trực quan và nhanh chóng. Vui lò
FREE

Market Strike SignalBox Market Strike SignalBox is a clean visual indicator that draws structured trade zones directly on the chart: Entry , Stop Loss , TP1 , and TP2 .
It is designed for traders who want a fast, “at-a-glance” view of potential setups without complicated dashboards. This product is NOT an Expert Advisor and does not open/close trades . It provides visual signals only . What You Get on the Chart When a valid signal is detected, the indicator will display: Entry level Stop Loss (S
FREE

AutoPilot Trading Service for MetaTrader 5 is an advanced application designed to enhance the MT5 platform by automating and optimizing both manual and algorithmic trading activities. By integrating seamlessly into the (recommended but not mandatory) <terminal_directory>\MQL5\Services directory, this service not only supports the automation of trading strategies but also improves the execution of trades, whether they are initiated manually or through Expert Advisors (EAs). The AutoPilot Trading
FREE

Input Description The indicator provides flexible options to display trading history directly on the chart, including: Days to show Profit
Displays only trades executed within the last X days from the current time. Font Size
Allows selecting the font size used to display trade information on the chart. Show Volume
Enables or disables the display of trade volume for each position. Show Currency
Enables or disables the display of the currency unit for profit values. Color for Win Trade
Sets t
FREE

Indicator and Expert Adviser EA Available in the comments section of this product. Download with Indicator must have indicator installed for EA to work.
Mt5 indicator alerts for bollinger band and envelope extremes occurring at the same time. Buy signal alerts occur when A bullish candle has formed below both the lower bollinger band and the lower envelope Bar must open and close below both these indicators. Sell signal occur when A bear bar is formed above the upper bollinger band and upper
FREE
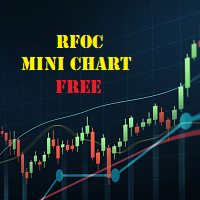
The RFOC Mini Chart was created to project a macro view of the market, which the option to select the timeframe of interest other than the main chart, it is possible to include 2 indicators: 1 - Moving average channel On the mini chart, the moving average will be created based on the prices of the selected time frame for the RFOC Mini Chart. The moving average period must be selected in the indicator settings pannel.
2 - Boillinger Band In the mini chart, a boillinger band will be created based
FREE

The indicator shows your profit and loss (PnL) for the current day right on your trading chart. Anchored at the top-right corner, it displays "PnL: [amount]"—green if you’re up, red if you’re down, white if it’s zero. Every time you close a trade, it updates instantly, adding up your profits, commissions, and swaps from all buys and sells trades since midnight. No fuss, no extra charts—just real-time feedback on how your day’s going.
FREE

A indicator for detecting FVGS
I hope this helps you scalp and generate money for yourself
NOTE BETTER:
Trading is risky and you can lose all your funds , use the money you are willing to lose
NOTE BETTER:
Trading is risky and you can lose all your funds , use the money you are willing to lose
NOTE BETTER:
Trading is risky and you can lose all your funds , use the money you are willing to lose
FREE
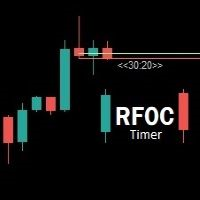
Uma informação de grande valor para o trader se localizar no tempo é a informação de quanto tempo temos para o encerramento do candle atual ou quanto falta para a formação de um novo candle. O RFOC Timer apresenta esta informação de forma clara e alocada à direita do candle atual. Adicionalmente o RFOC Timer acompanha a opção de inclusão das linhas de preços ASK e BID com e sem extensão a direita e/ou esquerda. Esta função auxilia, por exemplo, a não sobreposição das linhas de ASK e BID com as
FREE

The POC_Levels indicator calculates and displays the 3 most frequently occurring price levels (Points of Control – POC) based on historical candles. It is useful for identifying areas of high market interest (like support/resistance zones) across any timeframe. How It Works
The indicator analyzes the last LookbackBars candles. It counts how many times each price level (based on the selected price type) appears. Then it selects the top 3 most frequent prices and draws horizontal lines at those l
FREE
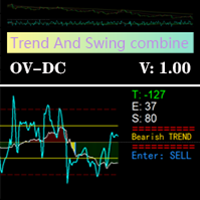
Based on the trend-following principle of CCI, it has been improved to become an indicator that can identify the reversal of the trend and its development direction, that is, it can identify the top and bottom attenuation of the oscillating trend in the trend market. feature The red and green columns represent the trend of bullish or bearish development under the current cycle. The blue line shows the position and attenuation of the current price trend in the current cycle. The upper and lower
FREE

1. The principle of InequationEurUsdChf4 intelligent trading system: The three currency hedge unbalanced arbitrage is the extension and continuation of the triangle arbitrage. As a common arbitrage method, triangle arbitrage has been used by many investors in foreign exchange trading. Triangle arbitrage is based on cross exchange rates, which is the basis of triangle arbitrage. The so-called cross exchange rate refers to the price of a non-US dollar currency expressed by another non-US dollar
FREE

SMC Donchian CandleBlend The SMC Donchian CandleBlend for MetaTrader 5 is a powerful indicator that simplifies your chart analysis by coloring candles based on a fusion of signals from two powerful indicators: the "SMC Donchian Trend Breakout" and the "SMC Donchian Fusion ZigZag". This provides a clear and immediate visual representation of market sentiment, helping you to make more informed trading decisions. Key Features: Fused Signal Logic: The indicator intelligently combines signals from t
FREE
Introduction to GARCH Indicator GARCH is the short initial for Generalized Autoregressive Conditional Heteroskedasticity and it is the volatility prediction model commonly used in financial industry. GARCH model was first appeared in the work by Danish Economist, Tim Peter Bollerslev in 1986. The 2003 Nobel Prize winner, Robert F Engle also added much contribution for the refinement of GARCH model with Tim’s work. Our GARCH INM predictor took the original method of Nelder Mead for GARCH model bu
FREE

Made for Educational purposes. Check the YouTube video for full details. This is a simple RSI mean reversal strategy using the RSI 2 made popular by Larry Connors. It's been updated using some machine learning. How to use: Add to daily SP500 chart. IMPORTANT. Change name of subchart to the name of SP500 your broker uses.
What this strategy does It buys when price drops hard, but only if interest (volume) is picking up — then sells after a strong bounce. Entry (when it buys) 1. RSI(2) < 10 P
FREE

이 지표는 EA의 일부입니다: HIPERCUBE PRO GALE BTC Darwinex Zero 20% 할인 코드: DWZ2328770MGM_20
Donchian 지표의 새로운 버전 소개
새로운 버전의 Donchian 지표 를 소개하게 되어 기쁩니다. 최첨단 개선과 더 높은 정밀도로 설계되었습니다. 이제 완전히 HiperCube Pro Gale 에 적합하도록 업데이트되어 보다 효과적인 거래를 위한 원활한 경험을 제공합니다.
이 버전이 혁신적인 이유:
HiperCube Pro Gale에 적합 : 이번 최신 업데이트는 HiperCube Pro Gale 과의 통합을 위해 특별히 설계되어 거래 전략의 최대 호환성과 효율성을 보장합니다. 뛰어난 성능 : Donchian 지표는 시장 동향을 추적하기 위한 인기 있는 도구였으며, 새로운 버전에서는 최적의 성능을 위해 기능이 개선되었습니다. 검증된 효과 : 시장 움직임을 예측하는 능력을 통해 Donchian 지표는 더 높은 정확성과
FREE

The Previous High Low Levels indicator displays the high and low of the previous candle from a selected higher timeframe. This helps traders identify key support and resistance zones while trading on lower timeframes. Features:
Plots the previous high and low from a higher timeframe
Works on all timeframes and instruments
Helps identify strong support and resistance levels
Lightweight and does not repaint How to Use: Select a higher timeframe (e.g., H1, H4, D1) in the settings. T
FREE

프로프 펌 및 개인 리스크 관리 규칙은 대개 특정 드로다운 지표(대부분 고정된 시간에 재설정되는 일일 한도)를 기준으로 수립되는데, 거래 중에는 해당 한도에 비해 현재 상황이 정확히 어느 정도인지 파악하기 어려울 수 있습니다.
Phoenix Drawdown Meter는 변동 드로다운이나 사상 최대 드로다운이 아닌, 거래일 시작 시점(자정 재설정)의 계좌 잔액 대비 드로다운 비율을 추적하므로, 화면에 표시되는 수치는 대부분의 일일 리스크 규칙에서 실제로 사용하는 측정 기준과 일치합니다.
리스크 가시성을 유지하는 방식
- 자정 잔액을 기준으로 한 일일 드로다운 비율의 실시간 게이지
- 사용자 지정 가능한 세 가지 임계값(녹색/노란색/빨간색)으로 개인 위험 한도 설정
- 바늘 움직임이 부드럽게 처리되어 티크마다 수치가 급격하게 변동하지 않음
- 드로다운이 빨간색 구간에 진입할 때 알림 제공(사용자 지정 가능한 쿨다운 시간 적용)
피닉스 드로다운 미터를 사용하여
FREE

Helios Smart Position Manager 개요 Helios Smart Position Manager는 MetaTrader 5를 위한 전문 거래 동기화 도구입니다. 어떤 포지션의 손절 또는 이익 실현을 수정하면 EA가 자동으로 변경 사항을 감지하고 동일한 심볼의 다른 모든 포지션에 적용합니다. 이를 통해 각 포지션을 개별적으로 수동 업데이트할 필요가 없어지며, 동일한 종목에서 여러 거래를 관리할 때 시간을 절약하고 오류를 방지합니다. 작동 방식 EA는 모든 미결 포지션을 지속적으로 모니터링하고 현재 손절 및 이익 실현 수준의 스냅샷을 유지합니다. 포지션의 SL 또는 TP가 변경된 것을 감지하면 동일한 심볼의 다른 모든 포지션을 식별하고 동일한 수정을 자동으로 적용합니다. 동기화는 충돌을 방지하기 위한 내장 쿨다운 기간과 함께 한 번에 하나의 변경 사항을 처리하며, 동기화 루프를 피하기 위해 방금 수정한 포지션은 건너뜁니다. 손절과 이익 실현의 변경은 독립적으로 감지됩니다.
FREE

This indicator is based on the Moving Average indicator. It helps the user identifying whether to buy or sell. It comes with an alert that will sound whenever a new signal appears. It also features an email facility. Your email address and SMTP Server settings should be specified in the settings window of the "Mailbox" tab in your MetaTrader 5. Blue arrow up = Buy. Red arrow down = Sell. Line = Trailing Stop. You can use one of my Trailing Stop products that automatically move the Stop Loss and
FREE

트레이더라면 누구나 아는 절차가 있습니다. 지표 설정을 열고, 숫자를 바꾸고, 확인을 누르고, 차트를 눈을 가늘게 뜨고 들여다보고, 아니라고 판단한 뒤 다시 설정을 엽니다. Relative Vigor Index는 설정할 숫자가 기간 하나뿐이지만, 내 종목에서 10과 14를 비교해 보고 싶을 때마다 그 한 번의 설정창 왕복이 똑같은 '바꾸고 노려보기' 과정을 요구합니다. RVI Live Tuner가 그것을 끝냅니다. 이것은 차트 위에서 실시간으로 조절하는 고전적인 2선 구성의 RVI(RVI와 그 Signal)입니다. 차트 위에 기간 슬라이더가 달린 작은 패널이 놓입니다. 슬라이더를 끌면 두 라인이 보는 앞에서 즉시 다시 계산되고 다시 그려집니다. '10이냐 14냐' 하는 질문은 포럼 글이 아니라 내 차트에서 몇 초 만에 답이 나옵니다. 껍데기가 아닌 진짜 RVI. 이 지표는 교과서적인 계산을 직접 구현합니다. 4개 봉에 대칭 가중치를 준 close-to-open 움직임과 high-to
FREE

MT5 Visual Theme Indicator – Clean Chart and Full Customization Enhance the appearance of your charts in MetaTrader 5 with this fully customizable visual indicator, designed to provide a clean, modern, and easy-to-read trading environment. This indicator does not generate signals or open trades. Its sole function is to optimize chart visualization to help you analyze the market with greater clarity. If you find this useful, please leave a 5-star rating and follow me for future tools, indicators,
FREE

The Horse DCA Signal 1.26 – สุดยอดนวัตกรรมอินดิเคเตอร์สำหรับการเทรดทองคำและทุกสินทรัพย์ The Horse DCA Signal คืออินดิเคเตอร์รุ่นล่าสุดจากตระกูล WinWiFi Robot Series ที่ได้รับการออกแบบมาเพื่อยกระดับการเทรดบนแพลตฟอร์ม MT5 โดยเฉพาะ โดยเป็นการผสมผสานอัจฉริยะระหว่างกลยุทธ์ Follow Trend และ Scalping เข้าด้วยกันอย่างลงตัว คุณสมบัติเด่น: ระบบลูกศรแยกประเภทชัดเจน: ลูกศรสีทอง: บ่งบอกสภาวะตลาดช่วง Sideway เหมาะสำหรับการเทรดแบบ Swing Trade หรือ Scalping เก็บกำไรระยะสั้น (2) ลูกศรสีน้ำเงินและสีแดง: บ่งบอกส
FREE

Market Scanner EA – Smart Multi-Asset Trading Scanner Market Scanner EA is a powerful, real-time decision-support trading tool designed for serious traders who want clarity bias before entering any trade. This EA scans multiple instruments simultaneously and delivers clear directional bias, momentum strength, and session-based performance — all in one clean dashboard. No noise. No guesswork. Just actionable market insight . MY OTHER EA and INDICATOR TREND BASED (MULTI SYMBOL) Solo Le
FREE

The Retracement indicator shows the current and historical high, low and mid values. Optionally, it can also display major retracement levels. All these levels together form the significant levels of support and resistance. Therefore, it is essential to know them for every kind of trader.
Levels High Low Midpoint 76,4 % 61,8 % 38,2 % 23,6 %
Main features The indicator shows the actual levels of High, Low, Mid and selected retracements. Four optional retracement levels. Alert notifications
FREE

PositionsLimiter EA: Enforcing Trade Discipline with Position Limits The PositionsLimiter EA is a powerful risk management tool designed to help traders control the number of open positions at any given time. By allowing traders to set a maximum limit on simultaneous trades, this EA ensures that no additional trades exceed the specified threshold. If a trader or another automated system attempts to open a new position beyond the set limit, the EA will automatically close the excess trade, ensur
FREE
This indicator is suitable for trend identification, price channel definition and trading signal generation. It combines smoothness, adaptability and visual clarity, which makes it useful for scalping, day trading and swing trading.
Technical details: Hull Moving Average (HMA) – provides a smooth trend line without lags.
Super Smoother – reduces "noise" and creates a smooth curve.
Channel Width – adapts to the timeframe (e.g., narrower on M1, wider on D1).
Debug Logging – enabled in the con
FREE
A "simple design" trading panel, which is characterized by small byte size, low CPU usage, simple steps, and quick operation, 1 to 2 clicks to complete a functional operation,
saving time and increasing efficiency . The panel is easy to use, and it is not complicated to set parameters, which is in line with traders' habits. At the same time, its compact-
design, clear at a glance, and comprehensive functions are a powerful tool for manual trading! Key features of the panel: Click "Bid/Ask P
FREE
If you use several charts open at the same time, you know how boring it is to apply formats to each chart individually. This script can change all open charts using a single command. Parameters: 1 - Choose symbol to put on charts: apply the selected symbol to all charts. If "current", it does not change the symbol; 2 - Choose timeframe or leave empty: apply the selected timeframe to all charts. If "CURRENT", it does not change the timeframe; 3 - Apply template to the charts: If true, apply the t
FREE

Introducing the "Cybercycle Trend" Forex Oscillator, a powerful technical indicator designed to enhance your trading experience in the foreign exchange market. This innovative tool utilizes advanced algorithms to identify and analyze market trends, providing you with valuable insights and helping you make informed trading decisions.
The Cybercycle Trend Forex Oscillator is specifically designed to detect and measure cyclical price movements in the forex market. By incorporating this oscillator
FREE

El Trend Detection Index (TDI) es un indicador técnico introducido por M. H. Pee. Se utiliza para detectar cuándo ha comenzado una tendencia y cuándo ha llegado a su fin. El TDI puede usarse como un indicador independiente o combinado con otros; se desempeñará bien en la detección del comienzo de las tendencias.
Los indicadores de tendencia son esenciales para detectar las tendencias de los mercados financieros. Estos indicadores ayudan a determinar la dirección que probablemente siga el activ
FREE

The euro index on your chart, built live from your own broker's five euro pairs. When EURUSD falls you cannot tell from EURUSD alone whether the euro is weak or the dollar is strong. An index answers it. Put this under any chart and you are looking at the euro on its own terms, measured against the pound, the yen, the franc and the krona as well as the dollar. It uses the New York Board of Trade Euro Currency Index formula. EUR/USD 31.55% EUR/GBP 30.56% EUR/JPY 18.91% EUR/CHF 11.13% EUR/SEK 7.85
FREE
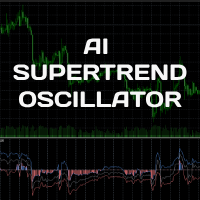
The AI SuperTrend Clustering Oscillator identifies three key outputs—bullish, neutral, and bearish—derived from variations between multiple SuperTrend indicators. FUNCTIONALITY The oscillator consists of three primary elements: Bullish Output : Represents the most optimistic signal, always the highest value. Bearish Output : Reflects the most pessimistic signal, always the lowest value. Consensus Output : Falls between the bullish and bearish outputs, serving as an overall trend indicator. A
FREE
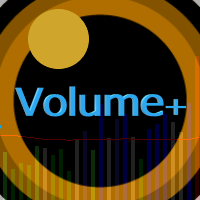
The Volume Plus indicator for MT5 can be effectively used for detecting imbalances in supply and demand.
The indicator improves on the typical volume histogram by coloring the bars.
Bar colors (colors are customizable):
Neutral - DimGray Wide Spread (Range) Bar on High Volume - MediumBlue Narrow Spread, High Volume - MidnightBlue Wide Spread, Low Volume - ForestGreen Narrow Spread, Low Volume - DarkGreen Very/Ultra Wide Spread, Low Volume - Aqua Narrow Spread, Ultra High Volume - Purple Very/
FREE

Overview Copy Trades Master is a high-performance local signal broadcaster for MetaTrader 5. It tracks active positions on your master account in real time and streams execution data directly to one or multiple SlaveCopier terminals running on the same PC or local network via ultra-fast local file IPC ( FILE_COMMON ). https://www.mql5.com/en/market/product/189485 Key Features Local Common-File IPC: Uses local file streaming ( MQL5\Files ) for near-zero latency execution without requiring externa
FREE

Product name: BVCandleStream Overview Background service that automatically creates custom tick-based symbols (equal-tick bars) for scalping and price action analysis.
It converts raw ticks of standard symbols into custom bars with a fixed number of ticks per bar, so you can apply any standard MT5 indicators or EAs to these synthetic tick charts.
Key Features 1. Tick-Based Bar Generation Monitors the symbol of the open chart and automatically groups ticks into bars at the specified count ( InpT
FREE

Description This is an indicator for MT5 which has enhanced the "Fractals" indicator. "Fractals" indicator is included in MT5 by default but the draw line period is fixed at "5" and it cannot be modified. Thus I have reinvented the Fractals indicator with some useful function added. This tool will be useful especially for those who are learning how to draw good horizontal lines and wants to get some reference. Of course, those who are considering Fractals as an important horizontal line wil
FREE

Unlock the power of trend analysis with the Candle Trend Bars Indicator – your go-to tool for identifying and understanding market trends like never before. This innovative indicator transforms traditional candlestick charts into a dynamic and visually intuitive representation of market trends. Key Features: Trend Clarity: Gain a clear and concise view of market trends with color-coded bars that instantly convey the direction of price movements. User-Friendly Design: The indicator is designed wi
FREE

TimePeriodLabels – See where new periods start on any chart A clean indicator that draws vertical lines and labels when a new year, month, week or day begins. No more squinting at dates or placing manual lines every time you open a chart. Each period type has its own colour and style so you instantly know what changed. What it does Detects when the day, week, month or year flips on the current timeframe. Draws a vertical line at the first bar of the new period. Adds a text label (for day, month
FREE
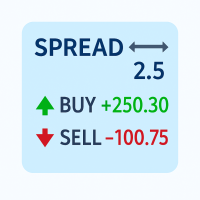
Track your spread and all position PnLs (Buy & Sell) in real-time – stay in control of your trades at a glance!
Features: Real-time spread display (in pips) Total Buy position PnL Total Sell position PnL Clean, non-intrusive display layout Works with all symbols and timeframes Perfect for: Scalpers needing quick spread awareness Day traders monitoring long/short performance Risk managers optimizing exposure No need to switch tabs or rely on external tools — everything you need is visible at
FREE

Elliott Wave PRO MTF & SQX Engine: Manual Técnico Este indicador es un sistema algorítmico avanzado que escanea el mercado buscando la estructura clásica de Ondas de Elliott (Impulso 1-5 + Corrección ABC). Combina volatilidad adaptativa (ATR), fuerza de tendencia (ADX), filtros Multi-Timeframe (MTF) y una salida de datos especializada para integrarse con constructores de estrategias automáticas como StrategyQuant X. ️ 1. Parámetros de Entrada (Inputs) Los parámetros están agrupados lógicame
FREE

Trade Details Tracker is a lightweight yet powerful chart-panel designed to give traders instant visibility into their open positions. Instead of checking multiple terminal tabs, this indicator displays real-time trade statistics directly on the chart , helping you manage risk, monitor exposure, and make faster decisions. Key Features Real-Time Trade Overview
Instantly view Buy & Sell trade counts for the active symbol. Automatic Breakeven Calculation
Volume-weighted breakeven
FREE

Euro Range Sniper M5 is an automated trading EA specifically designed for EURUSD range market conditions.
It utilizes price deviation from recent highs and lows to identify overextended market movements and executes counter-trend entries. While based on a simple concept, the EA is designed to deliver stable performance with low drawdown.
Instead of following trends, this EA focuses on capturing price reversals within a range, making it suitable for relatively stable market environments.
Ba
FREE

Exponential Moving Average (EMA) Indicator The Exponential Moving Average (EMA) is one of the most widely used indicators in technical analysis.
It smooths out price fluctuations to help traders identify market trends more clearly — without being too slow to react to price changes. Unlike the Simple Moving Average (SMA), the EMA gives greater weight to recent prices , making it more responsive to new market information. This makes it ideal for traders who want to detect trend reversals earlier o
FREE

PEAK MASTER LITE – PRECISION RESISTANCE NAVIGATOR
Peak Master Navigator is a non-repainting technical indicator designed to accurately identify and visualize structurally confirmed resistance levels in real time.
It detects valid swing highs based on market structure confirmation rules, ensuring that only meaningful and reliable resistance points are displayed on the chart. By filtering out weak or premature highs, Peak Master Navigator helps traders focus on true price reaction zones , improvi
FREE
The Average Force Indicator is a technical analysis tool designed to measure the strength of price movements by analyzing both momentum and volatility. This indicator is based on the Force Index , which combines price changes and volume data, but with a smoothing mechanism to provide a clearer and more stable reading of market dynamics.
Key Features: • Momentum and Trend Strength Measurement – Helps traders identify the intensity of buying or selling pressure. • Smoothed Force Index Calcula
FREE

Stop guessing. Start reading the market like a pro. The MBS Indicator is a powerful multi-timeframe trend scoring system designed to give you a clear, data-driven bias using the most trusted tools in trading: EMA • RSI • ATR • Stochastic No more indicator clutter.
No more confusion.
Just one clean panel that tells you exactly what’s happening. WHAT THIS INDICATOR DOES The MBS Indicator analyzes the market across: D1 (Daily Trend) H4 (Structure Direction) H1 (Entry Momentum) It then combines ev
FREE
MetaTrader 마켓은 거래로봇과 기술지표를 판매하기에 최적의 장소입니다.
오직 어플리케이션만 개발하면 됩니다. 수백만 명의 MetaTrader 사용자에게 제품을 제공하기 위해 마켓에 제품을 게시하는 방법에 대해 설명해 드리겠습니다.
