TrendPulse Dashboard
- インディケータ
-
Pavan Balu Dokhale
 I am an entrepreneur and dedicated trading professional with over 5 years of experience navigating global financial markets. As a funds management consultant and strategic gold trader, I specialize in spot gold trading, employing advanced EA that utilize leading technical indicators like EMA, RSI
 - バージョン: 1.0
This is my ea 🥇
Gold Structure Hunter EA
https://www.mql5.com/en/market/product/174076?utm
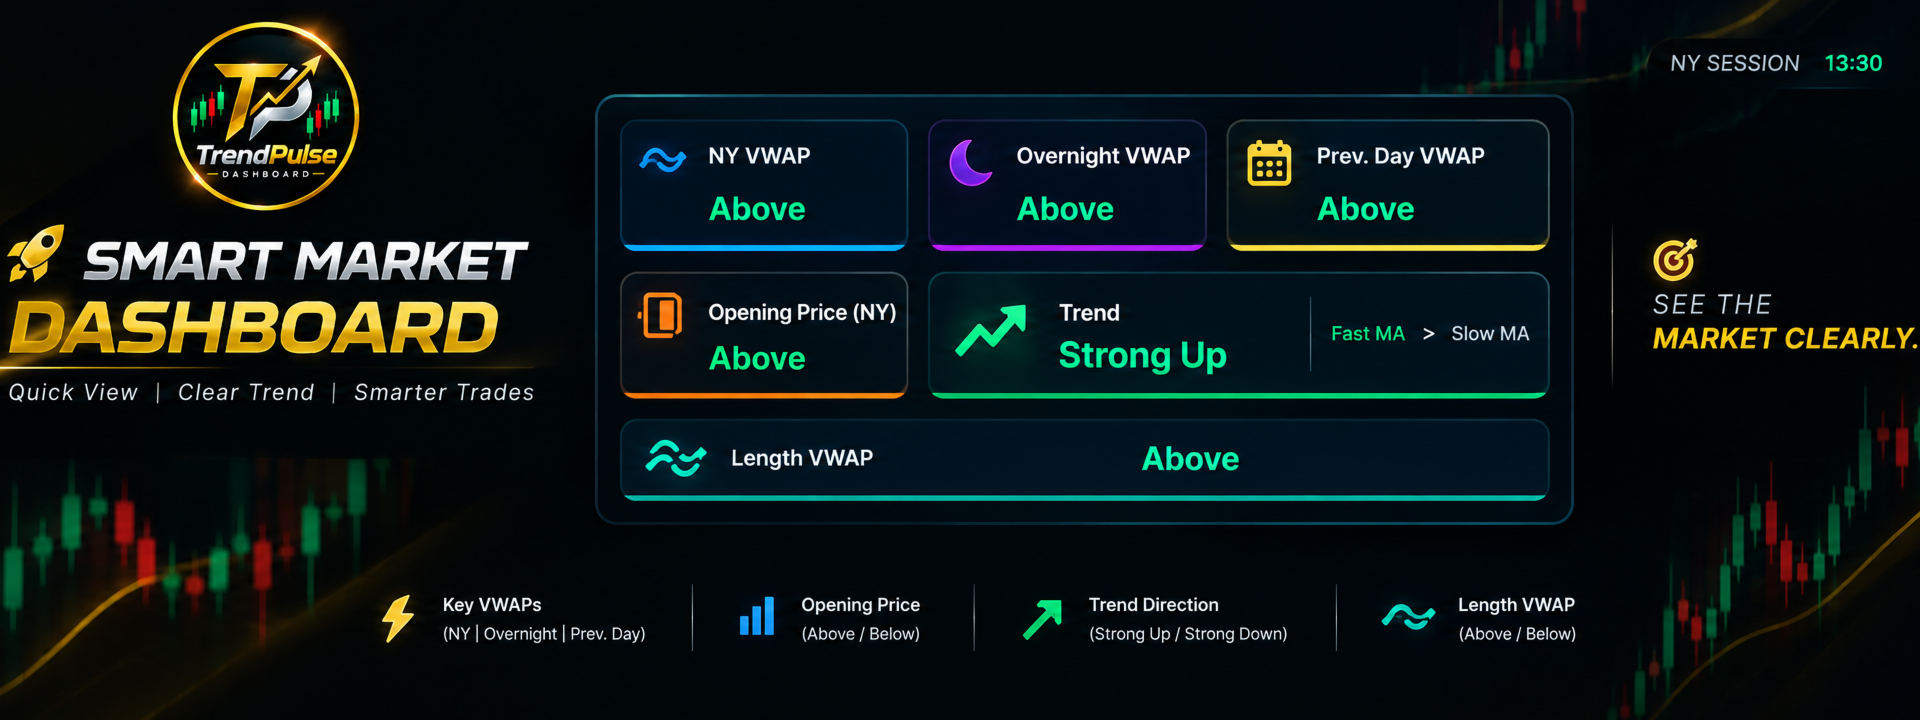
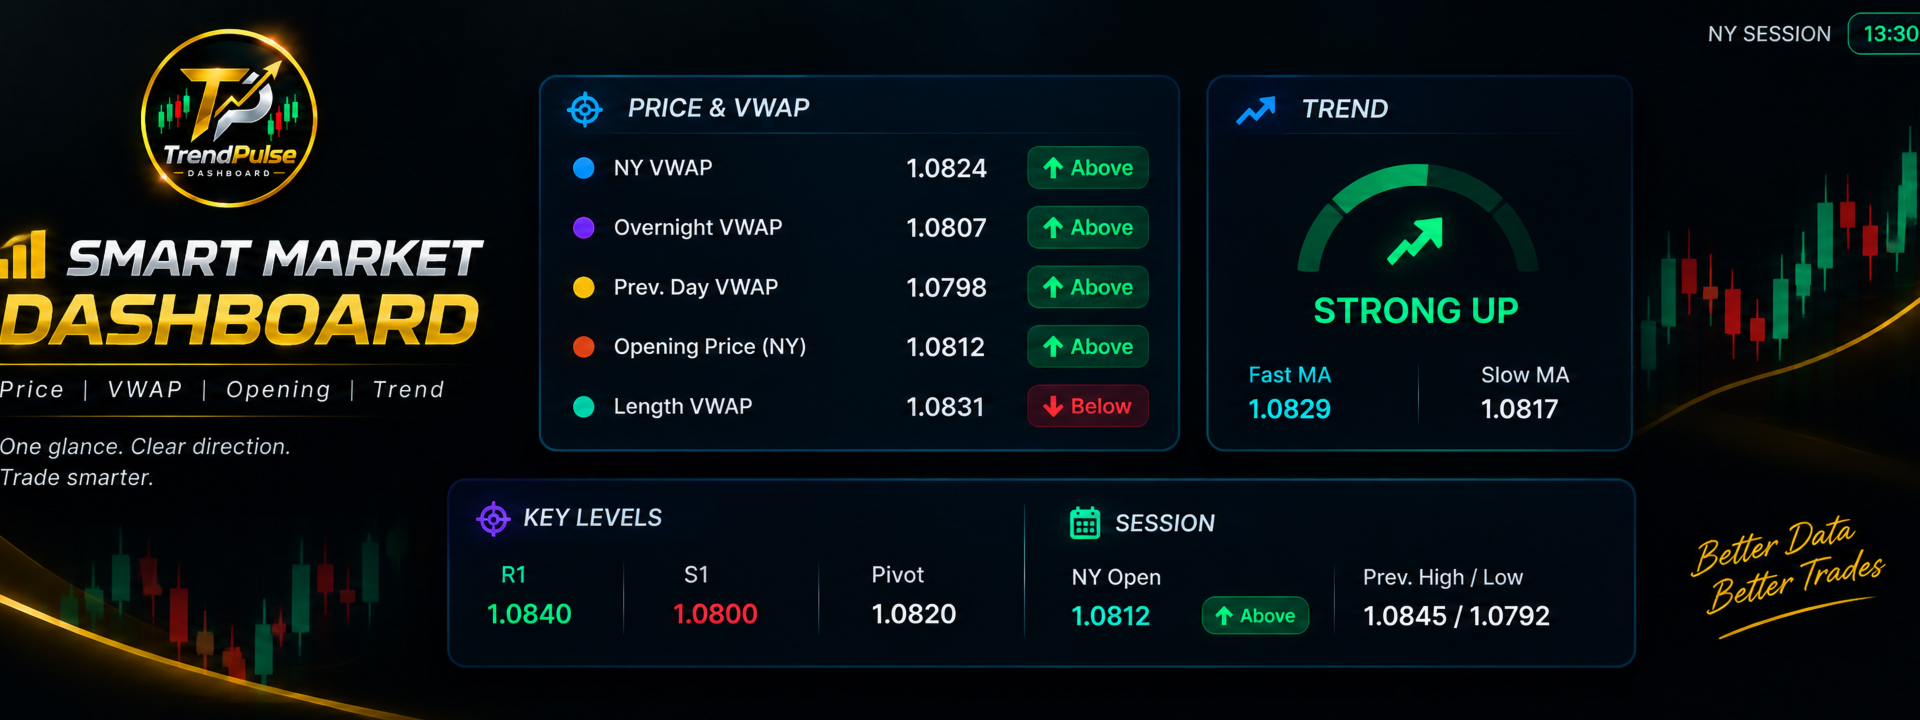
🚀 SMART MARKET DASHBOARD
📊 Everything You Need. One Clear View.
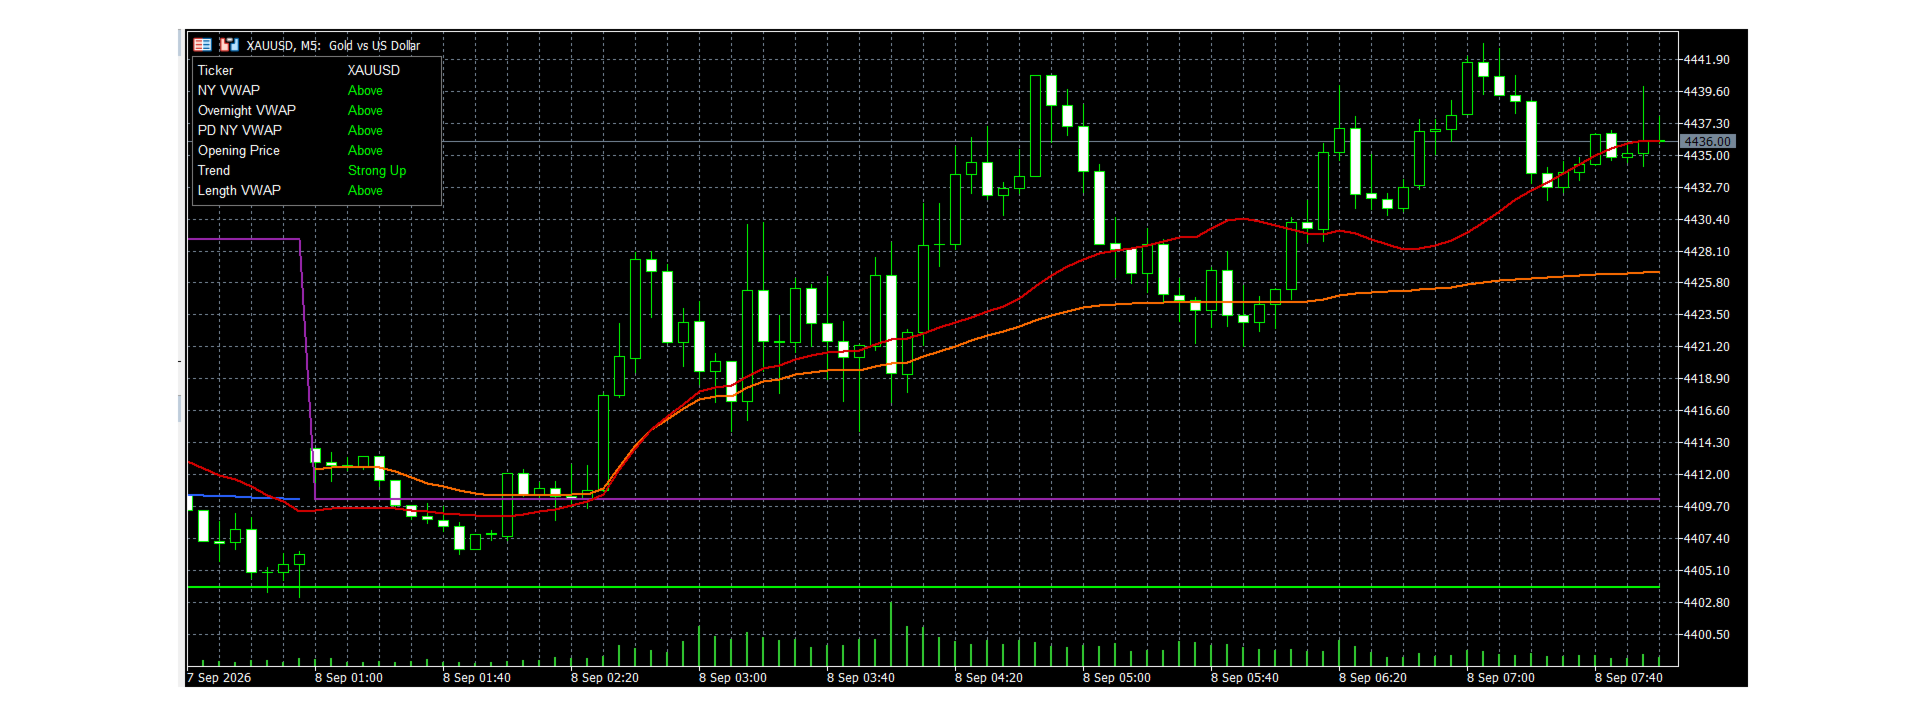
Make your market analysis faster, cleaner, and more organized with a dashboard that brings important price, VWAP, opening-price, and trend information together in one place.
Instead of checking multiple indicators separately, the dashboard gives you a quick market overview so you can understand where price is trading and what the current trend is.
🔥 WHAT YOU CAN SEE
📈 NY VWAP
See whether price is trading Above or Below the New York session VWAP.
🌙 Overnight VWAP
Understand where the current price stands relative to the overnight session's volume-weighted price.
📅 Previous Day VWAP
Use the previous New York session VWAP as an important reference level for current market positioning.
🎯 Opening Price
Track the New York session opening price and instantly see whether price is Above or Below it.
📊 Trend Direction
The dashboard combines price position with fast and slow trend averages to identify conditions such as Strong Up, Strong Down, Trend Up, or Trend Down.
⚡ Length VWAP
A rolling VWAP provides another reference for understanding the current price position.
🧠 HOW TO USE IT
-
Check the Trend first — identify whether the market is showing bullish or bearish conditions.
-
Check VWAP positioning — see whether price is above or below the key VWAP levels.
-
Check the Opening Price — use the session open as an additional directional reference.
-
Look for alignment — when multiple readings point in the same direction, the market structure is easier to interpret.
-
Make your trade decision based on your own strategy and risk management.
💡 WHY IT'S USEFUL
✅ All major readings in one dashboard
✅ Quick Above / Below market positioning
✅ Clear trend direction
✅ New York session-focused analysis
✅ Previous-day reference included
✅ Helps reduce unnecessary chart checking
✅ Simple visual layout for faster decision-making
🎯 TRADE SMART. SEE THE MARKET CLEARLY.
The goal is simple: less chart clutter, faster analysis, better market awareness.
Use the dashboard as your market-reading companion to quickly understand price positioning and trend before taking a trade.