 MetaTrader 5
 エキスパート
 インディケータ
 ライブラリ
 ユーティリティ
 ウィジェット
 ルール
YouTubeにあるマーケットチュートリアルビデオをご覧ください
ロボットや指標を購入する
仮想ホスティングで
EAを実行
EAを実行
ロボットや指標を購入前にテストする
マーケットで収入を得る
販売のためにプロダクトをプレゼンテーションする方法
MetaTrader 5のための無料のエキスパートアドバイザーとインディケータ - 85
 自動売買ロボットとインジケータを使用して、外国為替取引の収益性を高めます。 自動売買ロボットを使用すると、取引の開始と終了を自動化でき、インジケータは市場の行動をより正確に予測するのに役立ちます。
このページには、MetaTrader5アプリケーションのカタログが掲載されています。
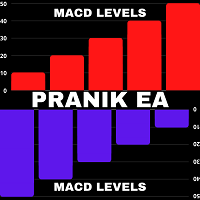
Easy to use EA designed to auto trade. Works in every market condition. It uses reliable levels of MACD indicator combined with unique logic to perform fully automatic trading operations. *For MT4 version please go here! *If you don't like automated system and only need an alert system to help you in trading. Please check this arrow with alert system here!
FEATURES: Dangerous methods like martingale, hedge, grid or scalping are NOT used. Each position has Stop Loss and Take Profit. Positional
FREE

Description (English): Trend Test by Subho – Advanced Trend & Step Channel System Trend Test by Subho is a powerful all-in-one trend trading system designed to filter noise and provide clear market direction. This indicator combines two sophisticated algorithms: the Trend Test () and the Subho Step Channel into a single chart overlay. It also features a stylish Live Dashboard that alerts you to the current trend status in real-time. Key Features: Trend Test () Logic: An advanced tr
FREE

这是一款专为手动交易者设计的MT5工具。解决了MT5回测只能跑EA自动交易无法手动回测的问题。它通过图形化按钮(Buy / Sell / Close All)让您在图表上快速开平仓,并 自动记录每一笔交易 ,实时计算 胜率、盈亏比、平均盈亏、最大回撤、当前权益 等专业数据,将您的交易行为转化为直观的绩效报告。它将是您不可或缺的辅助利器。
1. 一键交易,操作流畅 Buy / Sell / Close All 按钮 2. 实时交易记录与图表标记 自动绘制买卖箭头 :开仓时在K线图上生成绿色向上(买)或红色向下(卖)箭头,复盘时一目了然。 3. 专业绩效统计面板 完整交易明细 :总交易次数、盈利次数、亏损次数。 胜率 & 盈亏比 :自动计算胜率百分比、平均盈利、平均亏损、盈亏比。 资金管理指标 :总盈利、总亏损、净利润、当前权益、虚拟余额。 风险控制 :基于虚拟余额与浮动盈亏计算最大回撤(金额与百分比),帮助评估策略稳健性。
FREE

PROP VOLUME PROFILE
====================
Cumulative Volume Profile for MetaTrader 5
--------------------------------------------
Prop Volume Profile shows you where price has spent the most time and
volume over the selected period - directly on your chart, in a clean
vertical profile on the right edge.
One glance tells you the "fair value" zone, the strongest price level,
and whether the current price is stretched far above or below where
the market actually trades.
HIGHLIGHTS
----------
-
FREE

This bot uses two CCI indicators one slow and the other fast. Then there is a moving average to determine the trend (if price is above moving average then its an up trend ). If a signal is to be produced in the opposite direction of the current open trade then it closes and reverses the type of trade. An ATR indicator is used for better stop loss and take profit placement. There is a trailing stop function. This robot can be used in the H1 timeframe , other time frames should work though you wil
FREE

"Five Minute Drive" indicator that is designed to be used in the 5 minute timeframe only. One of its most important advantages is that it shows the general trend in the upper time frames when looking at the 5-minute timeframe. Therefore, when opening positions in the 5 minute timeframe, when it is in line with the trends in the upper timeframes, you are less likely to be upside down. If you can interpret the curvilinear and linear lines drawn by this indicator on the graphic screen with your geo
FREE

Fibonacci Bollinger Bands (FBB) Indicator - User Manual 1. Introduction Fibonacci Bollinger Bands (FBB) is a technical analysis indicator that combines three tools: Bollinger Bands , Fibonacci Ratios , and the Volume-Weighted Moving Average (VWMA) . The purpose of this indicator is to provide a multi-dimensional view of the market by helping to identify: Dynamic support and resistance zones. The general market trend. Volatility levels and potential accumulation phases (squeezes). Price breakouts
FREE
Hi Traders, The Volume Spike Alert Indicator is a lightweight, non-lagging tool designed to help traders identify unusual volume activity in real time. This indicator calculates the average tick volume over a user-defined number of previous bars and compares it with the current candle’s volume. When the current volume exceeds the average by a specified percentage, the indicator triggers alerts, allowing traders to quickly spot potential breakouts, institutional activity, or strong market interes
FREE

INTRODUCING MML Data Bridge The demand for bridging external data and machine learning with trading platforms is higher than ever. MetaTrader 5 is a powerful environment for trading and back testing, but without a data bridge, MT5 is largely isolated from using any external data. MML Bridge is a developer tool that allows users to bridge external data into MT5 for back testing, live trading, and optimization. It's built for ease of use, providing users with a simple function API that drip-feeds
FREE
> Elevate Your Trading Strategy This free tool is just the beginning. At code4trading , we specialize in developing high-performance indicators and Expert Advisors designed for precision and professional-grade analysis. Looking for more advanced features? Discover our full suite of premium tools, including optimized signals, advanced oscillators, and institutional-grade trading utilities at our official MQL5 store. > Explore the full catalog here: https://www.mql5.com/en/users/pablogx9
FREE

Core Positioning A lightweight risk calculation tool tailored exclusively for the MT5 platform, focusing on the core needs of traders' daily risk control calculations. It deeply optimizes the operation experience and data display effect, adapts to various chart viewing and trading scenarios such as intraday trading and swing trading, and is a highly practical auxiliary tool for traders' daily risk control operations. Core Functions Easy Lot Size Editing: Click the input box to enter values dire
FREE

Server Timer
Version: 1.2 The Server Time Clock Indicator is a lightweight and visually appealing tool for displaying the server's current date and time directly on the chart. This indicator updates dynamically every second and provides the following features: Customizable Appearance : Adjust font color, background color, and font size to match your chart's theme. Day and Time Display : Shows the current day, date, and time in an easy-to-read format ( Day{MM/DD} HH:MM:SS ). No Performance Over
FREE
MultiFrame MA: A Multi-Timeframe Trend Indicator MultiFrame MA is a trend analysis indicator designed to provide a comprehensive market overview across various timeframes. Instead of relying on a single timeframe, this tool synthesizes information from multiple charts, giving users a holistic and reliable perspective. KEY FEATURES: Multi-Timeframe Analysis: The indicator analyzes data from various timeframes, from M1 up to Monthly, to help users identify trend confluence at different levels. MA
FREE
MetaTrader 5 (MT5)用のUZFX - Delete Only Pending Ordersスクリプトは、取引口座からすべての未決注文(買い指値、売り指値、買い逆指値、売り逆指値)を自動的に削除するシンプルで効果的なツールです。このスクリプトは、有効な市場ポジションに影響を与えることなく、保留中の注文を即座に消去したいトレーダーに最適です。
私の他のMT4/MT5インジケーターとEAをチェックする >> こちら 特徴: すべての未決注文(買い指値、売り指値、買い逆指値、売り逆指値)を削除します。 未決済のマーケットポジションには影響しません。 Expertsタブを介してリアルタイムの執行フィードバックを提供します。 トレーダーが手動で操作することなく、未決注文のストラテジーを素早くリセットできます。 使用方法 MT5チャートにスクリプトを添付します。 スクリプトはすべての未決注文をスキャンし、自動的に削除します。 注: このスクリプトは有効な取引を決済するのではなく、未決注文を削除するだけです。 スクリプトを実行する前に、すべての未決注文を削除することを確認してくだ
FREE

>> Announcements Channel << DiverX is a powerful and versatile divergence indicator developed for the MetaTrader 5 platform. It detects both Regular and Hidden Divergences based on five popular technical indicators: RSI (Relative Strength Index) , RVI (Relative Vigor Index) , Stochastic Oscillator, CCI (Commodity Channel Index) , and MACD (Moving Average Convergence Divergence) and ATR Plus (author’s proprietary indicator, product page >> ) . The indicator plots results directly on the main c
FREE

This indicator displays volume delta (of either tick volume or real volume) encoded in a custom symbol, generated by special expert advisers, such as RenkoFromRealTicks . MetaTrader does not allow negative values in the volumes, this is why we need to encode deltas in a special way, and then use CustomVolumeDelta indicator to decode and display the deltas. This indicator is applicable only for custom instruments generated in appropriate way (with signed volumes encoded). It makes no sense to ap
FREE

This indicator will show a vertical representation of the volume distribution within a selected user range.
This is a free version of the full product. It is limited to use on a week old data or older. Find the full product at https://www.mql5.com/en/market/product/42234 .
Main features: This Indicator will create an image that will allow viewing the tick volume per price level in a graphical form. The indicator will work on any range size in any time-frame, limited only by your computer mem
FREE

TSD-47 RSI Matrix TSD47 RSI Matrix is a tactical multi-timeframe momentum dashboard designed to provide instant RSI and trend-strength awareness across multiple market structures. The indicator combines: 1 Minute RSI 5 Minute RSI 15 Minute RSI ADX Trend Strength Analysis inside a compact tactical dashboard interface built for modern traders. The goal of the dashboard is to simplify momentum analysis and help traders quickly identify: bullish pressure, bearish pressure, momentum alignment, and o
FREE

ORTHRUS EA - The Strategic Multi-Head Guardian Professional XAUUSD H1 Trading System for MetaTrader 5 SETFILES (USE THEM IF YOU WANT THE BOT TO WORK WELL):
LOW RISK: https://www.mediafire.com/file/j3isfycnt3fzzyv/LOW +RISK.set/file HIGHER RISK: https://www.mediafire.com/file/uir2zr6fwmknwm0/HIGHER +RISK.set/file INTELLIGENT TRADING, NOT GAMBLING ORTHRUS EA is not another high-frequency robot flooding the market with hundreds of trades. This is a precision-engineered trading system wher
FREE
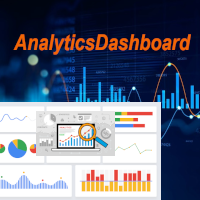
アナリティクスダッシュボードは、過去と現在の取引を分析し、詳細ビューとして円グラフを追加した分析ダッシュボードを作成するインジケーターです。
分析は主に4つのカテゴリーに分けられます。1)パフォーマンス指標、2)取引行動指標、3)約定品質指標、4)ポジションレベル指標です。
これら4つの一般的な分析指標は、さらに以下のように具体的な指標に分類されています。
パフォーマンス指標:
粗利益 粗損失 全体利益率 全体期待値 全体勝率 平均リスクリワードレシオ 最大ドローダウン 最大ランアップ これらすべてについて、円グラフを用いたチャート形式の指標表示も可能です。
取引行動指標:
総取引数 総勝ち数 総損失数 平均ホールド時間合計 平均取引サイズ SL到達により停止された取引総数 TP到達により停止された取引総数 手動ストップ注文合計 これらの指標は、平均取引サイズを除き、チャート形式でも表示されます。
約定品質指標:
平均スリッページ 平均エントリースプレッド 平均エグジットスプレッド 合計手数料 + スワップ手数料 粗利益への影響 粗損失への影響 これらの指標は、チャー
FREE

Climax Hunter Inspired by volume climax theory and liquidity behavior, Climax Hunter highlights potential turning points where the market is likely to begin price manipulation as well as the potential to reverse or pause manipulation. Key Features Helps identify manipulation zones of institutions and sharks Filters out false breakout signals and stop-hunt trades Detects Buying Climax (Market Top) Detects Selling Climax (Market Bottom) Works on all timeframes Operates on Forex, Gold, Indi
FREE
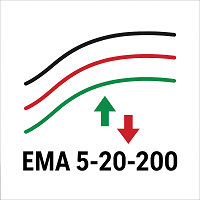
Description (English) EMA 5-20-200 Cross Alerts (Fixed Alerts, No Repaint) This indicator combines three popular EMAs (5, 20, and 200) to help traders identify short-term, mid-term, and long-term trends.
With visual arrows on the chart and automatic alerts (popup & push notification) , it allows traders to catch entries and trend confirmations without constantly monitoring the screen. Key Features: Plots EMA 5, EMA 20, and EMA 200 directly on the chart. Generates Buy/Sell signals (EMA5 vs
FREE

Indicador ROC (Rate of Change) para MT5 Descrição O indicador ROC (Rate of Change) é uma ferramenta essencial para análise de momentum no mercado. Ele mede a variação percentual do preço em relação a um período anterior, fornecendo insights valiosos sobre a força e velocidade dos movimentos de preço. Esta versão personalizada para MetaTrader 5 oferece recursos avançados de visualização e alerta, com múltiplas opções de personalização para atender às suas necessidades específicas de trading. Cara
FREE

Trading Cockpit is a free, complete trading control panel for MetaTrader 5: watchlists, price & trend alerts, and automatic liquidity levels, all in one compact side panel without leaving your chart. Try everything at no cost.
WATCHLISTS & SYMBOL BASKETS - Unlimited symbols across several lists in one dropdown selector: a live mirror of your Market Watch, a Favorites list, and your own custom lists. - Predefined baskets by correlation cluster - US, Europe, Forex, Metals, Energy, Crypto - that w
FREE

The SyntheticaFX Zones Indicator simplifies the process of identifying key levels in the market where price reversals are likely to occur. By incorporating this tool into their trading strategies, traders can improve their decision-making, enhance risk management, and ultimately increase their chances of success in the financial markets. However, like all technical indicators, it should be used in conjunction with other analysis methods and not relied upon as the sole basis for trading decisions
FREE

The Close All Charts utility is designed for quick and convenient closure of all open charts in the MetaTrader 5 (MT5) platform. It will be especially useful for traders who work with a large number of instruments and charts simultaneously, as well as for those who prefer to maintain order in their workspace. When testing advisors in the strategy tester with different parameters, a large number of charts often open. The Close All Charts utility is able to close them in just 1 second, which avoid
FREE

チャレンジを潰すのは利益目標ではなく一日の損失。過剰レバレッジの夜、忘れた指値、ギャップ。
PropFirm Shield Essential は最重要ルールを見張る無料ガード — 違反前に口座をロック。
どのチャートにも。全アカウント監視 — 全シンボル、マジック、手動、コピー、他EA。
- 日内損失ガード — 限度とリセット時間を設定。 - ロックダウン — 決済、指値削除、リセットまで新規禁止。 - バッファ — 限度前に作動。 - ウォッチドッグ — ティックなしでも監視。 - ステータス表示 — 净值、日次PnL、下限、リセット。 - 状態永続化。
なぜ無料? 完全な日内損失エンジン。削られたデモではない。
有料版 PropFirm Shield は追加:最大損失(静的+トレーリング)、プリセット、AUTO-SL、利益ロック、PANIC、最小日数、最悪ケース、パネル、プッシュ。
デモでテスト。ルール違反管理ツール、取引システムではない。
FREE

Price tells a story, but volume tells the truth. Volume Truth is a visual analysis tool that reads the relationship between price and volume to reveal what institutions are doing behind the move — accumulating, distributing, or stepping aside. It does not just plot volume bars; it interprets them. [b]The four price/volume states[/b] Price up + volume up = institutional accumulation (bullish conviction) Price up + volume down = weak rally, no conviction, prone to reverse Price down + volume up =
FREE
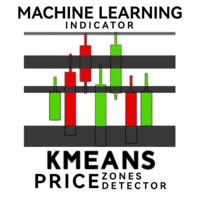
KMeans Price Zones Detector を使ったトレーディングの未来へようこそ。これは、機械学習の力を利用して主要な価格ゾーンを特定する革新的なMetaTrader指標です。このツールは、価格データ内の重心を動的に検出するためにKMeansクラスタリングアルゴリズムを利用し、価格がサポート、レジスタンス、または統合に遭遇しやすいエリアを強調します。 革新的なKMeansアルゴリズム KMeans Price Zones Detectorは、パターン認識においてその効率と精度で知られる機械学習の基本であるKMeansクラスタリングアルゴリズムを高度に活用することで際立っています。過去の価格データを分析することで、この指標は重要な価格レベルを表すクラスタまたは重心を識別します。これらの重心を使用してサポートとレジスタンスゾーンを計算し、トレーダーに価格の反転、ブレイクアウト、および統合の可能性に関する重要な情報を提供します。 主な特徴 動的ゾーン検出: 指標は最新の市場データに基づいて価格ゾーンを継続的に更新し、トレーダーが常に最も関連性の高い情報を持つことを保証します。
FREE

UZFX FTMO Guardian PROは、トレーダーがFTMOチャレンジを安全に完遂し、資金提供を受けた口座を自信を持って管理できるよう設計された、MetaTrader 5用のプロフェッショナルな口座監視インジケーターです。
エキスパートアドバイザーとは異なり、このツールは取引の執行、変更、決済を行いません。手動で取引を行っている間、口座を継続的に監視し、FTMOの重要なルールをすべて計算するリアルタイムの取引アシスタントとして機能します。
ダッシュボードには、残高、エクイティ、未確定損益、確定利益、日次利益、総利益、現在のドローダウン、残りの許容ドローダウン、利益目標の進捗状況、取引日数、およびチャレンジ全体の健全性ステータスなど、すべての重要な口座統計情報が一箇所に表示されます。
このインジケーターは、以下のFTMOチャレンジを自動的にサポートしています:
FTMO 2-Step Standard FTMO 2-Step Swing FTMO 1-Step Challenge また、以下の項目を継続的に計算します:
日次ドローダウン 最大ドローダウン スタティック・
FREE

PGSindicator for MetaTrader 5 Free Companion Indicator for Profit Guard System Trade Panel. *** The attached video is the " PGS Trade Panel Tutorial Part 1 " *** (4m video) Adjust >>> **** EMA1 N-Pips Separation from EMA2
This setting defines the minimum distance required between EMA1 and EMA2 before a trend condition is considered valid.
The default value is 100.0 pips for NASDAQ 100, 1 minute CHART . Depending on how your broker calculates pip values, you may adjust this to 20.0 or 10.0
FREE

The ONLY RSI Indicator You'll Ever Need - Works with ANY Broker, ANY Symbol! Finally, an RSI indicator that automatically adapts to YOUR broker's symbol naming conventions! Whether you trade Forex, Gold, Bitcoin, or Stock Indices - this universal indicator detects and monitors related symbols automatically. KEY FEATURES & BENEFITS UNIVERSAL COMPATIBILITY Auto-Detects Broker Patterns : Works with ANY broker suffix (.m, .pro, .raw, etc.) All Asset Classes : Forex, Metals (Gold/Silver), Crypto,
FREE

The ZigZag SMC/SMT Indicator for MT5 is the ideal tool for traders who want to accurately identify tops and bottoms based on the advanced concepts of Smart Money Concepts (SMC) and Smart Money Trap (SMT).
Main Benefits: Automatic identification of strategic tops and bottoms. Based on concepts used by institutional traders. Ideal for analyzing liquidity, market structure and manipulation. Simple to use: just add it to the chart and track the critical points.
️ Free Version: This ve
FREE
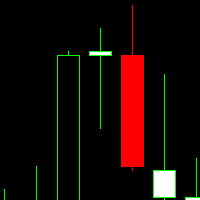
This indicator is a volume indicator it changes the color of the candles according to a certain number of ticks, and this number of ticks can be informed by the user both the number of ticks and the color of the candles, this indicator works in any graphical time or any asset, provided that the asset has a ticker number to be informed.
This indicator seeks to facilitate user viewing when analyzing candles with a certain number of ticks.
FREE

1秒が重要な場面での高速操作 このトレードパネルは、 秒足を含むカスタムチャート での使用を前提に設計されています。
カスタムチャートの背後にある 実際の取引シンボルを自動で正確に認識 し、
手動での紐付けや追加操作なしに 、そのシンボルへ直接取引を実行します。 このパネルが解決するのは、ただ一つの本質的な課題です。
「判断」と「実行」の間の距離を最小限にすること。 余分なウィンドウはありません。
確認ダイアログもありません。
画面を切り替える必要もありません。 素早いエントリー このパネルでは、主要なトレード操作を チャート上から直接 行えます。 Buy / Sell — ワンクリックでの成行エントリー LIMIT — ダイアログなしでの指値注文設定 ボタンを押せば、即座に実行されます。
メニューを探す必要もなく、チャートから意識を外すこともありません。 チャート上での SL / TP 設定 Stop Loss や Take Profit の設定は非常に直感的です。 ポジションのエントリーラインをクリックし、表示される補助ラインを目的の価格レベルまでドラッグするだけで設定できます。
FREE

GOM Trade Manager helps you execute trades the way you want it. Works on all instruments Forex, Commodities, & Crypto.
It helps you with lot calculations, spread addition and balance calculations so you can just focus on actual trading.
For full automatic planned management, stackable triggers and spread widening protection >> check out GOM Trade Manager Pro .
------------------------------------------NOTABLE FEATURES------------------------------------------ You set everything based on bid
FREE

This EA generates custom Line Break charts on a separate symbol using the following input settings: 1. LineBreak input int LineBreak = 3; Use: Defines the number of lines required for a reversal (e.g., 3-line break chart). Set to 1: For 1-line break charts (more responsive). Higher values: Create smoother, trend-following charts. 2. StartDate input datetime StartDate = D'2025.03.01';s Use: Specifies the date from which historical data should be loaded and processed. 3. LineBreakTime input bool L
FREE

TK - Rainbow インジケーター 説明: TK - Rainbow インジケーターは、複数のラインアプローチを通じて市場のトレンドを明確に表示するために設計された強力なテクニカル分析ツールです。異なる期間で計算された30本のラインを使用して、価格の動きの広範な分析を提供します。このインジケーターは、上昇トレンドと下降トレンドを際立たせるために二色スキームを使用しており、市場の状況を一目で簡単に解釈できます。 主な特徴: 30本のライン: 各ラインは異なる平滑化期間を表し、広範な市場トレンドをカバーします。 二色スキーム: 上昇トレンド(寒色)と下降トレンド(暖色)を区別するために二色を使用します。 カスタマイズ可能な設定: トレードの好みに合わせてラインの幅、スタイル、ステップサイズを調整できます。 TK - Rainbowの使い方: インジケーターの適用: TK - Rainbow インジケーターをMetaTrader 5のインジケーターリストからチャートに追加します。 パラメーターの設定: ステップ (inpStep): 各ライン間の期間の増分を定義します。これを調整してラ
FREE

The Moving Averages On-Off let you control the indicator using the keyboard or a button . You can choose if you want the indicator always shown or always hided while switching among different time frames or financial instruments . ---> This indicator is part of Combo Indicator OnOff
It's possible to setup three Moving Averages : Short , Medium , Long
Input You can customize the price type used for calculation : close, open, high, low, median price, typical price, weighted It's
FREE

Trading in global markets (such as Forex, Indices, and Commodities) demands maximum attention to time. However, MetaTrader 5 natively displays only your broker’s server time, forcing the trader to constantly make mental calculations to know the exact time on their own computer.
Pinpoint Local Time solves this problem elegantly and in an integrated way. It adds a secondary, ultra-compact time scale (ruler) at the bottom of your chart, which runs synchronously with market history, displaying the
FREE

Kalman Forecast Helper is an advanced MQL5 Expert Advisor component designed to generate adaptive market forecasts, trend predictions, and trading signals for FX and other financial time series. Powered by a proprietary Kalman filtering engine, the helper continuously analyzes incoming market data and delivers actionable forecast information that can be integrated directly into Expert Advisors, indicators, or quantitative trading systems. After each update, the helper provides: Multi-horizon for
FREE

the AK CAP toolbox free to use;
it includes the same indicators we use for our daily trading and we think the simpler the better. Lightweight indicator for use on all timeframes. that includes VWAP with vwap value indicator on top right. 3 EMA: FAST, MEDIUM, SLOW the candle timer to show how much time left in a candle.
colors and positions are fully customizable.
enjoy
FREE

。。。。。。。。。。。。。。。。。。。。。。。。。。。。。。。。。。。。。。。。。。。 This indicator is based on Bollinger Bands indicator. It helps user clearly know the Band is expand or contract.
The method of use is the same as the traditional Brin channel index. Users can use different color areas to distribute forest channel indicators in expansion or contraction stage. -------------------------------------------------------------------------------------------
FREE

Neural Levels Indicator – Precise AI-Based Market Levels Unlock next-level trading precision with the Neural Levels Indicator, a powerful market analysis tool built on advanced price-action principles and inspired by cutting-edge neural networks. Instantly identify three key neural trading levels directly on your chart:
Neural Level 1 Purpose: Crucial equilibrium level, ideal for identifying market balance points and potential turning zones.
Neural Level 2 (Optimal Entry) Purpose: Indicates p
FREE
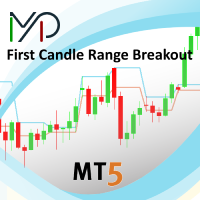
This creative simple indicator will provide a precise framework for market sentiment within technical analysis of different timeframes. For instance, for traders like me that uses "Mark Fisher" strategy regularly, this is a perfect indicator for having an insight to markets from short term to long term point of view, using Break points of candles' lows and highs and perfect to combine with "Price Action" . For more options and modifications you can also edit the low timeframe candles withi
FREE

Manual Trading Assistant is a professional EA designed for manual traders who want institutional-level trade management without losing control. This tool does NOT open trades automatically - you remain in full control of your entries. Once you open a position manually, the EA takes over with advanced features: automatic TP/SL placement based on ATR or fixed pips, dynamic trailing stop that adapts to volatility, break even protection to eliminate risk after initial profit , partial close
FREE

Coasyn FX Position Size Calculator Professional Forex Risk & Position Size Calculator for MetaTrader 5 Every professional trade begins with one question: How much should I risk? Coasyn FX Position Size Calculator provides a fast, accurate, and structured way to calculate position size before placing a trade. Designed for discretionary Forex traders, the panel converts your account size, risk percentage, entry price, and stop-loss distance into a precise position size in real time. Instead of rel
FREE

PipVenom - Advanced ATR Trailing Stop Signal Indicator for MT5 Professional Visual Trading System with Real-Time Dashboard OVERVIEW PipVenom is a sophisticated visual trading indicator designed for MT5 that combines ATR Trailing Stop methodology with EMA crossover signals to identify high-probability trade entries. Built with precision and clarity in mind, this indicator provides crystal-clear visual signals with automatic Stop Loss and Take Profit levels displayed directly on your chart. P
FREE

QuantumAlgo Basic Indicator — MetaTrader 5用 多機能マーケット情報インジケーター QuantumAlgo Basic Indicator は MetaTrader 5用のプロフェッショナル 多目的インジケーター 。リアルタイム マーケットデータと主要な機関レベルを備えた情報豊富なワークステーションに変換します。 QuantumAlgo Basic Indicator が選ばれる理由 クリーンなプロUI — Glassmorphism デザイン リアルタイム マーケット インテリジェンス ボラティリティ タイミング表示 日次機関レベル(PDH、PDL、Pivot、Open) セッション情報とアクティブ セッションのハイライト スプレッドとシンボル情報 純資産・残高・日次P/L 軽量 あらゆるシンボル・時間枠で動作 主要機能 Time Context ボラティリティ表示 機関レベル アカウント スナップショット カスタマイズ可能な表示 ライト/ダークテーマ 推奨設定 プラットフォーム: MetaTrader 5 シンボル: すべて 時間枠: すべて
FREE

English Description Title: Chart Cleaner (Eye Tool) Subtitle: Clean your charts instantly with 1 click while preserving your technical analysis. Inspired by TradingView's eye tool. Description: Have you ever wanted to look at clean price action without cluttering your chart with trendlines, support/resistance levels, and Fibonacci studies? Deleting and redrawing everything takes too much time. Chart Cleaner (Eye Tool) is designed to solve this exact problem. Featuring a minimalist design—a small
FREE
This indicator is a sophisticated MetaTrader 5 tool that calculates and displays Average Daily Range (ADR) levels on your chart. It draws horizontal lines representing expected price movement ranges based on historical daily volatility, helping traders identify potential daily high and low targets. ADR (Average Daily Range) = The average difference between the daily high and low over a specified period (default: 14 days). Unlike ATR which includes gaps between days, ADR focuses purely on int
FREE
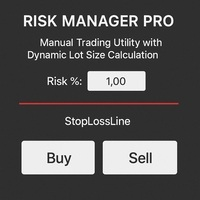
Risk Manager PRO – Manual Trading Utility with Dynamic Lot Size Calculation
Risk Manager PRO is a powerful yet simple utility for manual traders. It allows you to enter trades with calculated lot sizes based on your specified risk percentage and a visual stop-loss line. Just drag the red stop line to your desired level, input the risk %, and click Buy or Sell. Ideal for traders who want precise risk control without complex calculations.
Features:
Dynamic lot size calculation
Visual stop-lo
FREE

マルチタイムフレーム対応、カスタマイズ可能なビジュアルシグナル、設定可能なアラートシステムを備えたAverage Directional Movement Index(ADX)インジケーター。
フリーランスプログラミングサービス、アップデート、その他のTrueTL製品は私の MQL5プロフィール からご利用いただけます。
フィードバックとレビューを大歓迎します!
ADXとは? Average Directional Movement Index(ADX)は、J. Welles Wilderが開発した技術的指標で、方向性に関係なくトレンドの強さを測定するために使用されます。ADXはポジティブ方向指標(+DI)とネガティブ方向指標(-DI)から導出されますが、トレンドの方向ではなく強さのみを示します。 ADX値は0から100の範囲です。一般的に、20〜25未満の値は弱いまたは存在しないトレンド(レンジ相場)を示し、25を超える値は強いトレンドを示します。50を超える値は非常に強いトレンドを示します。ADXは市場がトレンド中かレンジ中かを識別するのに特に役立ち、トレーダーがトレンドフォ
FREE
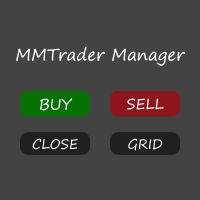
Welcome to my MMTrader Manager product. EA that allows You for simple managing trades and positions. Key Features: Position Opening – Open trades quickly with customizable Take Profit (TP), Stop Loss (SL), and lot size settings. Position Closing – Close trades with one click. Grid System – Automatically create a grid of orders. Recovery Mode – Loss recovery lot calculation. Trade History Data – Acces data to historical positions. User-Friendly Interface – A clear and simple panel designed. This
FREE

Indicador Multiple Regression Indicador faz o plot da Curva de Retorno e dos canais superior e inferior de uma regressão para os preços de fechamento do ativo do gráfico. A Curva de Retorno é a linha central do indicador e representa a região de equilíbrio do preço entre vendedores e compradores. Nesse indicador o usuário escolhe o tipo da regressão podendo ser de 3 tipos: primeiro grau, segundo grau ou terceiro grau. Os plots do indicador são: Linha central – cor padrão preta; Linha superi
FREE

IMPORTANT NOTE: This is a professional Trade Management Utility and on-chart assistant. It is NOT an automated trading robot. It does not open trades on its own. The UltraFast Trade Manager MT5 is the ultimate execution and risk-management suite designed to give you absolute control over your manual and algorithmic trades. When managing multiple positions, calculating complex net break-even points, or constantly monitoring the economic calendar, hesitation can lead to costly mistakes. This utili
FREE

MetaTrader 5 (MT5) 用の Wormhole 時間枠インジケーターは、ただの取引ツールではありません。それは、金融市場での競争優位性です。初心者とプロのトレーダーの両方を念頭に設計された Wormhole は、データの分析方法と意思決定を変革し、常に一歩先を行くことを保証します。 なぜ Wormhole インジケーター(無料)が必要なのか 競争に勝つ: 同じチャート上で 2 つの時間枠を同時に表示できるということは、常に一歩先を行けることを意味します。チャートを切り替える必要はなく、必要な情報はすべて目の前にあります。 隠れたチャンスを発見する: 従来の時間枠を変更し、他のトレーダーが見逃すパターンを発見します。5 分間のチャートの範囲を 00:01 から 00:06 に変更して、標準の 00:00 から 00:05 の代わりに分析することができます。これらの微細な変更は、市場の独特なダイナミクスを明らかにする可能性があります。 実行可能な洞察を得る: トレンド、反転、サポート/レジスタンスレベルを検出するための精密なツールを使用することで、Wormhole は自信を持
FREE

Check a pending stop order before you send it. A pending order can be refused for reasons the terminal can already show you: the price is not on the broker price grid, the volume is not a valid step, or the entry sits closer to the market than the symbol stops level allows. Pending Order Inspector MT5 reads those contract values and shows how your intended order compares with them, on the chart, before you place it yourself. Enter the price, volume, optional Stop Loss and optional Take Profit yo
FREE

Heat MA Description - English Heat MA Indicator: A Simplified Guide for Traders The Heat MA indicator is a powerful visual tool designed to identify the intensity of trading flow and market pressure directly on your chart. It appears as a continuous line that changes color, offering clear signals about price behavior and underlying volume. 1. How Heat MA Appears on the Chart Imagine a single, robust line (4 pixels thick) that moves along with the price. This line is not just a trace; it's a mark
FREE

The Support n Resistance V2 is an advanced technical indicator that automatically calculates and plots highly accurate S/R channels based on Pivot Points . Upgraded with ATR volatility filtering and Smart Classification, this tool not only finds key levels but also analyzes historical price action and tick volume to validate the strength of each zone . Key Features Smart Classification: Automatically analyzes historical wick rejections and price touches to classify levels strictly as Support (S
FREE

GomerAI REGIME – 市場環境分類 価格 : $0 プラットフォーム : MetaTrader 5 タイプ : 市場環境インジケーター(非自動売買) 概要 このインジケーターは、 GomerAI Market Research Framework の一部であり、市場構造と取引環境を分析するために設計された分析ツール群に属しています。 各インジケーターは市場行動の特定の側面に焦点を当て、トレーダーや自動売買システムが現在の市場状況をより深く理解できるよう支援します。 GomerAI REGIME は、トレンドの強さ、ボラティリティ、レンジ行動という三つの要素を通じて現在の市場環境を評価します。このインジケーターは売買シグナルを生成したり取引を実行したりするものではなく、これら三つの要素がどのように相互作用しているかを分析し、現在の市場が静かな状態、トレンド状態、または極端な状態のどれにあるのかを判断します。 その目的は、トレーダーやエキスパートアドバイザーが戦略ロジックを適用する前に、自分たちがどの種類の市場環境で動いているのかを理解できるようにすることにあります。静かな状態
FREE

TimeBar TimeBar は、バーが閉じるまでの残り時間、バーが開いてからの経過時間と現在時刻を表示するシンプルな情報インジケーターです。 見やすくするために、グラフの左上隅にコメントの形で表示する方法と、グラフィック オブジェクトの形で表示する 2 種類の表示モードが追加されました。
利点 フォントの選択 フォントサイズ。 どれでも設定できます。 コメントすると小さすぎるので オブジェクトを移動できます。 マウスをダブルクリックして任意の時間を選択し、チャート上の任意の場所に移動すると、通常どおり更新され続けます 視覚的な警告。 現在のバーが閉じるまでの指定秒数を設定でき、その秒数に達すると、設定で指定した警告色に変わります 設定 表示する時間を選択します 各時刻の色 (グラフィック オブジェクトの場合) バーがまもなく閉店することを通知するアラート 取引システムへの追加として TimeBar インジケーターを使用する
市場にある他の製品もお試しください https://www.mql5.com/ru/users/capitalplus/seller
FREE

History by Magic Number MT5 is a utility that filters trading history based on a selected Magic Number . It’s especially useful on accounts where multiple EA strategies run simultaneously and you need to isolate the performance of a single strategy . This tool is a non‑trading analytical Expert Advisor for MetaTrader 5, designed to provide precise evaluation of trading performance associated with a specific Magic Number within a user‑defined time range . It does not interfere with live trading,
FREE

Mentoria Individual — Manual Trade Execution and Risk Management Mentoria Individual is a free manual trade execution and risk management tool for MetaTrader 5, developed by Gean Patrick. It combines lot size calculation, order preparation, visual Stop Loss and Take Profit adjustment, and position management in an interactive panel directly on the chart. The tool is designed for traders who want to maintain full control over their trading decisions. It does not provide trading signals or execut
FREE

Arixis Backtest Inspector — Go Beyond the Final Profit
Arixis Backtest Inspector is a professional MetaTrader 5 analysis tool designed to help traders understand the real structure behind historical trading results. Instead of focusing only on net profit, win rate or profit factor, it examines how results are distributed over time and how dependent a strategy may be on a small number of exceptional trades or trading days. The tool analyzes trade performance, winning and losing streaks, closed-e
FREE

**MTF Confluence Dashboard** is a free, self-contained indicator: a compact on-chart panel that classifies trend direction (Bullish / Bearish / Neutral) across up to six timeframes (M15, M30, H1, H4, D1, W1) and shows a one-line bias summary.
Trend per timeframe is based on a fast/slow EMA relationship, confirmed by price position relative to the fast EMA (not a raw EMA cross) to cut down on whipsaw:
- **Bullish** — fast EMA above slow EMA, and price above the fast EMA - **Bearish** — fast E
FREE

AMSV Zones - Adaptive Market Structure + Volatility Zones
Stop trading blind support/resistance levels. Start trading zones that adapt to real market conditions.
AMSV Zones combines multi-timeframe market structure analysis with volatility-adaptive zones to identify high-probability trading opportunities. Unlike traditional indicators using fixed levels, AMSV automatically adjusts zone widths based on current ATR, ensuring relevance during both calm and volatile periods.
KEY FEATURES
1. Mu
FREE

Expert using Moving Average (Configurable), RSI entry points and Bollinger Bands (not configurable [yet]).
You can decide if you want to use the Moving Average with or without Bollinger Bands and you can turn on/off the RSI also for entry/exit points.
You can also turn on/off the Double Hand Feature where every entry/exit the trade will be in double, which means, selling and buying at the same time.
FREE
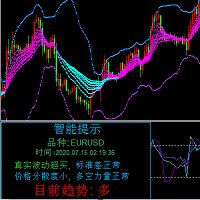
这是一个组合指标分析趋势、支撑阻力、买卖点。运用了均线MA、布林带、KDJ、CCI、RSI。 主图上下线是布林带上下线,采用的是20周期和2.3标准差可以用来支撑阻力。 中间的是分析趋势的均线,趋势分析是用均线多周期: 为涨趋势,反之为下跌趋势。在同一种颜色,基本说明趋势没有发生变化。 子图是由 KDJ、CCI、RSI三个指标组成,大于70超买,小于30超卖, 智能提示是运用了算法,主要计算布林带, KDJ、CCI、RSI指标
有三个或四个指标超出市场常态就会发出提示行情可能反转。 子图指标运用了很多数据,刚刚开始加载会有点慢,耐心等待就可以 这个指标是主图指标,还要再下我发布的RCD分析,这样就刚刚好组成一套分析 电脑分辨率的文本大小请设置100%,不然字体会不一样
FREE

This is a utility panel to assist closing of open Deals. The panel has input filters to assist one select the right trades. The tool displays the number of trades to be closed as well as profits to be realized. One click close, Filter trades to be closed by: symbol, (Filter by a particular symbol in the trade terminal). magic number (If your orders are from particular EA with unique magic numbers). whether in profit, loss or All. (P/L=all trades, profiting = trades in profit, loosing = trades
FREE
MetaTraderマーケットは、開発者がトレーディングアプリを販売するシンプルで便利なサイトです。
プロダクトを投稿するのをお手伝いし、マーケットのためにプロダクト記載を準備する方法を説明します。マーケットのすべてのアプリは暗号化によって守られ、購入者のコンピュータでしか動作しません。違法なコピーは不可能です。

取引の機会を逃しています。
- 無料取引アプリ
- 8千を超えるシグナルをコピー
- 金融ニュースで金融マーケットを探索