 MetaTrader 5
 エキスパート
 インディケータ
 ライブラリ
 ユーティリティ
 ウィジェット
 ルール
YouTubeにあるマーケットチュートリアルビデオをご覧ください
ロボットや指標を購入する
仮想ホスティングで
EAを実行
EAを実行
ロボットや指標を購入前にテストする
マーケットで収入を得る
販売のためにプロダクトをプレゼンテーションする方法
MetaTrader 5のための無料のエキスパートアドバイザーとインディケータ - 120
 自動売買ロボットとインジケータを使用して、外国為替取引の収益性を高めます。 自動売買ロボットを使用すると、取引の開始と終了を自動化でき、インジケータは市場の行動をより正確に予測するのに役立ちます。
このページには、MetaTrader5アプリケーションのカタログが掲載されています。

Indicador Volume Range Spread O Volume Range Spread é um indicador desenvolvido para analisar a força do mercado por meio da combinação entre volume negociado , amplitude do movimento de preço e spread . Seu objetivo é ajudar o trader a identificar regiões onde há maior participação dos participantes do mercado, possíveis absorções, desequilíbrios, rompimentos e pontos de exaustão. O indicador observa a relação entre o volume acumulado em determinado intervalo de preço ou tempo e o tamanho do ra
FREE
Background
This product is a practical tool to check the market based on the cycle theory . When you need to use multi cycle charts to analyze a symbol , manually adding charts with different cycles and applying templates is a very large cost. This product can help you quickly add multi cycle charts of one or more symbols, and uniformly apply the same template . After adding, you can drag the charts to the sub screen, which is suitable for multi screen analysis. Usage Method Apply this script to
FREE

AlphaQuant Execution & Risk Dashboard Version Update 5.46
Stop Guessing. Start Auditing. The Ultimate Institutional-Grade Execution & Prop Firm Risk Overlay. "Backtested is a fantasy. Filled is the truth." Most traders lose their proprietary firm accounts not because of a flawed strategy, but because of hidden execution costs, silent spread widening, and unnoticed rule breaches. The AlphaQuant Execution & Risk Dashboard is a comprehensive, chart-filling telemetry and risk management system des
FREE

Indicator Name: DualClockWithSignalTime.mq5 Description: The DualClockWithSignalTime is a custom MetaTrader 5 (MT5) indicator designed to display three pieces of real-time information directly on the chart: Broker Server Time Local Computer Time Last Signal Time (BUY/SELL) This indicator is helpful for traders who need to monitor both the broker's time and their own local time, ensuring better synchronization of trading actions. Additionally, it automatically detects and displays the latest BUY
FREE

AIX Notifier — Telegram and Discord alerts for AIX Analyst
AIX Notifier is a free companion utility for the AIX Analyst indicator. MetaTrader 5 indicators cannot access the internet by themselves, so AIX Notifier does it for them: it delivers AIX Analyst alerts, reports and the morning overview to Telegram and Discord, with a screenshot of the chart. It does not open, modify or close trades.
What it does • Sends AIX Analyst alerts to Telegram and Discord: price in a scenario zone, objective r
FREE

[TH] คำบรรยายสินค้า: The Horse Pro Signal (WinWiFi Robot Series) The Horse Pro Signal คืออินดิเคเตอร์ระดับมืออาชีพรุ่นล่าสุดจากตระกูล WinWiFi Robot Series ออกแบบมาสำหรับแพลตฟอร์ม MetaTrader 5 (MT5) โดยเฉพาะ เพื่อช่วยเทรดเดอร์ในการวิเคราะห์พฤติกรรมราคา (Price Action) ทั้งในสภาวะตลาดที่มีเทรนด์ชัดเจนและช่วงตลาดไซด์เวย์ (Sideways) คุณสมบัติเด่น: การวิเคราะห์แท่งเทียนอัจฉริยะ: ระบบอ้างอิงการเคลื่อนที่ของราคาตามเทรนด์และสลับกับการกรองสัญญานในช่วงไซด์เวย์ เพื่อความแม่นยำสูงสุด การแสดงผลที่ชัดเจน: มาพ
FREE

this is a Demo version of product. its limit of 3 trade at a time. when you buy full version try to click here https://www.mql5.com/en/market/product/170629
The Core Philosophy: Ultra-Fast Execution In the world of scalping, milliseconds matter. This configuration utilizes a Fixed Lot Size strategy combined with lightning-fast keyboard triggers to ensure you never miss a price level. CandleWise Trade Logic This feature restricts trade frequency to prevent "over-trading" during volatile
FREE

Main Features Calculates average values over a defined number of candles: Average volume Average close price Average candle range Average bullish and bearish candle size Displays current and previous candle statistics (Open, Close, Range, Volume). Provides an instant market summary without opening additional indicator windows. Works on any symbol and any timeframe . ️ Inputs BarsToCheck – number of candles to analyze. TextColor – color of the displayed text. FontSize – text size. (Demo only) D
FREE

OrderFlow WMA v2.0 – Flow-Weighted Trend Indicator OrderFlow WMA v2.0 is a next-generation flow-weighted moving average designed to go beyond traditional EMA/WMA logic by integrating volume pressure, candle intent, and momentum acceleration into a single adaptive trend line. Unlike standard moving averages that treat every candle equally, OrderFlow WMA dynamically adjusts its weighting using: Tick-volume normalization Candle body dominance (directional intent) Momentum slope and acceleration Thi
FREE

Description The Institutional Cycle Filter (ICF) is a sophisticated trend-following tool that replaces standard moving averages with a "Signal Dot" system. It is designed to minimize lag while maintaining smoothness, making it highly effective for identifying trend reversals in volatile markets like Gold. How It Works (The Logic) Cosine Weighting: Unlike a Simple Moving Average (SMA) or Exponential Moving Average (EMA), this algorithm uses a Cosine function to calculate weights. This allows the
FREE

Market Regime Observer is a professional market state classification tool designed to help traders identify: Strong Trend Range Transition Chaos / High Volatility The system combines: ADX trend strength EMA50 / EMA100 expansion EMA200 macro bias ATR volatility expansion Wick / Body structure analysis to generate real-time regime analysis and probability-based market assessment. Perfect for: Trend-following traders ICT / Smart Money traders EA developers Quantitative systems Risk management frame
FREE

Day Close Hunter なぜこれが重要なのか すべてのトレーダーがこの状況を知っています。金曜日の夜、市場がまもなく閉まろうとしており、週末前にポジションを閉じるのを忘れてしまいました。月曜日、市場はギャップで始まり、避けられたはずの損失をあなたの預金が被ることになります。 多くの自動売買システムには金曜日のクローズ機能が組み込まれていません。週末中ずっとポジションを保持し続け、市場のギャップに対して無防備な状態にさせます。 Day Close Hunter はこの問題を一発で解決します。クローズする時間と曜日を設定するだけで、たとえあなたが忘れてもエキスパートアドバイザーがポジションを管理します。 目的 Day Close Hunter は MetaTrader 5 向けの汎用エキスパートアドバイザーで、指定された曜日と時間にすべてのポジションと保留注文を自動的にクローズします。週末のギャップから保護するだけでなく、毎日の市場終了前の口座整理にも最適です。 主な機能 選択可能な曜日 — チェックボックスによる柔軟な設定。任意の曜日にポジションをクローズできます。金曜日の
FREE

大口トレーダーがあなたに見せたくない秘密を発見しましょう。 市場の**「クジラ(大口投資家)」 が常に同じ時間、同じ方向で参入しているのか、疑問に思ったことはありませんか?このインジケーターがそれを示します。エントリーシグナルは提供しませんが、通常見過ごされがちな 時間別または日別の歴史的な値動きのパターン**を明らかにします。 たとえば、 木曜日の15:00 に EURUSD が 80%の確率で上昇 する可能性があることを発見できるかもしれません。時間帯の バイアスを確認したい トレーダーや、自身の戦略のために 高確率な時間帯を特定したい トレーダーに理想的です。 これを使えば、一目で以下の情報が視覚化されます。上昇/下降ローソク足の割合、優勢な方向性、平均的な値動き。これにより、 機関投資家が歴史的にどのように行動してきたか を理解し、分析を素早く簡単に補完できます。 注:M30(30分足) データは1時間単位で統合されます。各時間は、それを構成する2本の30分足のローソク足の挙動を示します。 注:貴金属、株式、指数について 一部の資産では、市場やブローカーが必ずしも 00:00
FREE

Fx Trade Monitor – Professional Strategy Tracker & Risk Manager A powerful, free utility to monitor open/closed trades, visualize history, and manage risk with advanced Drawdown Alerts. Includes Excel-ready CSV export. Fx Trade Monitor is an essential dashboard tool designed for both manual traders and EA users. It provides a crystal-clear overview of your trading performance directly on the chart, filtering by Magic Number or Comment. Unlike simple info panels, this tool focuses heavily on Ri
FREE

SPREAD TRAFFIC LIGHT — FREE ADAPTIVE SPREAD MONITOR FOR MT5
Turn raw spread data into a clear green, amber or red status before a manual entry.
MAIN FEATURES • Current spread in points • Rolling average and maximum spread • Current-to-average spread ratio • Adaptive green, amber and red classification • Configurable sample window and calibration samples • Optional absolute maximum-spread filter • Optional alert when status changes to red • Compact configurable panel for any MT5 symbol and time
FREE

MT5 Tick History Sync – Real Tick Downloader, History Verification & Data Export Download. Synchronize. Verify. Export. Make Every Backtest Count. Are you confident that your MetaTrader 5 backtests are using complete real tick history? Missing historical ticks can compromise the reliability of your backtesting results, especially when testing scalping strategies, high-frequency trading systems, and Expert Advisors that depend on precise price movements. MT5 Tick History Sync by Zistilo is a prof
FREE
Simple alternate MACD version like the one used in tradingview. Two lines (MACD & signal line) and a histogram. This MACD version can be used in many different ways. Potential trades are the crossing of the MACD & signal line, the crossing of the MACD through the 0-line of the histogram, the MACD being under the 0-line of the histogram or the movement of the histogram itself. A combination of these potential signals on different timeframes can be very precise, but always needs additional confirm
FREE

UEX Reader - エキスパートアドバイザー UEXインジケーターに基づいて動作する完全自動売買EAです。 https://www.mql5.com/ja/market/product/152936
UEX Readerは、2つの柔軟な取引手法オプション(通常取引と平均化取引)を提供します。
取引ポジションは、UEXインジケーターによって特定された市場の方向性に応じて、個別または同時に執行できます。
UEX Readerはインジケーターと連携して動作しますが、MT5テスターでテストできます。
- - -
UEX Readerエキスパートアドバイザーの使用手順: https://www.mql5.com/ja/market/product/166805/comments PDF document :
https://c.mql5.com/31/1830/UEX_Reader_ExpertAdvisor.zip
FREE
CloseAllChartsExceptCurrent — MetaTrader 5 智能スクリプト 説明:
MT5ターミナルで多数のチャートを手動で閉じるのに疲れてませんか? CloseAllChartsExceptCurrent が代わりにやってくれます!このスクリプトは、起動したチャート以外を即時閉じます。秩序とスピードを重視するトレーダーに最適です。 主な特徴:
ルーティンの自動化 — 不要なチャートをワンクリックで閉じます。
時間節約 — タブ切り替えが不要に。
集中力維持 — 必要なチャートだけを残します。 インストール方法: スクリプトファイル CloseAllChartsExceptCurrent.mq5 をコピーします。 フォルダに貼り付けます:
MetaTrader 5ターミナルの MQL5/Scripts 内。 ターミナルを再起動(またはツールバーからスクリプトリストを更新)。 使い方: MT5で任意のチャートを開きます。 ナビゲーターからスクリプトをドラッグアンドドロップ。 他のすべてのチャートが即時閉じられます。 注意:
FREE

Repaint Inspectorは、インジケーターがリペイントするかどうかを、謳い文句を信用するのではなく実際に測定します。チャートに適用し、任意のカスタムインジケーターとそのパラメーターリストを指定すると、既に確定したバーについてそのインジケーターのバッファを繰り返し読み直し、動いた値、現れた値、消えた値をすべて数えます。あわせて、それが履歴のどこまで遡ったバーでなお起きているかも記録します。 これは測定ツールです。チャート上では一切注文を送信しません。ストラテジーテスターでは、開始時に最小ロットのポジションを一つ建てて決済します。MQL5 Marketの自動テストが、エキスパートアドバイザが取引操作を行うことを確認するためです。この取引はその旨が操作ログに出力され、測定には含まれず、入力パラメーターで無効にできます。DLLもネットワークアクセスも使用せず、MQL5\Filesに書き出す二つのCSVファイル以外はディスクに何も書き込みません。 このツールが必要な理由:「リペイントしない」はインジケーターの説明によくある主張ですが、確かめるのは困難です。よくある確認方法は、チャートを
FREE

Stop Guardian の紹介:トレーリングストップと利益確定でリスク管理を向上。 Stop Guardian は、トレーリングストップと利益に基づく自動ポジションクローズシステムを組み合わせ、あなたの取引戦略におけるリスク管理を最適化するために設計されたエキスパートアドバイザー (EA) です。 主な機能
自動リスク管理 :トレーリングストップを使用して、オープンポジションを自動的に調整し、利益を保護し損失を最小限に抑えます。
カスタマイズ可能な設定 :トレーリングストップのパラメーター (Trailing Start と Trailing Step) を戦略に応じて調整することができます。
自動ポジションクローズ :*Profit To Close All Positions* というパラメーターにより、アカウントの総利益が指定された値に達したときに、EAがすべてのオープンポジションを自動的にクローズします。この機能により、利益が確実に保護されます。
取引の識別 :特定のトレードのみを管理し、調整するためにマジックナンバー (Magic) を使用します。
カスタマイ
FREE

Trading Stats Panel Your Trading Performance. At a Glance. Trading Stats Panel is a professional MetaTrader 5 indicator designed to give traders a clear and convenient overview of their recent trading activity directly on the chart. Instead of constantly opening the MT5 History tab and manually calculating your results, the panel presents key trading statistics in one easy-to-read dashboard. What Does Trading Stats Panel Show? The dashboard provides important performance information including
FREE

ZeroG CyberClock Pro is not just another standard MetaTrader clock—it is a premium, beautifully crafted, cyberpunk-style desktop utility designed for the modern algorithmic and manual trader. Tired of basic, ugly text overlapping your charts? CyberClock Pro introduces a sleek, draggable Neon HUD that seamlessly blends into your trading environment without cluttering your analysis. Stay perfectly synchronized with the world’s major financial hubs thanks to its real-time Smart Session Engine.
FREE

Hello, trading champs! I trust you are doing well. Have you experienced entering a position where the market initially moves in your favour or approach your takeprofit then suddenly the market reversed opposite your position? Well, it has happened to me numerous times and today I decide to fight back.
I present to you a trade manager that help you protect your position(s). This project helps you set your position(s) to breakeven either when a certain amount of pips you specify is reached or a
FREE

NHS Prop Firm Guardian NHS Prop Firm Guardian is a dedicated, single-panel risk monitor and drawdown protection overlay for MetaTrader 5, built around one core idea: watch the account relentlessly, and enforce the limit the moment it's crossed — even if the trader isn't looking . It is a pure risk-monitor companion tool, not an order-entry or trade-management system: it does not place trades, manage stops, or run automation strategies. Its job is tracking Daily drawdown on the current chart symb
FREE
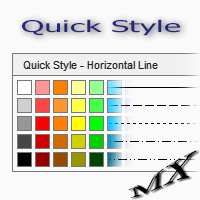
The Quick Style utility is designed for facilitation and acceleration of working with the properties of graphical objects. Left-click a graphical object while holding the Shift key to open the quick access window for configuring the object properties. In the window, you can change the color, style and line width with one click, including those of other graphical objects. All changes are displayed immediately. To close the Quick Style , simply click the free space on the chart. The utility is eas
FREE

Trade Manager Panel is a free on-chart utility that helps you manage open positions quickly with a set of one-click buttons. It does not open trades on its own and generates no trading signals - it is a pure manual-trading assistant that works on any account with no restrictions.
Features: - Close All: close every open position at once. - Close Profit: close only the positions currently in profit. - Close Loss: close only the positions currently in loss. - Partial Close: close a configurable p
FREE

Why You Need VLine Alarm
Stop Missing Trade Setups.
News events, session opens, key timeframes - they all happen whether you're watching or not. VLine Alarm keeps you on point.
Set It Once. Forget It.
Drag a line. Walk away. Get alerted. No babysitting charts. No missing opportunities because you switched timeframes or stepped away.
The Problem It Solves:
You know that moment when you realize the news already hit 5 minutes ago? Or you miss the London open because you were analyzing the daily cha
FREE

Neural Levels Indicator – Precise AI-Based Market Levels Unlock next-level trading precision with the Neural Levels Indicator, a powerful market analysis tool built on advanced price-action principles and inspired by cutting-edge neural networks. Instantly identify three key neural trading levels directly on your chart:
Neural Level 1 Purpose: Crucial equilibrium level, ideal for identifying market balance points and potential turning zones.
Neural Level 2 (Optimal Entry) Purpose: Indicates p
FREE

PHOENIX MEASURED BOX DASHBOARD, engineered specifically for Phoenix Au Trading to provide "No dreams, just the tools" for high-precision institutional-style trading. 1. THE INDICATOR DEFINITION The Phoenix Measured Box is a multi-dimensional analysis tool designed for SMC (Smart Money Concepts) and ICT-style traders. It combines time-segmented price action with real-time volume metrics and automated target projections. Key Components: 15m Range Boxes: Automatically identifies and boxes every 15
FREE

The EA supports closing orders based on the preset amount. It can close all orders on all pairs, or it can close orders based on Magic ID. Button "Close All" manual Input - Magic Number: Magic Number = 0: Close All pairs Magic Number diffrent 0: Close All with Magic - Money TP: Profitable in money. the EA will close all orders - Money SL: Loss in money. the EA will close all orders Contact: t.me/nguyenvanbo128
FREE

A ideia do indicador é mudar de cores assim que o candle viole a banda; Caso o candle viole a banda superior, pinta o candle de vermelho, Caso o candle viole a banda inferior , pinta o candle de verde, Se o candle passar em algum momento pela média, ele assume uma cor acinzentada; Os candles que não passem pela média, nem violem a banda, apresentarão cor verde fraca, se for de alta e cor vermelha fraca se for de baixa. Projeto concebido no canal Aprenda a programar, keltner cores.
FREE

Double Line Donchian Channel MT5/Meta Trader 5 Indicator, this is customized Indicator to show only 2 Lines of Highest and Lowest PRICE line where you can add a MA (MOVING AVERAGE) for center line. What is Donchian Channel?
Donchian Channels are three lines generated by moving average calculations that comprise an indicator formed by upper and lower bands around a midrange or median band. The upper band marks the highest price of a security over N periods while the lower band marks the lowest p
FREE

StrikeZone ATR is a professional-grade ATR-based volatility indicator designed for precision intraday trading.
It visualizes volatility strength using a dynamic histogram and smoothed deviation line, helping traders instantly identify expansion, contraction, trend strength, and reversal zones. Key Features TradingView-style ATR histogram (Up/Down bars with multi-color levels) Smoothed deviation line for clearer volatility trend Instant detection of volatility spikes and quiet zones Color-coded b
FREE

Advanced Trade Mirror is a powerful Forex tool designed for traders who need instant, seamless trade replication across multiple terminals on the same machine. With lightning-fast execution, it ensures zero lag in copying trades, maintaining precision and efficiency in high-speed trading environments. Get the Trade Mirror Master here: https://www.mql5.com/en/market/product/133891
Specification:
Master ID: Identity value of master terminal, please use a unique value to prevent duplicated mas
FREE
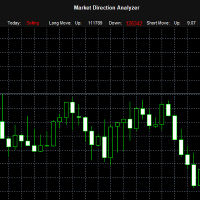
The "Market Direction Analyzer" is a technical indicator designed to provide traders with a comprehensive analysis of market trends, momentum, and potential reversals. By integrating multiple analytical tools, it offers a multi-dimensional perspective on market conditions, aiding in more informed trading decisions.
Using the Market Direction Analyzer in Trading: Trend Confirmation: By analyzing the aggregated sentiment score derived from its components, traders can confirm the prevailing market
FREE

WAP TP Stealth EA – Intelligent Basket Management for Precision Exits WAP TP Stealth EA is a specialized trade management expert advisor designed for traders who rely on basket strategies, recovery systems, and multi-position workflows. Instead of closing trades individually, the EA dynamically calculates the Weighted Average Price (WAP) of all open positions and executes a coordinated closure once your defined profit target is reached. This approach enables efficient drawdown management, smooth
FREE

The indicator measures the frequency of incoming ticks to analyze the market activity. Bullish and bearish ticks are analyzed separately, informing about the currently predominant market sentiment. According to observations, an increase in the frequency of ticks (panic) indicates the beginning of strong price changes, and an increase in the frequency of ticks in a particular direction not only accompanies a price change in this direction, but also often anticipates it. The indicator is indispens
FREE

Latency and connection stability are truly the "lifeblood" of a trader, especially if you do scalping or news trading, where a difference of just a few milliseconds (ms) can determine whether your order experiences slippage or not. Let's break it down step by step so everything is clear, starting from the connection path to how we can implement this dashboard idea in MQL5. 1. Connection Path: What Does the Number in the Bottom-Right Corner Actually Mean? When you see the traffic bars and latenc
FREE
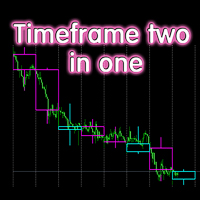
The indicator displays candlesticks of a given senior timeframe, on smaller timeframes
TF_Bar - selection of the senior timeframe, based on which candlesticks on the current one will be displayed.;
Number_of_Bars - the maximum number of bars up to which the indicator will be calculated.;
Color_Up - color display of bullish candlesticks;
Color_Down - color display of bearish candlesticks;
Widht_lines - the thickness of the indicator lines.
Other useful free and paid products can be viewed
FREE
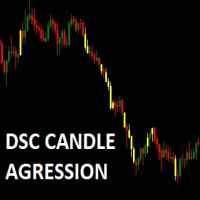
Corretora recomendada para usar esse indicador: https://tinyurl.com/5ftaha7c Indicador que pinta o candle de amarelo em pontos de muita agressão no mercado. Sempre que o mercado for se movimentar o candle irá ficar amarelo. Valido para todos ativos e todos timeframes. SEE OUR RESULTS ON INSTAGRAM: https://www.instagram.com/diogo.cansi/ TELEGRAM GROUP = https://t.me/robosdsc More information by email dscinvestimentos@gmail.com or by Whatsapp 55-991372299
FREE

The Equity Curve indicator is a simple and helpful tool that shows the development of the equity curve in real time. For precision measurement, it should be used in a separate window with a period of M1.
Main features The indicator shows the development of the equity curve in real time. High precision on the minute chart. High-speed calculation. Available for MT4 and MT5. Please visit the Equity Curve indicator product page for the input and output parameters settings.
FREE

Time Panel: Server Time, Local Time and Open and closed clocks for TOKYO, London and New York.
Time Panel + Horizontal Bar: Server/Local + Main markets Sessions
Example: TIMES SERVER HH:MM:SS LOCAL HH:MM:SS TOKYO OPEN 00:00 - 09:00 UTC cls 02:34:15 LONDON CLOSED 08:00 - 17:00 UTC opn 05:12:33 NEW YORK OPEN 13:00 - 22:00 UTC cls 07:45:22
https://t.me/Tonic_Trades_Signals
FREE

Multi-Period Profit Display Indicator for MetaTrader 5 Brief Description A sophisticated indicator that displays real-time profit/loss across 4 different time periods simultaneously in the top-right corner of your MetaTrader 5 chart. Features detailed Buy/Sell position breakdown for comprehensive daily analysis. Key Features 4 Time Periods Displayed Daily Buy & Sell - Breakdown by position type (Buy/Sell) for today Daily Total - Total daily profit/loss Weekly - A
FREE

Your limits, enforced — not just displayed. Most funded accounts are not lost to a bad strategy. They are lost to one bad session. A bad hour, after a bad morning, when the daily limit was already half gone and nobody was counting. This counts. It sits on your chart, watches the two limits that end most evaluations, and refuses to send an order that would break one. In 30 seconds It is free, and it is not a trial. No expiry, no account limit, no countdown, no pop-up, nothing that switches off a
FREE

Smart Risk Manager FOREX – Free On-Chart Lot Size Helper Smart Risk Manager Forex is the free & simplified edition of the Smart Risk Manager family. It helps you calculate your position size on Forex pairs using a clean drag-and-release workflow. Just drag on the chart and the indicator shows the recommended lot size based on your RiskUSD amount. It is small, fast and easy to use. Features ️ Drag-to-measure lot size directly on the chart ️ Clean & very lightweight – no panels, no clutter
FREE

Currency Strength Heatmap with Meter Overview Currency Strength Heatmap is a professional multi-currency strength indicator designed for MetaTrader 5. It analyzes the relative strength of the eight major currencies (EUR, USD, GBP, JPY, AUD, CAD, CHF, and NZD) in real time and presents the information through an advanced Heatmap Matrix and Currency Strength Meter. Instead of relying on a single currency pair, the indicator evaluates all 28 major currency combinations to identify the strongest and
FREE

Keltner Channels Enhanced - Professional Indicator with Alerts
Full Description:
Keltner Channels Enhanced is a professional-grade technical indicator that brings the classic Keltner Channels to a new level with advanced features and complete customization.
KEY FEATURES
Advanced Calculation Exponential Moving Average (EMA) based middle line. Average True Range (ATR) for dynamic channel width. Customizable price type (Close, Open, High, Low, Median, Typical, Weighted). Horizontal shift o
FREE

PositionsLimiter EA: Enforcing Trade Discipline with Position Limits The PositionsLimiter EA is a powerful risk management tool designed to help traders control the number of open positions at any given time. By allowing traders to set a maximum limit on simultaneous trades, this EA ensures that no additional trades exceed the specified threshold. If a trader or another automated system attempts to open a new position beyond the set limit, the EA will automatically close the excess trade, ensur
FREE

HARRAZ HUD BASIC - Your Gateway to Neural Trading Welcome to the future of market analysis. Harraz HUD Basic offers a glimpse into our advanced Artificial Intelligence trading ecosystem, designed to give you a clean, modern, and highly responsive Heads-Up Display directly on your MetaTrader 5 charts. CORE FEATURES (BASIC EDITION): 1. Live Neural AI Typewriter (Jarvis Mode) Experience an animated, real-time Heads-Up Display that types out market sentiment. It reads the underlying momentum
FREE

陰線インジケーター:各ローソク足の隠された力を解き放つ! 表面的な価格変動分析にうんざりしていませんか?各時間枠における買い手と売り手の力をより深く理解したいですか? ご紹介するのは 陰線インジケーター です。これは、市場の隠されたダイナミクスを視覚化し分析するための不可欠なツールです!この強力なインジケーターは、ローソク足の陰線のサイズに反映される買い手と売り手の間の目に見えない戦いを、チャート上に直接、明確で有益なヒストグラムに変換します。 ローソク足の陰線とは何ですか?なぜそれほど重要なのでしょうか? ローソク足の陰線、または「ヒゲ」と「テール」は、特定の期間中に価格が到達した最高値と最安値を、その期間の終わりに価格が確定したレベルとともに示しています。長い上ヒゲは強い売り圧力を示し、価格を到達した高値から押し下げます。逆に、長い下ヒゲは、価格の下落を買い支えた活発な買い手を示しています。 陰線インジケーターを使用すると、次のことが可能になります。 市場参加者の力を視覚化する: 対応するヒストグラムのバーの高さを観察することで、各ローソク足における買い手または売り手の優位性を瞬時
FREE
Breakout Shift Trader – MT5 Indicator Trade Like the Market Architects — Not the Victims. Most traders are fighting blind against a rigged game. Market makers engineer false breakouts, liquidity grabs, and “stop hunts” that wipe out retail accounts in seconds. Breakout Shift Trader flips the script. This MT5 indicator decodes the footprints left by institutional manipulation and aligns your trades with the power brokers driving real price action. Proven Results – Tested, Verified, Relentless N
FREE
Copier MS MT5 Netting Copyist MS is a fast and easy-to-use copier of trade orders; it works as an advisor in the form of a single file with switching between the Master and Slave operating modes. The current version of the adviser works only on netting accounts. Settings Type of work - selection of the operating mode: Master or Slave; Master account number - number of the trading account of the master terminal; Selective copying currency pairs - individual selection of currency pairs for copyin
FREE

* This product was converted using "BRiCK Convert4To5 MT4 " based on the MQL4 source file of "BRiCK Convert4To5 MT4 Free" . "Convert4To5" is a Script that converts MQL4 source files into MQL5 source files.
Experts, Indicators, Scripts, and Libraries with extension ".mq4" will be available for MT5.
Parameter
None.
Procedure
1. Open the following folder.
terminal_data_folder\MQL4\Files\ (in the terminal menu select to view "File" - "Open the data directory") 2. Confirm that the BRiCK_Conv
FREE
マルチタイムフレーム対応、カスタマイズ可能なビジュアルシグナル、設定可能なアラートシステムを備えたForce Indexインジケーター。
フリーランスのプログラミングサービス、アップデート、その他のTrueTL製品は MQL5プロフィール でご利用いただけます。
フィードバックとレビューを大変感謝いたします!
Force Indexとは? Force IndexはAlexander Elderによって開発され、価格の方向性、価格変動の大きさ、出来高を組み合わせて価格動向の背後にある力を測定します。今日と昨日の終値の差に、その期間の出来高を掛け合わせ、移動平均スムージングを適用することで計算されます。 正のForce Index値は買い圧力(強気派が優勢)を、負の値は売り圧力(弱気派が優勢)を示します。短期のForce Indexはトレンド内の調整での参入ポイントの特定に使用し、長期のものは主要な転換点を特定します。ゼロラインのクロスはトレンド方向の変化を確認します。 機能: 出来高統合モメンタム計算 スムージング用の設定可能なMAメソッド(SMA、EMA、SMMA、LWMA) 矢
FREE
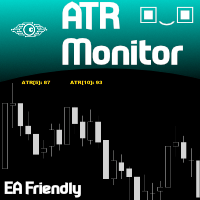
ATR Monitor ATR is a measure of volatility introduced by market technician J. Welles Wilder Jr. in his book, "New Concepts in Technical Trading Systems". In general, traders are accustomed to seeing the ATR in the form of a sub-window indicator. What I am presenting here is a simplified version of ATR - just the current ATR number - very useful for monitoring just the very moment of the current chart. And, by default, this indicator will not show up on screen, you can just use the buffers thems
FREE

Indicador Volatilidade Histórica Indicador é um oscilador que faz o plot da volatilidade histórica de um ativo, representado pelas fórmulas: Volatilidade Histórica = Raiz quadrada da média das diferenças ao quadrado * Fator de anualização. Média das diferenças ao quadrado = soma de todas as diferenças de retorno diário / número total das diferenças. Retorno diário = (preço atual - preço anterior) / preço anterior. Nesse indicador estamos utilizando os preços de fechamento de cada barra e fazemos
FREE

使用此EA可以通过币安交易所的API连接到MT5交易端,利用MT5强大的量化功能实现交易策略的回测。 操作方法: 1、首先 必须 把( http://api2.0.mt5.vip 、 https://fapi.binance.com )这两个 地址 填写到:mt5——工具——选项——EA交易下的WebRequest列表中,否则所有数据无法同步。 2、在导航栏找到EA,双击之后添加币安的API KEY ,保存后KEY自动保存; 3、KEY保存后会出现交易面板,通过MT5下的订单可以实时展现在面板,同事也可以监控币安交易所是否有同样的订单; 4、交易面板只展示订单的总持仓,请仔细核对,以防止漏单; 5、API KEY会自动保存在本地,第二次打开后无需重复输入; 6、目前只能支持BTCUSDT、ETHUSDT、LTCUSDT合约产品 7、最小交易量以币安的最小交易量为准; 8、币安KEY是存储在本地,不会上传到任何第三方,请放心使用; 9、如果想更换KEY ,请直接在EA内修改即可。
FREE
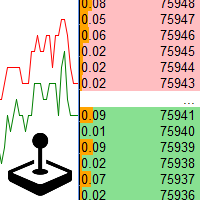
Playback of previously saved data from the order book.
Key features: Historical data navigation Adjusting the playback speed with the "---" and "+++" buttons, as well as with the mouse, you can by scrolling the wheel over the area of these buttons and between them Turning Price Centering On and Off Time display accurate to thousandths of a second Attention: This product also needs a utility to save data: https://www.mql5.com/en/market/product/71642
FREE
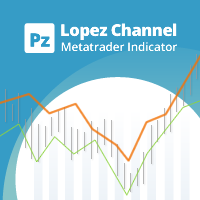
This multi-timeframe indicator identifies the market's tendency to trade within a narrow price band. [ Installation Guide | Update Guide | Troubleshooting | FAQ | All Products | Get Help ] It is easy to understand Finds overbought and oversold situations Draws at bar closing and does not backpaint The calculation timeframe is customizable The red line is the overbought price The green line is the oversold price It has straightforward trading implications. Look for buying opportunities when t
FREE

The indicator highlights in color the places on the chart where the price moves in one direction continuously from the selected number of candles.
You can specify the number of points from the beginning of the movement to select only movements from this amount.
It can be useful for looking for reversals or sharp impulses.
I also recommend purchasing this utility to determine local weekly / monthly trends and support and resistance lines. https://www.mql5.com/en/market/product/61401
FREE
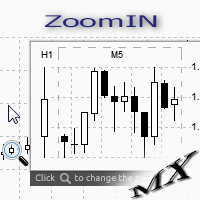
The ZoomIN MT5 indicator is designed for quickly viewing the selected bar on the smaller timeframes in a pop-up window. Once launched, the indicator works in the background, does not take up space on the chart and does not consume system resources. When the indicator is activated by the Shift + i combination (can be changed in the settings), a pop-up window with a chart of a smaller timeframe is created. The displayed timeframe can be changed by a left-click on the magnifying glass icon. To hide
FREE

The Average Directional Index (ADX) is a technical analysis indicator developed by J. Welles Wilder in 1978. Its primary function is to measure the strength of a trend, regardless of its direction, and to determine whether the price has entered a sideways trend. It is also mentioned by John Murphy in *The Visual Investor* (2005) as an indicator that helps determine whether a market is ranging or is about to start a new trend. As for Exponential Moving Averages (EMAs), some authors believe that
FREE

Drawdown Dashboard Lite 適合希望隨時掌握帳戶風險狀態的 MT5 使用者。
工具掛到任意圖表後,會每秒自動更新帳戶資料,讓使用者可以快速查看目前資金狀況與回撤程度,而不需要另外計算。
主要顯示內容包括:
Balance:目前帳戶已實現資金餘額 Equity:Balance 加上目前所有未平倉浮動損益後的實際帳戶權益 Floating P/L:目前全部持倉的總浮動盈虧 Current Drawdown:目前 Equity 低於 Balance 的金額與百分比 Session Peak Equity:自工具啟動後曾出現過的最高 Equity Session Max Drawdown:自工具啟動後,從最高 Equity 回落所出現的最大回撤 Positions:目前帳戶中的持倉總數
例如:
Balance: 10,000 USD Equity: 9,820 USD Floating P/L: -180 USD Current DD: 180 (1.80%) Session
FREE

Noetrix Lens
Read-only portfolio and performance analytics for MetaTrader 5.
Noetrix Lens turns native MT5 account history into clear portfolio intelligence from a single chart. It is designed for traders who want to understand where results come from without giving an analytics tool control over their trading.
Lens never places, modifies or closes trades. Algo Trading is not required.
## Main features
- Portfolio overview with net P/L, return, trade count, Profit Factor, win rate, average
FREE

MSX Heikin Ashi Advanced Overview MSX Heikin Ashi Advanced is a MetaTrader 5 indicator designed to provide a smoothed visual representation of price movement using a modified Heikin Ashi calculation. The indicator applies Heikin Ashi calculations to user-selected price sources and displays color-based candles that may assist with trend observation and market structure analysis. Features • Modified Heikin Ashi candle calculation • Real-time candle updates • Multiple applied price options • Color
FREE

Dragos Fractal Analog is a MetaTrader 5 indicator built for traders who want to compare the current market structure with similar historical price patterns.
The indicator searches past market data, finds the closest fractal analog, and projects the historical continuation onto the active chart using normalized scaling.
It is designed for research, pattern comparison, directional context study, and discretionary decision support.
Main features:
- Best historical pattern matching
- Current mode
FREE

For those who needs a levels of a first day of a month fully coded with Grok AI Standard settings: * line width * historic Lvl's * Line colors/type *************************************************************************************** Inspired by trader, to use these levels, but i wanted to mark these levels fast and not waste my time on drawing them.
FREE

MT5 Alert Indicator Please add Ema moving averages 60/100/200 & Rsi period 10 levels 30/70 to your chart. This indicator alert on a trend reversal strategy were - ema 60 > 100&200 - ema 100 < 200 And the Rsi is below 30 FOR BUY SIGNAL
Use this strategy in confluence with a larger timeframe trend in the same direction. This strategy identifies great entry opportunities to enter an early trend.
FREE
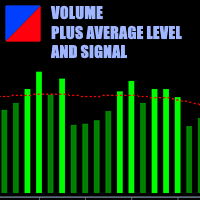
This is a volume indicator with the addition of a threshold level that can be set to a fixed value chosen personally or obtained from the average of the volume values themselves. The type of averaging method can be selected in the input parameters.
The input parameters are easy to interpret but let's examine them:
1 - Volume type Here you can select the type of volume you want to see represented and there are 2 choices, either TICK volume or REAL volume. Keep in mind that for forex, for examp
FREE
MetaTraderマーケットは自動売買ロボットとテクニカル指標を販売するための最もいい場所です。
魅力的なデザインと説明を備えたMetaTraderプラットフォーム用アプリを開発するだけでいいのです。マーケットでプロダクトをパブリッシュして何百万ものMetaTraderユーザーに提供する方法をご覧ください。

取引の機会を逃しています。
- 無料取引アプリ
- 8千を超えるシグナルをコピー
- 金融ニュースで金融マーケットを探索