 MetaTrader 5
 Experts
 지표
 라이브러리
 유틸리티
 위젯
 규칙
MetaTrader 5용 무료 Expert Advisor 및 지표 - 120
 트레이딩 로봇과 지표를 사용하여 외환 거래를 더 수익성 있게 만들 수 있습니다. 트레이딩용 로봇을 사용하면 개점 및 폐점 거래를 자동화할 수 있으며, 지표는 시장 행동을 보다 정확하게 예측할 수 있습니다.
이 페이지에는 MetaTrader 5 응용 프로그램의 카탈로그가 나와 있습니다.

Copy Trade PRO - Slave EA (FREE with Master EA) Receive Trades Automatically from Your Master Account Copy Trade PRO - Slave EA is a professional trade receiver designed for MetaTrader 5. It automatically mirrors trades from the Copy Trade PRO Master EA with fast execution, intelligent symbol matching, and flexible risk management. Telegram Support Link : @GoldBotXSupport Need help or have questions? Contact me on WhatsApp: https://wa.me/447378910922
This Slave EA is complete
FREE
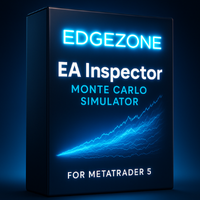
EdgeZone EA Inspector - FREE Edition Monte Carlo Analysis Tool for Trading Strategies Important: This is an analysis tool, not a trading robot. It does not execute trades but analyzes strategy data through statistical simulations. The Problem Many Expert Advisors show impressive backtest results but fail in live trading. The most common reason: over-optimization - the strategy was adjusted until it looks perfect for past data, but doesn't work for the future. The Solution: EdgeZone EA Inspector
FREE
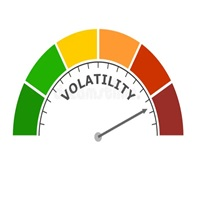
This indicator allows us to identify unusual volatility conditions.
If the ATR line is below the middle bollinger line, volatility is assumed to be below average. If the ATR line is above the middle bollinger line, volatility is assumed to be above average.
If the ATR line breaks the upper bollinger band, volatility is assumed to be high. If the ATR line breaks the lower bollinger band, volatility is assumed to be low.
FREE

Throw VolumeGap Mabrouk Identify Institutional Footprints with Precision Volume Analysis Overview VolumeGap is not just another volume indicator; it is a clinical trading tool designed to detect "Liquidity Surges" and "Institutional Entry Points." By analyzing the relative strength of every tick, this indicator pinpoint the exact moment when high-volume players enter the market, creating high-probability reversal and breakout opportun. LIMITED LAUNCH OFFER Current Price: $35 (Exclusive for the
FREE

This is a High-Precision Session Range Indicator designed for MetaTrader 5. It is built to help traders identify institutional liquidity zones and breakout opportunities by visualizing the "Big Three" trading sessions: Asia (Tokyo), London, and New York. Key Features: Visual Liquidity Boxes: It automatically draws shaded rectangles over the High-Low range of each session, making it easy to see where price consolidated or expanded. Intraday Price Extensions: It can project the High/Low levels of
FREE
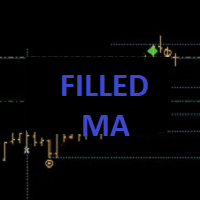
++++++++++++++++++++++++++++++++++ +++ Trend Tool ++++++++++++++++++++++++++++++++++ Hallo Trader, This is a trend tool that I use... based on four moving averages. Price below or above the EMA200 is indication for the long term trend. Also the direction of the slope counts. You can customise in settings if you want. The tool is aligned with my Forecast System and the Bounce Zones. - Forecast System --> https://www.mql5.com/en/market/product/156904 - Bounce Zones --> https://www.mql5.com/en/mar
FREE
Este indicador foi desenvolvido para auxiliar na tomada de decisão em operações de compra e venda. Ele realiza uma análise minuciosa baseada em um cálculo complexo que leva em conta múltiplos fatores do mercado. A partir dessa análise, o indicador gera um ponto visual que representa, de forma clara e objetiva, a direção sugerida – seja de entrada ou saída de uma posição. Sua principal função é fornecer ao trader uma leitura simplificada de dados sofisticados, facilitando o entendimento do moment
FREE

Simply deletes all objects from a chart, at once.
Q: Shouldn't I remove the indicator(s) from the chart instead, if I want to get rid of those objects? A: Absolutely. There are rare cases though, when you might end up with residual objects that don't programatically get removed from your chart, due to bugs or some other reason.
Q: Why use this script, when I can press Ctrl+B, list all objects, then manually select and delete each one? A: To save time, really. Maybe you have too many unwanted o
FREE

EquiSentra P&L transforms your MetaTrader 5 (MT5) account history into a clean, institution-ready performance report. You can filter closed deals by any date range, review full profit-and-loss details—including swaps, commissions, and all trading costs—and export a professional PDF accompanied by CSV data and checksums for easy reconciliation and audit. The report is self-generated directly from terminal data, so it is not a broker-certified statement and is not GIPS verified, but it provides t
FREE
KN DASHBOARD PRO – Smart Dashboard ️ Everything is displayed live on the chart: Give me a rating please
Number of open trades (Buy / Sell)
Total lot size
Daily, weekly, and monthly profit
Margin, balance, liquidity, and floating profit
Accurate real-time results monitoring system
This gives you complete control over performance without opening your trading history.
A quick breakdown of the indicator's function: This indicator displays a dashboard on the chart containin
FREE

Indicator of Stowell's Three-Bar Net Line. In this indicator, the number of bars used for determining the lines can be defined in the settings. With the default settings, the indicator draws arrows in the areas of the line breakout. The lines are not displayed on the chart by default. but can be enabled.
Parameters Alerts - enable alerts when arrows appear. Arrows appear on a forming bar and can disappear during bar formation. Therefore, it is recommended to wait for the bar with the arrow to c
FREE

Historical Similarity Matcher — DEMO (HI.SI.MA) This is the free demo version of the Historical Similarity Matcher (HI.SI.MA) indicator for MetaTrader 5.
FOR FULL VERSION CLICK HERE: https://www.mql5.com/en/market/product/164695 HI.SI.MA is a powerful technical analysis tool that scans historical price data to find segments statistically similar to a user-selected reference period on the chart. Once matches are found, the indicator overlays the historical patterns and draws forward projections
FREE

Smart money is a powerful currency. This money is available to major investors who can identify, predict or even generate capital movements ahead of others. This money can flow into financial and capital markets and create dramatic price changes in various stocks. Therefore, detecting smart cash flow, which usually enters the market in a coherent manner and confronts the volume and value of transactions in a market with high returns, is one of the methods that some investors use to invest. But h
FREE

Realized Volatility Indicator Description The Realized Volatility Indicator measures the actual volatility observed in the market over a specified period.
Unlike implied volatility (which is based on options pricing), realized volatility is based directly on historical price movements, offering a pure and objective view of market turbulence. This indicator can be used to: Assess market conditions, Optimize risk management, Fine-tune trading strategies based on volatility behavior. Key Features
FREE

STAMINA HUD – Advanced Market & Trend Dashboard (MT5) STAMINA HUD is a professional market information panel designed for traders who want clarity, speed, and control directly on the chart. It provides a clean heads-up display (HUD) with essential market data and multi-timeframe trend direction , without cluttering the chart or generating trading signals.
What STAMINA HUD Shows Current Price
Spread (in real pips)
Today High–Low range (pips)
Average D
FREE

Manage your trading schedule with Raba Time Scheduler EA. Functionalities: Set up infinit time ranges. Choose between these actions when out of schedule. Close all positions. Close all negative positions and protect the positive ones. Notes: Auto enabling/disabling algo trading is disabled due to MQL Market policies.
I you have any doubt you can leave it in comments and I will anwer it asap. If you found this tool helpful for you, a comment and a good rating will be appreciated. Also any propos
FREE

Volatility Range Panel MT5 Volatility Range Panel is a powerful, lightweight, and highly visual dashboard designed to give traders an instant overview of market volatility across multiple timeframes. By tracking daily, weekly, and monthly price movements relative to historical averages, this indicator helps you avoid overextended markets and identify high-probability trading zones. Whether you are a day trader looking for the daily average range exhaustion or a swing trader tracking weekly and m
FREE
This is a custom MACD (Moving Average Convergence Divergence) indicator designed for MetaTrader 5 (MT5) . It replicates the TradingView MACD version , ensuring consistency for traders familiar with that platform. The default MACD in MT5 has differences in its calculation and visualization compared to TradingView. This indicator provides an identical structure, allowing for accurate technical analysis across different platforms. Features TradingView-Style MACD – Matches the histogram, signal lin
FREE

This is the MT5 version. Get Q-Math MT4 here
Check it out and if you like it just enjoy it. Try various values to find the setting that best suits your trading. Upward signal if the indicator is colored lawn green and bearish signal if the indicator is gray. You can use the line itself to trailing stop when you open orders. This is just a tool. A complement. It is not a strategy. Combine it with your own analysis Just download it and try it, it's free.
FREE

More Advanced version is available as QuantView AnalyticsPro at https://www.mql5.com/en/market/product/205251 with a limited time offer of $50 for lifetime license. ===========================================================================================================================================================
QuantView Analytics Master Advanced On-Chart Portfolio Diagnostics & Equity Forensics for MetaTrader 5 Standard MT5 history reports simply show you how much money was made o
FREE

The indicator ColorCandlesDaily draw candles with different colors depending on the day of the week.
FREE
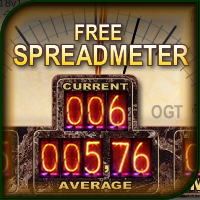
The indicator shows the current spread of the symbol, the minimum, average and maximum values for the current bar in the form of digital, analog and graphic indicators. Has two modes of operation: fixing the system spread, or calculating the spread as the difference between the "Bid" and "Ask" prices on each incoming tick. Parameters The indicator has a single input parameter: Type of calculation - type of spread calculation. It can take the following values: System spread - the spread value
FREE

Markov Regime — Bull / Bear / Sideways Markov Regime is a lightweight market-state indicator that answers one question on any chart: what regime are we in, how persistent is it, and what is the long-run balance between Bull, Bear and Sideways? It classifies every bar, colours the price by regime, and prints a live 3×3 transition matrix plus the long-run (stationary) distribution directly on your chart. What it does
FREE

ALBA GMT Detector PRO: The Ultimate Time-Sync Engine for MT5 Stop destroying your Expert Advisors with inaccurate backtests! Discover your broker's exact GMT offset instantly, flawlessly, and in real-time. The Silent Assassin of Algorithmic Trading Every professional trader and EA developer knows the backtesting nightmare. You buy or build a genius Expert Advisor, run a backtest, and get phenomenal results. But in live trading, it fails miserably. Why? GMT Offset Mismatch. Brokers change thei
FREE
NewTest https://backoffice.aurum.foundation/u/DHXP1U
The indicator is based on indicators built-in standard indicators, the indicator take into account the current indicators 30 indicators and give a signal to buy or sell, the General trend of all trends of other indicators. In the input parameters, you can configure special parameters for each indicator. the indicator is executed in the form of an oscillator and shows the General trend and the preponderance of all indicators in one or the othe
FREE

ATR Master – 차트에서 변동성을 마스터하세요! ATR Master는 전문적인 ATR 지표 로, 주요 데이터를 차트에 즉시 표시합니다! 가격 변동 범위를 분석하고, 이동한 거리와 남은 이동 가능성을 평가 하며, 캔들 타이머와 현재 스프레드를 모니터링할 수 있습니다. 트레이더들이 ATR Master를 선택하는 이유? 일일 ATR 분석 – 하루 동안의 평균 가격 변동 범위를 확인하며, 선택한 기간이 괄호 안에 표시됩니다.
ATR 이동 거리 – 가격이 이미 이동한 핍(pip) 수를 추적합니다.
남은 ATR – 시장이 아직 추가 움직임의 가능성이 있는지 확인합니다.
캔들 타이머 – 현재 캔들이 마감될 때까지 남은 시간을 확인합니다.
스프레드 모니터링 – 거래 진입 전에 시장 상황을 평가하세요.
언어 선택 (KR/EN) – 한 번의 클릭으로 텍스트 언어 변경 가능! ATR Master 주요 기능: 실시간 데이터 – 정보가 지연 없이
FREE

Close Position Index (CPI) Close Position Index (CPI) is a normalized oscillator that measures the relative position of the closing price within recent market structure.
It transforms price into a value between 0 and 1 , allowing traders to quickly assess whether the market is trading near its highs, lows, or equilibrium.
Core Idea CPI answers a simple but powerful question: Where is the current close relative to recent price behavior? 0 → price near recent lows 1 → price near recent
FREE

# Trading Info Panel - Your Complete Trading Dashboard
## Why This Indicator Was Created
As a fullscreen trader, I was constantly frustrated with the hassle of: - Exiting fullscreen mode to check positions - Switching between charts and the terminal window - Losing focus on price action while checking account status - Missing critical margin levels during active trading
**I needed a simple, elegant solution that kept all vital trading information visible at a glance - without disruptin
FREE

프로프 펌 및 개인 리스크 관리 규칙은 대개 특정 드로다운 지표(대부분 고정된 시간에 재설정되는 일일 한도)를 기준으로 수립되는데, 거래 중에는 해당 한도에 비해 현재 상황이 정확히 어느 정도인지 파악하기 어려울 수 있습니다.
Phoenix Drawdown Meter는 변동 드로다운이나 사상 최대 드로다운이 아닌, 거래일 시작 시점(자정 재설정)의 계좌 잔액 대비 드로다운 비율을 추적하므로, 화면에 표시되는 수치는 대부분의 일일 리스크 규칙에서 실제로 사용하는 측정 기준과 일치합니다.
리스크 가시성을 유지하는 방식
- 자정 잔액을 기준으로 한 일일 드로다운 비율의 실시간 게이지
- 사용자 지정 가능한 세 가지 임계값(녹색/노란색/빨간색)으로 개인 위험 한도 설정
- 바늘 움직임이 부드럽게 처리되어 티크마다 수치가 급격하게 변동하지 않음
- 드로다운이 빨간색 구간에 진입할 때 알림 제공(사용자 지정 가능한 쿨다운 시간 적용)
피닉스 드로다운 미터를 사용하여
FREE
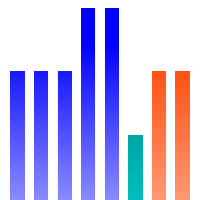
시장 팔레트는 관성 및 가격 변동의 가속을 기반으로 거래 결정을 필터링하기위한 강력한 도구입니다.
_________________________________
지시자 신호를 이용하는 방법:
표시기는 세 가지 색상의 히스토그램 신호를 생성합니다. 표준 색 구성표에서 파란색 열이 나타날 때 긴 포지션 만 유지하고 빨간색 열이 나타날 때 짧은 포지션 만 유지하고 회색 열이 나타날 때 거래 행동을 삼가하는 것이 좋습니다. 더 높은 열의 모양은 가격 움직임의 임계점의 형성을 의미합니다-열의 색상을 변경할 확률이 높습니다.
_________________________________
표시기 매개 변수는 히스토그램 표시 스타일을 변경하는 것이 좋습니다. 계산에 사용되는 매개 변수를 변경하는 것은 제공되지 않습니다-이 내 제품의 철학 때문이다:안정성과 객관성.
_________________________________
귀하의 질문 및 제안을 환영하며 비공개 메시지로 보낼 수 있습니
FREE

Precision Risk Manager and Multi-Order Controller for MT5 — Version 2 This utility provides risk-based lot size calculation, one-click order execution, and batch trade modification from a single collapsible panel. It is designed for manual traders who manage multiple entries on the same symbol. Features Lot Size Calculator: Enter a risk percentage and stop-loss price, then click Calculate Lot Size to receive the exact lot size for that risk amount. Order Execution: Click Buy or Sell to execute
FREE

Value Gap 는 Fair Value Gap 전략을 기반으로 한 스마트 도구입니다. 작동 방식:
이 지표는 최근 가격 움직임을 지속적으로 분석하여, 매수자와 매도자가 남긴 불균형 영역(Fair Value Gap)을 식별합니다. 이러한 갭이 발견되면 차트에 명확한 수준으로 표시되어 시각적으로 쉽게 확인할 수 있습니다. 도구는 이후 가격의 향후 움직임을 모니터링합니다. 시장이 허용된 기간 내에 갭을 다시 테스트하고 채우면, 자동으로 신호를 생성하여 거래 기회를 알려줍니다. 사용자는 **Gap Threshold (%)**를 조정하여 의미 있는 갭만 필터링할 수 있고, Max Bars to Touch 를 설정하여 레벨이 유효한 기간을 제어할 수 있습니다. 깔끔한 시각적 표시와 다양한 알림 기능(화면, 모바일 푸시, 이메일)을 통해 차트가 기회에 집중되도록 돕습니다. 단독으로 사용하거나 기존 전략과 결합하여 가격이 반응할 가능성이 높은 영역을 쉽게 확인할 수 있으며, 거래 결정에 명
FREE

The Luta Volatility Meter is an essential technical indicator for traders in MetaTrader 5 (MT5). It was developed by Eng. Lutandula to clearly measure and visualize market movement, helping you easily identify high and low volatility periods. By calculating the average daily trading range, this tool offers a simple yet powerful way to gauge market activity and potential movement for better trade timing Key Advantages Optimal Trade Timing: Helps you identify whether the market is slow (low vol
FREE

Points Candles Osw
Dies ist ein professioneller Volatilitätsindikator, der entwickelt wurde, um den genauen Verlauf von Kerzen in Punkten zu quantifizieren. Durch ein dynamisches Histogramm in einem unabhängigen Fenster ermöglicht er es Tradern, das Momentum und die Preisstärke zu visualisieren und Volatilitätsspitzen sowie kritische Bewegungsniveaus sofort zu identifizieren.
Parameterleitfaden (Eingabemenü) Show Points Candles Bullish: Aktiviert die Anzeige der Daten für bullische Kerzen. Sh
FREE

RiskRewardPanel – MetaTrader 5용 리스크-보상 계산 도구 RiskRewardPanel 은 거래 전 리스크 및 예상 수익을 명확하게 계산해주는 유용한 유틸리티입니다. 계좌 잔고, 리스크 비율, 보상 비율 등의 사용자 설정을 기반으로 적절한 로트 크기, 스탑로스 및 테이크프로핏을 자동으로 계산하고 차트에 시각적으로 표시합니다. 주요 기능: 리스크 및 수익 계산
설정된 비율에 따라 USD 기준의 잠재적 손실 및 수익을 실시간으로 표시합니다. 자동 로트 크기 계산
사용자가 설정한 리스크 퍼센트에 맞춰 적절한 로트 크기를 산출합니다. 거래 라인 시각화
매수/매도 전 SL 및 TP 선을 차트에 표시하여 전략적 판단을 도와줍니다. 브레이크이븐 및 트레일링 스탑 옵션
수익 방향으로 일정 거리 이동 시 스탑로스를 진입가로 조정하거나 자동으로 추적 조정합니다. 통합된 차트 패널 UI
직관적인 사용자 인터페이스를 통해 리스크, 로트 크기, 보상 비율 등의 입력을 쉽게
FREE

FWS Tide Clock — Session Clock & Activity Monitor Know when to trade — at a glance. FWS Tide Clock is a real-time session clock that shows you exactly what's happening across global forex markets. See which sessions are active, when they overlap, and whether conditions favour trading — all from a compact on-chart panel with a stunning browser-based web dashboard. Part of the Forex Weather Station suite. This free module gives you instant market timing awareness — right where you need it. W
FREE
Description This is a utility tool for MT5, and it displays some useful information on charts for discretionary trading. Some of the information obtained by using indicators that are standardly installed by MT5 or by manual calculation is displayed on the chart from the beginning.
Benefits of the This Is Something Useful MT5 The minimum necessary information that needs to be confirmed in discretionary trading can be displayed on the chart at any time. By using this tool, you can quickly access
FREE

Fuzzy Oscillator is developed for personal use in future EA projects, so Fuzzy Oscillator is not too special, but it will help make trading easier when you can use Fuzzy Oscillator to identify trends and entry and exit points. Why Choose Fuzzy Oscillator: Fuzzy Oscillator is not repaints. There are many ways to use it like trading pullback, reversals and many more. Can help traders identify potential trend reversals, momentum shifts. Catch the long wave when a new trend starts. Suitable for all
FREE

ATR Accelerator Indicator informs you about strong price movements based on the ATR Indicator. This Indicator works for all Timeframes and Symbols, the strength of movements can be configured.
Important: Get informed about new Products, join our MQL Channel: https://www.mql5.com/en/channels/etradro
Useage This Indicator works for all Timeframes and Symbols, the strength of movements can be configured. Features works on all timeframes and forex pairs or indices. Alert and Notify function inc
FREE

The Volume Heatmap indicator visually shows the INTENSITY of the volume taking into account the concept of standard deviation. Purpose of the Indicator: High volumes are common where there is a strong consensus that prices will increase. An increase in volume often occurs at the beginning of a new upward trend in the price of an asset. Some technical analysts do not rely on trend confirmations without a significant increase in volume. Low volumes usually occur when an asset is heading for a down
FREE

Description The Profit and Loss Indicator by Creative Tech Solutions is a robust and comprehensive tool designed to help traders monitor their trading performance in real-time. This indicator provides detailed metrics on profits and drawdowns, ensuring traders are always informed about their trading activities and performance. With customisable alerts and display settings, this indicator is an essential tool for any serious trader. Features Real-Time Metrics : Monitor profit and drawdown percent
FREE
이 지표는 고급 손실 포지션 모니터 로, 시기적절하게 대응하여 자본을 보호할 수 있도록 설계되었습니다. 현재 심볼의 모든 열린 거래를 실시간으로 분석하고, 여러 시간대에서 ATR을 사용하여 변동성을 계산하며, 가격이 스탑로스(Stop Loss)에 얼마나 가까운지 파악합니다. 다이내믹 스탑로스 및 손익분기점 과 같은 시각적 라인과 각 거래에 대한 핵심 정보를 담은 블룸버그 스타일 패널 을 표시합니다. 계좌 잔고 대비 손실 비율 핍(pips) 및 ATR 배수로 나타낸 스탑로스까지의 거리 거래가 열려있던 시간 직관적인 색상으로 표시되는 경고 상태 (경고, 위급, 또는 긴급) 또한, 거래가 위험 구간에 진입하면 음성 알림 및 푸시 알림을 보냅니다. 입력 변수(Inputs) 설명 기술적 설정 (Technical Settings) TimeframesToAnalyze: ATR 계산에 사용되는 시간대 (예: "H1, H4, D1"). ATRPeriod: 변동성을 측정하기 위한 ATR 기간. Min
FREE

Advanced History Collector Panel for MT5 The Advanced History Collector Panel is a professional-grade account analysis and visualization indicator for MetaTrader 5 (MT5). It bridges the gap between raw trading logs and actionable insights by transforming execution data into interactive charts and comprehensive tables. Key Features: Comprehensive Data Metrics : Track daily/weekly profit and loss, long/short ratios, total volume, and deposit/withdrawal history. Dynamic Visualizations : Toggle betw
FREE
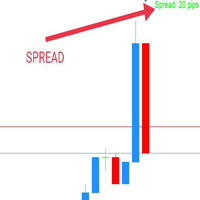
WaSpread MT5 Indicator shows the current spread in pips with color.
* Set the Spread Threshold and the color to identify when the current spread is below or above the Spread Threshold.
* Set X axis and Y axis and chose the Corner and the Anchor to position the Spread Label on the chart.
* Write the font and the font size for more confort.
* Activate alert if the current spread is above the spread threshold.
* For more precision, the user can choose to show the decimal numbers.
* The user
FREE

Arixis Backtest Inspector — Go Beyond the Final Profit
Arixis Backtest Inspector is a professional MetaTrader 5 analysis tool designed to help traders understand the real structure behind historical trading results. Instead of focusing only on net profit, win rate or profit factor, it examines how results are distributed over time and how dependent a strategy may be on a small number of exceptional trades or trading days. The tool analyzes trade performance, winning and losing streaks, closed-e
FREE

Dynamic Indicator --> YKL_DinDX Dynamic Indicator that creates a Band based on the distance from moving average specified by the user. The indicator considers the period entered by the user in order to calculate the average distance from moving average, creating an upper band and a lower band. This indicator is utilized by EA YKL_Scalper, version 2.0 or superior.
FREE

Set your risk before you place a trade. RiskLot shows the lot size as you move Entry, Stop Loss, and Take Profit on your MT5 chart. It is a calculator, not a trading robot. It does not open, change, or close orders. Choose risk as a percentage of balance, a percentage of equity, or a fixed cash amount. Move the Entry, Stop Loss, and Take Profit lines on the chart. See money at risk, potential reward, and the reward-to-risk ratio in one panel. Check the price distance and current spread before pl
FREE

The Cossover MA Histogram indicator is a simple tool showing the trend based on crossover of moving averages. Simply specify two mobving averages and addicional parameters like MA method and Applied price. When fast MA is above slow MA the histogram is green, indicating an uptrend. When MA fast is below MA slow the histogram is red, indicating an downtrend.
FREE
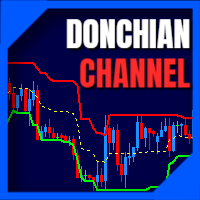
The donchian channel indicator might just be the best fit for you
Trading in derivative products such as futures, options, CFD's, forex and certificates contains significant risk. These products are not suitable for every investor. Investors could potentially lose all or more than the original investment. If anything, only money equal to personal risk capital should be used and can be lost without jeopardizing financial security or lifestyle. Partially or fully automated trading programs can
FREE

Sentimento de Mercado é um indicador que usa os dados do nosso principal indicador: Market Strength Radar.: https://www.mql5.com/pt/market/product/114568?source=Site +Profile+Seller Ele imprime um gráfico de linhas que deve ser comparado com o gráfico de preço para entendermos o sentimento do mercado. As divergencias são pontos importantes de inflexão. As convergências mostram força da tendência atual.
FREE

Just a panel for drawing levels. Minimal but very useful thing. This is a reimagining of Color Levels Pro. ---- 4 types of customized levels. support for rectangle and line levels. The indicator parameters are very simple and are divided into blocks. For any update idea please contact me here. ---- Extension version " Levels tool pro " ---- don't suffer don't suffer ---- Enjoy your work!!!!!!!! ----
FREE

AI Correlation Pair Scanner is a real-time multicurrency correlation monitor that helps you avoid hidden overexposure when trading several pairs at once. Many traders unknowingly double their risk by holding positions on two pairs that move almost identically (for example EURUSD and GBPUSD, or the JPY crosses). This tool calculates live Pearson correlation between every pair in your watchlist and warns you the moment your open positions overlap on two highly correlated instruments. KEY FEATURES
FREE

*** IMPORTANT NOTE: For the best visual experience, please change your standard chart type to 'Line Chart' (Alt+3) and set the 'Line Graph' color to 'None' in chart properties (F8) to hide the default MetaTrader candles. ***
LZ Kyushu Legs Basic is a streamlined visual momentum indicator that replaces traditional Japanese candlesticks with noise-free, wickless Kyushu Legs. By focusing exclusively on pure price momentum and filtering out market noise, this tool allows traders to easily identify
FREE

This Phoenix Pro MTF Dashboard acts as your high-level command centre, transforming a cluttered chart into a streamlined, data-driven trading panel. By consolidating data from M1 to Daily timeframes into a single view, it eliminates the need to flip through multiple windows, allowing you to focus purely on execution. Panel Component Breakdown Signal (Summary): A quick snapshot of current price momentum. It tells you immediately if the most recent candle action is bullish or bearish. Trend (50 S
FREE
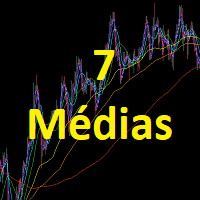
Este indicador apresenta 7 médias configuráveis, que podem facilmente ser utilizadas em robôs ou em operações manuais.
Facilita a identificação de tendências e reversões. Seus buffers estão ordenados e são facilmente identificáveis para utilizar em robôs. Liberado para uso em operações manuais ou automatizadas.
Em breve vamos postar um robô que utiliza estas médias como parâmetro de negociação.
FREE

El Trend Detection Index (TDI) es un indicador técnico introducido por M. H. Pee. Se utiliza para detectar cuándo ha comenzado una tendencia y cuándo ha llegado a su fin. El TDI puede usarse como un indicador independiente o combinado con otros; se desempeñará bien en la detección del comienzo de las tendencias.
Los indicadores de tendencia son esenciales para detectar las tendencias de los mercados financieros. Estos indicadores ayudan a determinar la dirección que probablemente siga el activ
FREE

Median is a clean price structure indicator designed to plot the rolling median of recent highs and lows directly on the chart. Creator: https://www.quant-atlas.com/ The indicator calculates the 50th percentile of recent low prices and high prices over a selected lookback window. This creates two dynamic reference lines that can help traders read the central structure of recent price behavior. Signal Display • Purple line: rolling median of lows
• Red line: rolling median of highs These lines
FREE
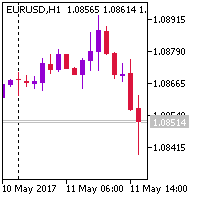
This indicator changes the standard MetaTrader 5 candles to candles at the selected BID, ASK or Average price (BID+ASK)/2. Simply attach the indicator to the chart and select the prices to plot the candles or bars. Indicator Parameters ENUM_DRAW_TYPE - plot candles or bars on the chart For the price - the price for plotting the candles or bars The chart returns to its normal visualization mode after removing the indicator.
FREE

Green Indicator by Quant Atlas Creator: https://www.quant-atlas.com/ Green Indicator is a clean reversal focused trading tool designed to highlight potential turning points using momentum pressure and directional slope behavior. The indicator studies the relationship between momentum position and momentum direction. When market pressure reaches an extended condition and begins to shift, the indicator plots green triangle signals directly on the chart. Both bullish and bearish signals use the sa
FREE
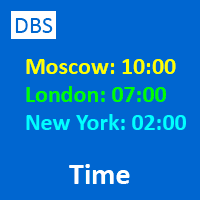
A small utility displays the time in five time zones. You can customize the display of one to five time zones. For each time it is configured: show or not; name; time offset from GMT; color; In general settings, you can change: date / time format ("hh: mi", "hh: mi: ss", "yyyy.mm.dd hh: mi", "yyyy.mm.dd hh: mi: ss") font name; font size; offset from the left edge of the chart; offset from the top edge of the chart;
FREE

Limit Open Positions EA
"Limit Positions EA is a powerful utility tool designed to provide strict control over the number of open positions in your trading account. This Expert Advisor continuously monitors your trading activity and ensures that no new positions are opened once the specified limit is reached. Ideal for traders seeking to mitigate overexposure and manage risk effectively, Limit Positions EA works seamlessly across all symbols and timeframes. Whether you're managing a large port
FREE

Quote Cost Parity is a MetaTrader 5 chart panel for forex majors and minors that share a quote currency. Pairs with the same quote have the same pip cost for a given lot. The indicator uses that correspondence directly: it calculates the cost once for the group, then shows that cost for three lot sizes. It acknowledges only these quote groups. JPY: USDJPY, EURJPY, GBPJPY, AUDJPY, NZDJPY, CADJPY, CHFJPY. Source : USDJPY. CHF: USDCHF, EURCHF, GBPCHF, AUDCHF, NZDCHF, CADCHF. Source : USDCHF. CAD:
FREE

Description in English Spartan Radar Multi-Time is an advanced tactical information and alert dashboard engineered specifically for manual traders. The software monitors real-time price action and market momentum, streaming instant audio alerts and push notifications directly to your smartphone or tablet (iOS/Apple and Android). The system operates as a true tactical radar: it analyzes the mathematical convergence of Bollinger Bands and a 50-period Moving Average on the hourly (H1) structur
FREE

Aydmaxx Trade Tracker Description: Aydmaxx Trade Tracker is a powerful and user-friendly tool for traders, allowing you to monitor the current profit or loss for each trade in real-time. The indicator displays the information directly on the screen, helping traders quickly assess the results of their trading operations. Key Features: Displays the current profit or loss for all open positions in real-time. Customizable corner of the screen for displaying information (default is the bottom right c
FREE

Overview This Expert Advisor acts as a slave receiver designed to work seamlessly alongside the Copy Trades Master application. It reads broadcasted master signals in real time and automatically mirrors trade operations on the local slave account. https://www.mql5.com/en/market/product/189493 Key Features: Unlimited Slave Accounts: Broadcast signals from a single master to as many slave terminals as you need with no performance limit. Flexible Lot Management: Customize trade sizing using a lot m
FREE

A lightweight, non-intrusive on-chart floating dashboard for MetaTrader 4 (MT4) and MetaTrader 5 (MT5) . It provides critical market telemetry and live account status directly inside the chart window with interactive drag-and-drop and minimize functionality. Key Features Interactive Drag & Drop: Click anywhere on the dashboard panel to reposition it seamlessly across the chart window. Automatic boundary detection keeps the panel within the chart frame. Smart Minimize / Expand Toggle ( _ / + ): C
FREE

This is a simple and lightweight indicator that displays the live spread of the trading instrument on the top left corner of the screen. It is built to be lightweight, performant and react to real time price feed. The spread is the difference between the Ask and Bid price of the trading instrument. This is the cost that the user needs to pay for immediate execution. It is crucial to know and track the spread to be aware of costs involved. In the standard accounts, the spread is the only cost you
FREE
Indicador IMI (Intraday Momentum Index) Descrição O Indicador IMI (Intraday Momentum Index) é uma poderosa ferramenta de análise técnica desenvolvida para identificar a força do momentum e potenciais reversões no mercado. Este indicador quantifica a relação entre ganhos e perdas durante um período específico, ajudando traders a avaliar a dinâmica atual do mercado. Características Oscila entre 0 e 100, facilitando a interpretação das condições de mercado Identifica com precisão áreas de sobrecomp
FREE

GDS Renko MultiSymbol - Multi-Symbol Renko Overview Indicator for MetaTrader 5 GDS Renko MultiSymbol is a Renko multi-symbol overview indicator for MetaTrader 5. It helps traders monitor Renko market context across several instruments from one compact visual workspace. The purpose of this tool is to make multi-symbol Renko observation easier. It does not predict market direction, does not generate buy or sell signals and does not decide which symbol should be traded. Renko EDGE EA
Why Multi-Sym
FREE

Full Description (Professional MQL5 Version) Psychology Guard Pro is a powerful MetaTrader 5 indicator that protects traders from emotional trading decisions by monitoring equity changes and excessive trading activity. This tool is ideal for forex traders, prop firm challenge participants, scalpers, and grid traders who want better psychological control and structured risk management. Key Features Equity-Based Psychology Alerts Displays a STOP Trading alert when loss exceeds a defined pe
FREE
MetaTrader 마켓은 과거 데이터를 이용한 테스트 및 최적화를 위해 무료 데모 거래 로봇을 다운로드할 수 있는 유일한 스토어입니다.
어플리케이션의 개요와 다른 고객의 리뷰를 읽어보시고 터미널에 바로 다운로드하신 다음 구매 전 트레이딩 로봇을 테스트해보시기 바랍니다. 오직 MetaTrader 마켓에서만 무료로 애플리케이션을 테스트할 수 있습니다.
