Repaint Inspector
- ユーティリティ
-
Quoc Dat Quach
 Software engineer with 8 years in fintech and mobile, writing MQL4/MQL5 since 2017. I build Expert Advisors, indicators, trade and risk-management panels and utilities for MT4/MT5, and I trade forex and gold on MT5 myself.
 - バージョン: 1.0
Repaint Inspector measures whether an indicator repaints instead of taking the claim on trust. You attach it to a chart, name any custom indicator and its parameter list, and it re-reads that indicator's buffers on bars that have already closed, counting every value that moves, every value that appears and every value that disappears, together with how far back in history that still happens.
It is a measuring tool. On a chart it never sends an order. In the Strategy Tester it opens and closes one minimum-volume position at the start, because the automatic MQL5 Market test checks that an Expert Advisor performs a trading operation; that trade is announced in the journal, is not part of the measurement, and an input switches it off. It uses no DLL and no network access, and writes nothing to disk except its two CSV files in MQL5\Files.
Why it exists: non-repainting is a common claim in an indicator description and a hard one to check. The usual test is to look at the chart, remember roughly where the arrows were, reload and look again. That test misses the two cases that cost money. The first is a value on a bar that closed some time ago changing while the chart stays open: the arrow moves a few pixels, or it is removed while your attention is at the right edge. The second is an indicator that behaves while it lives and publishes a different history after it is reloaded, which is exactly what a timeframe switch, a terminal restart or a fresh chart does to a user. Both are measurable.
How the measurement is defined, which is the part that decides whether the result means anything:
- A bar is identified by its open time, never by its shift, so new bars, scrolling and history refills cannot be mistaken for a change.
- Only closed bars are compared, shift 1 and higher. The bar that is still forming changes by definition and says nothing about repainting.
- The first value seen for a closed bar becomes the reference. Every later reading is compared with the previous reading, which counts an event, and, whenever that counts an event, with the first reading, which measures the drift.
- Three kinds of event are counted separately, because they are not equally bad. Changed: a value moved to a different value. Appeared: an empty slot received a value, so a signal materialised on a bar that was already closed. Vanished: a published value was erased, which is the serious kind, because the signal a trader acted on is no longer in the history the next reader sees.
- The headline number is MaxShift, the largest shift at which any event was ever seen. An indicator that only redraws the last closed bar is a different animal from one that rewrites fifteen bars.
- Every event is written to a CSV file with the detection time, the bar time, the shift at detection, the buffer, the event kind, the old and the new value, the delta, the drift from the first reading and an after-reload flag, so the report can be recounted instead of believed. A second file holds one row per buffer with every counter, refreshed every 15 seconds while the run goes on.
- The indicator under test is created with IndicatorCreate from a parsed parameter list, so any custom indicator can be inspected without editing or recompiling anything. The parsed list is printed to the journal at start, which makes a wrong parameter list visible instead of silent.
- The handle can be released and created again every N minutes, with the recorded history deliberately kept, which is meant to catch the indicator that is quiet while it lives and publishes a different past after a reload. The terminal only recalculates on a reload when no other program holds the same indicator with the same parameters, so remove that indicator from your charts while this test runs.
- A check is discarded and counted as skipped, not as evidence, whenever the handle does not exist yet, the indicator is not calculated yet, there are fewer closed bars than the depth being watched (on the first usable check the depth itself is cut to the history available, and the journal says so), a buffer cannot be copied, or the series moves between reading the times and reading the values.
Measurements made with indicators that ship with the terminal, so anyone can repeat them. Four copies on four charts of one terminal, XAUUSD M1, 1 hour 26 minutes, 300 closed bars watched, one check per second:
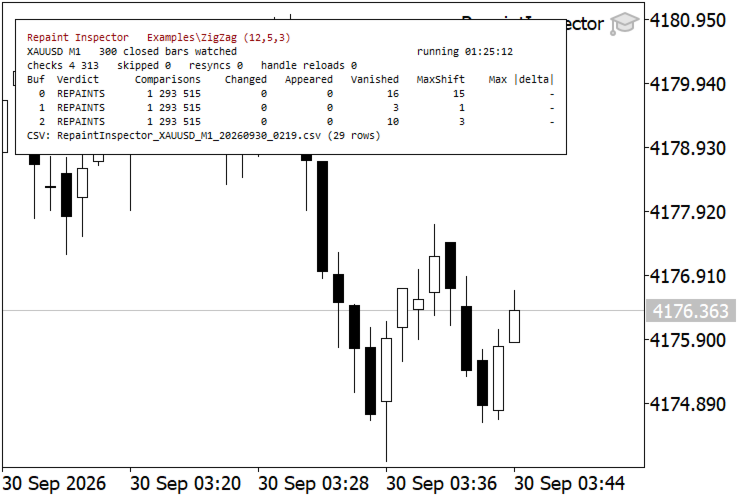
- Examples\ZigZag (12,5,3): 1,315,713 comparisons per buffer, 0 changed, 0 appeared, 17 vanished on the plotted buffer with MaxShift 15, and 3 and 10 vanished on the two calculation buffers. Nothing moved, because a ZigZag extreme is the High or the Low of its bar and cannot drift; it is removed and re-published elsewhere.
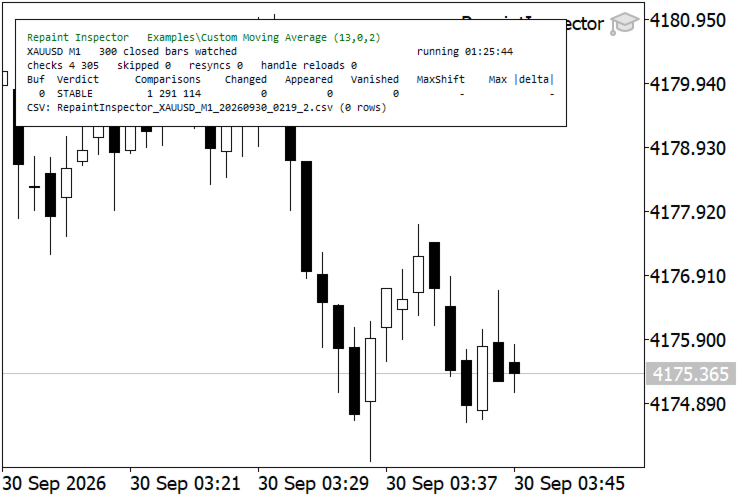
- Examples\Custom Moving Average (13,0,2): 1,305,513 comparisons, not one event.
- Examples\Fractals: 25 events, all of them Appeared, none Changed, none Vanished, all at shift 3. That is not repainting but late confirmation, since a fractal needs two more bars before it can be drawn, on 1,303,713 comparisons. The verdict line still reads REPAINTS, because the tool reports what it saw and leaves the judgement to you: events that are all Appeared at one fixed shift mean a usable indicator with a known delay, events that are Vanished at scattered shifts do not.
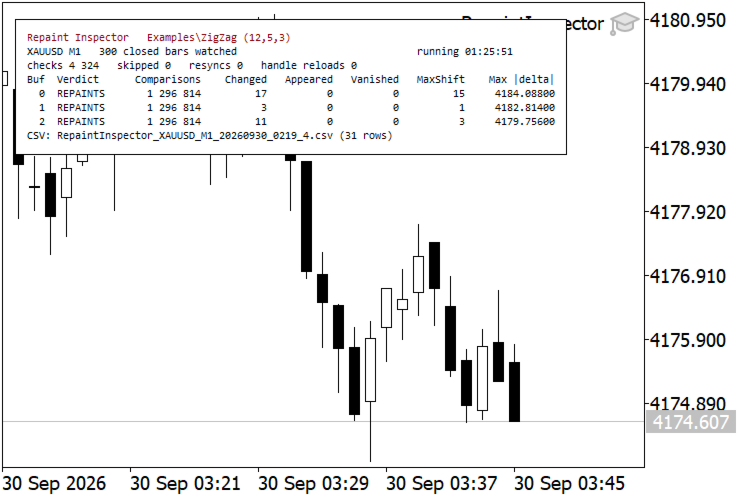
- The fourth copy ran the same ZigZag with 0.0 counted as an ordinary value instead of as no value: 1,308,513 comparisons, 32 events, all of them Changed, the same MaxShift of 15, and a largest absolute delta of 4184.088, which is the gold price, because each deletion is now a peak replaced by 0.0. The same repainting, under a different name.
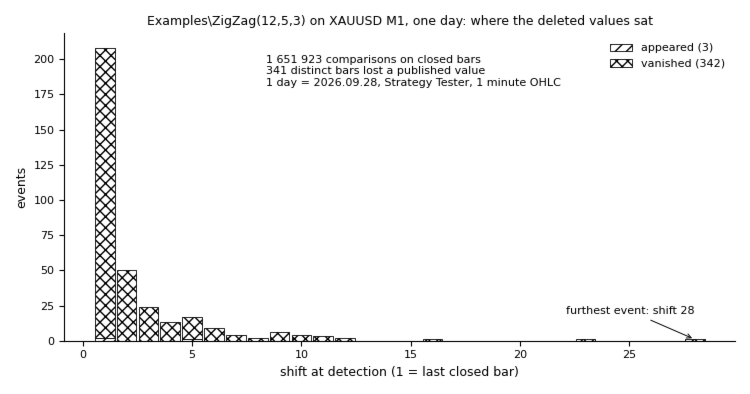
Those three ZigZag, moving average and Fractals runs took 4,387, 4,353 and 4,347 checks. The same instrument in the Strategy Tester compresses a day into seconds: the same ZigZag over one trading day of XAUUSD M1, 1-minute OHLC modelling, gave 5,512 checks, 1,651,923 comparisons, 342 vanished and 3 appeared values on bars that were closed at the time, 343 distinct bars touched, and a MaxShift of 28.
Independent check of the counters. An independent Python re-implementation of Examples\ZigZag was run over the raw candles fetched from the terminal and compared with the event files. Live run: for each of the 17 bars where the plotted buffer lost a value, that value is absent from the replay, and for all 17 the tool's last reading equals the replayed value. Tester run: 343 bars with events, 341 of them bars that lost a value; the same two checks, no mismatch. The comparison counts reconcile as well: 87 new M1 bars opened during the live run, and (checks minus 1) times 300 minus 87 reproduces each reported comparison count exactly.
Inputs: the iCustom path of the indicator to inspect and its parameters as a comma separated list, the number of buffers to watch (1 to 32), symbol and timeframe if you want to inspect them off the chart, the number of closed bars watched (default 300), the minimum seconds between checks (default 1, modelled time in the tester), an absolute tolerance below which a change is ignored, a switch that treats 0.0 as no value for arrow and ZigZag style buffers (on by default), the handle recreate interval, an optional stop after N minutes, the CSV switch, file name and row limit, the panel settings (show or hide, corner, offsets, font size and five colours), and the switch for the Strategy Tester sample trade described above. Every input is documented by its own comment in the terminal. The path is empty by default on purpose: with nothing filled in the tool says so in the journal and on the panel and measures nothing, rather than pointing at an indicator that may not be on your terminal.
Limits, stated plainly. The tool cannot prove the absence of repainting; it can only fail to find any over the period measured, which is why the comparison count stands next to every verdict. It samples at the check interval, so a value that comes and goes inside one interval can be missed: that happened once in the hour and a half above, where the two ZigZag copies, started 14 seconds apart, disagree about one bar (03:32, on two buffers) whose value existed for less than one check interval, so one copy sampled it and the other did not. It measures what an indicator publishes through its buffers, so an indicator that draws chart objects instead of filling buffers is invisible to it. In the Strategy Tester the indicator under test must be present and compiled before the run starts: the tester treats a failed IndicatorCreate as a critical error and unloads the expert, which no error handling inside the tool can change. On a live chart the same wrong path is not fatal, the tool stays attached and retries every 30 seconds, so the input can be corrected without removing it.
The sample trade in the Strategy Tester uses the symbol's minimum volume, is sent without a stop loss or a take profit, and the margin is checked against free margin before it is sent, so a small test deposit produces a journal line instead of a rejected order. It carries its own magic number, it is closed again on a later tick, and no counter, verdict or CSV row of the measurement is touched by it. Measured on a 1000 USD tester deposit: one trade, two deals, 0.06 USD of cost, and with Examples\ZigZag under test over the same range every repaint counter matched the build that carries no trading code at all, down to 3,404,353 comparisons, 10 vanished values and MaxShift 17.
Practical limits. Bars multiplied by buffers may not exceed 200,000 slots, which is a memory guard; above that the depth is reduced and one line is written to the journal. It is an Expert Advisor, so it takes the chart's one expert slot: one copy per chart, not on a chart where your own expert runs, though several charts can run copies at once. Ask only for buffers the indicator actually has, because a buffer that does not exist fails every check, and after five journal lines those failures are only counted as skipped. A CSV name of your own is overwritten at every start; the automatic name carries the start minute. In the Strategy Tester the files are written to the testing agent's own MQL5\Files folder, not the terminal's, and a repaint seen in the tester and a repaint seen live are not automatically the same thing - when the answer matters, run it live. Finally, the tool says nothing about whether an indicator is worth trading: a non-repainting indicator can still be useless, and some repainting indicators are used deliberately and correctly.