YouTubeにあるマーケットチュートリアルビデオをご覧ください
ロボットや指標を購入する
仮想ホスティングで
EAを実行
EAを実行
ロボットや指標を購入前にテストする
マーケットで収入を得る
販売のためにプロダクトをプレゼンテーションする方法
MetaTrader 4のためのエキスパートアドバイザーとインディケータ - 47

SR is a support and resistance indicator, it shows major highs and lows by different colors. The color of a level is changing if the last high or low are touching it. After the closing of a bar above or below level, it will delete it. extern inputs: loop for candles / colors / drawing time *This indicator signal is not perfect and have to be used with other market analysis and confirmations.
FREE

This indicator is designed for scalping in the Forex market and trading binary options. A signal appears at the opening of a new candle. Usage Recommendations: For Binary Options: It is recommended to open trades when a signal appears on the first candle. A buy signal appears when the blue X replaces the red one, while a sell signal occurs when the red X replaces the blue one, as shown in the screenshots. For the Forex Market: Enter a trade when a signal appears as described above. It is advisa
FREE

This is a multi time frame demand and supply indicator for MT4 platform. You can use multi time frame demand and supply levels on smaller time frames. Additionally you can choose to kill every level has has been tested. you have narrow bands that is you can select the whole demand and supply level or just a narrow section Finally, you also get price range for the zones. Awesome
FREE

The robot was created based on CCI (Commodity Channel Index) logic, and it is a very stable Expert Advisor (EA). It is optimized for XAUUSD (gold) by default, but you can run it on any currency pairs. Take Profit : 10 pips Stop Loss : 90 pips Grid Order : Every 5 pips All orders are closed when the total profit in dollars reaches a certain amount or when each individual order hits its take profit.
FREE

The Colored MACD indicator is a versatile and powerful tool designed to enhance your technical analysis by providing an intuitive visualization of market momentum and trend changes. Built on the foundation of the popular Moving Average Convergence Divergence (MACD) indicator, this version introduces color-coded histograms to easily distinguish between bullish and bearish momentum. Key Features: Color-Coded Visualization : The indicator features a lime-colored histogram when the MACD is above the
FREE
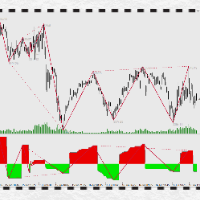
万能背驰指标简介(DivergenceLines) 注意注意,这个指标不能单独运作,对以下两个指标有依赖,请确保先获得以下两个指标后才购买本指标! 1) 动力之梯(PowerTrapezoid) (力度评估副图指标,本指标) 2) 万能分段(LinesSegment) (线段划分主图指标) 。 3)万能背驰(DivergenceLines,本指标) (比较力度背离主图指标)。 指标原理: 通过获取动力之梯指标的筹码堆积值,依照万能分段指标为依据,对同向线段向前回朔,进行一一对比,当后面线段力度比前面力度小时,定义为背驰(背离),背驰的两个高点(或两个低点)之间可以连接一条背驰线,当某个高点(或低点)连接的背驰线越多,这个点就构成了多个单级别背驰区间套。
FREE

Maltese cross GBP Универсальный инструмент для определения трендов, флетов и торговли по графическим паттернам. Объединяет техники Гана, Эллиота, Мюррея.
Просто разместите его на графике и он покажет направление и скорость движения цены, выделит разворотные моменты. Maltese cross поможет точно определять узловые моменты в истории, планировать торговые действия и сопровождать открытые сделки. Эта бесплатная демонстрационная версия MalteseCross ограничена GBPUSD и кроссами GBP. Никаких прочих о
FREE

The script tries to determine the overall direction of the market, using smoothed Heiken Ashi candles. The coloring system (using bright and dark colors) is an attempt to detect strong market and weak market conditions. There's also an oscillator within the script
These are the features: Alert condition Features: You can now set alerts in the alert dialog for events like trend switch, trend strengthening and weakening; all for both Bullish and Bearish trend.
I also added the code for custom a
FREE

Индикатор "Стрелки" (Arrow Drawing Tool) Краткое описание: Удобный инструмент для рисования стрелок на графике с помощью кнопки и мыши. Позволяет визуально отмечать направления движения цены, уровни поддержки/сопротивления и важные ценовые зоны. Основные возможности: Простое управление - кнопка "Стрелка" для активации режима рисования Автоматическая окраска - зеленые стрелки для движения вверх, красные для движения вниз Настраиваемый дизайн - регулируемая длина и угол наконечника стрелки Г
FREE
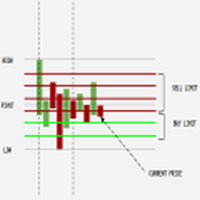
The EA creates a grid of equally spaced pending limit orders taking into account: - The current price; sell-limit above / buy-limit below - The trading range; computed by using the weekly highs and lows The EA then manages the orders while they have been executed. The logic is: IF #EXECUTED ORDERS == 2 OPEN NEW LIMIT AT THE PEN. PRICE
IF #EXECUTED ORDERS > TOT - 2 RESET THE LIMIT ORDERS TO RANGE - check the video for the full strategy at: https://youtu.be/f_ebFsGpIZQ?si=k8IBWe4qJxpz2zjJ
FREE

Time Based Close - Automated Trade Management EA Overview
Time Based Close is a powerful and user-friendly Expert Advisor (EA) designed for MetaTrader 4 (MT4). It automates trade management by closing positions based on a user-defined holding time, while also protecting your account with a dynamic drawdown control feature. Whether you're a beginner or a seasoned trader, this EA simplifies your trading strategy and helps you manage risk effectively. Key Features Time-Based Closing : Automatical
FREE

WARNING: Product is out of support! MT5 version is highly recommended due to superior back-tester. It has much better reviews than the MT4 version, due to that fact.
Free version of the grid strategy! Identical strategy to the full version, the only limitation is the number of positions. Its goal is to harvest most out of trending market (on automatic mode) taking advantage of corrections in trends. It can be also used by experienced traders on manual trading. This kind of system is being used
FREE

Este indicador irá ajudá-lo a traçar as linhas do horizonte ( Marcelo Ferreira ) do Grafico semanal. Você poderá mudar trabalhar por exemplo em M5 ou M15. As linhas semanais permanecerão lá. Analisar as tendências em gráficos semanais antes de fazer uma entrada no mercado Forex é essencial para identificar a direção predominante do mercado a longo prazo. Esse tipo de análise ajuda a evitar decisões impulsivas baseadas em flutuações de curto prazo e fornece uma visão mais clara sobre o movimento
FREE
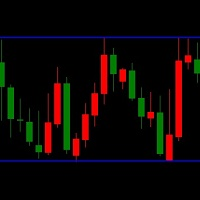
LT Triple Support Resistance Screen Method is a kind of levels indicator that consist of three SR lines. It is built by MQL4 programming language and can be used to MT4 platform. A free version indicator to determine the support and resistance levels easily This indicator works based on the screen method to calculate the most appropriate value for each buffer. A complex algorithm based on long research is applied to this free custom indicator. But this indicator has limited features and simpler
FREE
This EA opens a buy sell order based on the H4 trend. When the price goes over 100 pips ea keep opening orders against the price until the profit is positive and EA will close all orders and continue the new round. Requirement - Flatform: MT4 - Symbol: XAUUSD. - Time frame: M15 - Minimum deposit: >500$ - Leverage: 1:500 and higher - ECN broker - Virtual Private Server hosting (VPS) Parameters
FREE

The "Chart synchronization" utility (the SynchronizeCharts indicator) can help traders in simultaneous trading on multiple financial instruments, as it automatically scrolls all or selected charts of the terminal according to the position of the master chart. Four charts are shown in the screenshot 1. The EURUSD chart is the master chart, as the SynchronizeCharts indicator is attached to it. As a result, the other three charts are displayed on the timeline starting from 2017.02.17 23:15. Any fu

Now there is no need to check volatility on third-party websites in order to determine the average movement rage of a certain currency pair. The Truly Volatility indicator is designed for determining volatility for the specified period and is displayed in a separate window as a histogram and line. If attached to a chart with the Н1 timeframe, the indicator displays the average price movement for each hour (from 0 to 23) based on the history data. On the D1 timeframe it displays the average movem
FREE
Easily track and trade with the trend using this indicator. Uses a circle and line to indicate the trend direction. Excellent for channels. Features alert function.
Parameter TrendPeriod can be changed to your preference. How to use: Simply attach to any chart. Blue circle plus blue line cross below price = Buy. Red circle plus red line cross above price = Sell. Best results when taking higher time frames into consideration before entering a trade. (Hint: Wait for the radar/circle to appear on
FREE

Inspector - Real-Time Performance and Drawdown Monitoring for MetaTrader
See More, Trade Better - enhance your MetaTrader experience with this essential performance tracking tool, extracted from the powerful Meta Extender suite. What It Offers: Continuous real-time calculation and monitoring of your trading performance, drawdown, and key statistics across multiple time periods. The Inspector displays comprehensive metrics for daily, weekly, monthly, and yearly performance, keeping you inform
FREE

This oscillator has become one of the main tools of most professional traders. The indicator includes a classical MACD ( Moving Average Convergence/Divergence ) line, a signal line, as well as a MACD histogram. Exponential moving averages are used in the calculation. The indicator also provides the ability to enable signals on identification of divergences between the price graph and the indicator. Divergences are identified using three patterns: classic, hidden and extended divergences.
Indica
FREE

TrendExpert Indicator Overview
The TrendExpert indicator is designed to identify and visualize trend zones in financial markets. It utilizes zigzag high and low points to determine support and resistance levels, providing insights into potential market reversals and continuation patterns.
Features - Detection of support and resistance zones based on price action. - Strength categorization (Proven, Verified, Untested, Turncoat, Weak) based on historical testing. - Adjustable parameters for z
FREE

The indicator detects the direction of the trend and colours the candles on the chart accordingly.
Allows you to enter the trade at the beginning of the movement
The easiest way to set up the indicator
Can be used on any currency pairs, metals and cryptocurrencies, as well as when working with binary options
Distinctive features Shows the trend direction Does not re-draw Easy and accurate adjustment; Works on all timeframes and all symbols; Suitable for trading currencies, metals, options a
FREE

H I G H - P R O B A B I L I T Y - B R E A K O U T T R E N D L I N E I N D I C A T O R This is no ordinary trendline indicator. It has a highly-probability algorithms incorporated in the script to display only trendlines that may give a very high chance of price breakout. The indicator is not a stand alone indicator. Trader should interpret it together with their very own analysis technique to come up with a more efficient trading strategy. You can use with it other trend indica
FREE

Draconis Expert Working best with GOLD - M30 Require minimal 500$ for 0.01 (AutoLot feature inside) --------------------------------------------------------- This is a Single EA, less orders but might more Accuracy. Powerful Portfolio EA Launched NOW with QuantLynk Engine Series. More information Click here . ------------------------------------------------------------ Indicators and Concepts Quantitative Qualitative Estimation (QQE): QQE is an advanced version of the Relative Strength Index
FREE

Volatrend_EA is a 100% automated trading system designed specifically for the M15 timeframe . Its strategy is based on a confluence of multiple factors—trend, momentum, and volume—to identify high-probability entries in the market. The key differentiator of this EA is its fully adaptive risk management system . Instead of using fixed values, it utilizes the Average True Range (ATR) indicator to dynamically adjust the Stop Loss, Take Profit, and Trailing Stop to the current market volatility. Th
FREE

This indicator signals about crossing of the main and the signal lines of stochastic (lower stochastic) in the trend direction which is determined by two stochastics of higher time frames (higher stochastics). It is not a secret that stochastic generates accurate signals in a flat market and a lot of false signals in a protracted trend. A combination of two stochastics of higher time frames performs a good filtration of false signals and shows the main tendency. The indicator is recommended for
FREE

MT5 Version Most indicators draw lines.
This one draws the battlefield. If you ever bought an EA or indicator based on a perfect equity curve — and then watched it bleed out live — you’re not alone.
The problem? Static logic in a dynamic market. Fibonacci Bollinger Bands adapts.
It combines Bollinger structure with customizable Fibonacci levels to mark zones of control — where price reacts, pauses, or reverses. No magic. Just logic that follows volatility. Why this tool matters It shows yo
FREE

トレーダーの便宜のために、取引をより快適で安全にするために多くの機能が追加されました。
Expert Advisorには、単方向グリッドに対する保護の作成者のインジケータが組み込まれています。
推奨ツール:USDCHF ;
GBPUSD;
EURUSD;
USDJPY;
USDCAD;
AUDUSD;
EURJPY;
推奨最小mmおよび設定: usdchf、預金=$1000、ロット=0.01、楽器の予想される年間利益=15-25%;
GBPUSD、預金=$1000、ロット=0.01、楽器の予想年間利益=25-55%;
EURUSD、預金=$1000、ロット=0.01、楽器の予想年間利益=25-75%;
USDJPY、預金=$1000、ロット=0.01、楽器の期待年間利益=30-45%;
USDCAD、預金=$1000、ロット=0.01、楽器の期待年間利益=20-35%;
AUDUSD、預金=$1000、ロット=0.01、楽器の予想年間利益=50-75%;
EURJPY、預金=$1000、ロット=0.01、楽器の期待される年間利益=30-45%;
マルチ
FREE
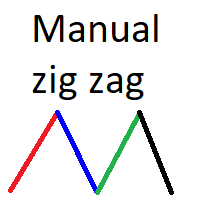
Manual Zig-zag allows you to build a zig-zag with the mouse, to build it is necessary to turn on the zig-zag and left-click. The file must be placed in the \ MQL4 \ Indicators folder then in the terminal from the list of indicators put it on the chart.
A zigzag can be built so that this zigzag can only be seen on the current time frame or in all halves at once.
You can change the color and thickness of the line while on the chart without getting into the settings.
You can quickly remove each
FREE

With this app you can find the stop out level live or without opening a transaction.
The application consists of 3 boxes, you can enter the amount of money in your Balance box account or it will automatically calculate the current account amount. SELL lot size and BUY lot size can be entered, or trades that are currently open will be calculated automatically. Hedge transactions are calculated automatically.
If you press the S key of the keyboard, you can access the boxes with the values entere
FREE

Simulator for Risk / Reward ratio calculator We-RiskReward is a MT4 indicator made by the We-Trading team to simulate an order with Risk / Reward calculator.
Horizontal Lines This indicator show you 3 horizontal lines that are: Open line Take Profit line Stop Loss line You can move the lines and you will see R/R and Lots calculation in real time. You can use it to simulate Long and Short positions.
Indicator parameters As input parameters you need to check only the Risk for trade. For e.g. you
FREE

Ska ZigZag Line indicator determines the overbought and oversold regions within a trend. The indicator determines the overbought region by the candlestick high and the oversold region by the candlestick low in a form of a line. To utilize the full strategy i recommend using "Ska ZigZag Line" together with "Ska ZigZag BuySell". NOTE: This indicator is a line based indicator. HOW TO USE: Sell Signal; Place a sell trade when the Ska ZigZag BuySell indicator arrow appear on top of the Ska ZigZag Lin
FREE

Rung トレンドインジケーター。インディケータは、価格変動の主な傾向を識別し、さまざまな色でマークしますが、主な傾向に対するノイズや短期的な価格変動を排除し、反応しません。 インディケータは、市場の現在のトレンドを決定するツールです。デフォルト設定では、価格がチャネル内で移動すると、インジケーターは上昇傾向(「強気」トレンド)、インジケーターは緑色の線でマークされ、下降トレンド(「弱気」)トレンドは赤色の線でマークされます。 、インジケーターは反応しません。コリドーまたは横方向の価格変動の値は、インジケーターの設定によって調整できます。
インジケーター設定の説明 striction_points-コリドーのサイズ(ポイント単位)。 factor_smoother-平滑化係数。 アラート-ユーザーデータを含むダイアログボックスを表示します。 Text_BUY-買いシグナルのカスタムテキスト。 Text_SELL-売りシグナルのカスタムテキスト。 Send_Mail- [メール]タブの設定ウィンドウで指定されたアドレスにメールを送信します。 件名-電子メールの件名。 Send_No
FREE

Description I think, almost all traders dream about non-lagging MA. I have realized that dream in my indicator. It allows forecasting future MA values! The indicator can be used in four different ways: The first one - forecast for the desired amount of bars. Thus, you are able to evaluate future price behavior. The second one - generating non-lagging "averages". That can be implemented by moving MA back by the half of the averaging period and setting the forecast the necessary amount of bars ahe
FREE
BinaryPin is an indicator developed and adapted specifically for trading short-term binary options. The indicator's algorithm, before issuing the signal, analyzes many factors, such as market volatility, searches for the PinBar pattern, calculates the probability of success when making a deal. The indicator is set in the usual way. The indicator itself consists of an information window where the name of the trading instrument is displayed, the probability of making a successful transaction, the
FREE

The indicator uses the Chester W. Keltner's channel calculation method, modified by the well-known trader Linda Raschke. Due to the modification, the calculated channel contains a much more complete overview of the price movements, which allows increasing the probability of an accurate prediction of the upcoming price movement. Unlike the classic Keltner method, the base line of the channel is plotted based on the Exponential Moving Average, and the Average True Range is used to calculate the up
FREE

The BB Arrows MTF indicator is based on the Bollinger Bands indicator. Represents input signals in the form of arrows. All signals are generated on the current bar. In 2 modes, Signals are not redrawn (Exception of very sharp jumps)! All signals in MTF mode correspond to signals of the period specified in MTF. It is maximally simplified to use both for trading with only one indicator and for using the indicator as part of your trading systems. A feature of the indicator is that the indicator ti
FREE

High Impact Level EA DE40, US30, FTMO Recomment Broker.
EA can Trade with every Broker that have Volume 0.01 by Indizes. Dont let the Robot Work alone. Important must be Change in Settings for DE40 or US30 inp1_VolumeSize: 0.1 inp1_VolumePercent: 0.00001 inp1_GridStartOffset: 1000.0 inp1_GridStartRoundNumbers: 1000.0 inp1_GridSize: 1000.0 inp2_VolumeSize: 0.1 inp2_VolumePercent: 0.00001 inp2_GridStartOffset: 1000.0 inp2_GridStartRoundNumbers: 1000.0 inp2_GridSize: 1000.0 inp1_GridSizeTP:
FREE
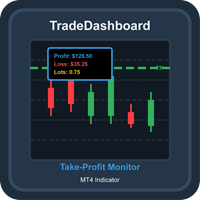
TradeDashboard Comprehensive MT4 Indicator for Trade Visualization and Analysis Overview TradeDashboard is a powerful MetaTrader 4 indicator designed to enhance your trading experience by providing real-time visualization of take-profit levels for all open positions. This advanced tool goes beyond basic TP indicators by displaying comprehensive metrics including potential profits, losses, and total lot sizes, all directly on your chart. Key Features Take-Profit Visualization : Clearly displays h
FREE

PatternVol EAは、市場の独自の観察に基づいて作成され、パターン、ローソク足分析、ローソク足ボリュームの分析で構成され、EAにはインジケーターが含まれていません。現時点では、アドバイザーは私の非インジケーター戦略の小さなコンストラクターです。各戦略を個別に無効化および有効化するか、複数の戦略からアセンブリを作成できます。アドバイザーの作業は今日まで続いており、新しい戦略が追加され、アルゴリズムが改善されています。将来的には、誰もが独自の取引戦略を組み立てることができる、非指標戦略の大規模なアグリゲーター(コンストラクター)になるでしょう。
* Expert Advisorは、ECNアカウント(5桁)およびH1タイムフレームのEURUSDペアでの使用をお勧めします。
Expert Advisorは、厳密なSLおよびTP設定を使用します。
Test DEMO: https://www.mql5.com/ru/signals/978514
エキスパートアドバイザーのパラメーター
Slippage... -すべりの最大レベル
OnOff ...-戦略を有
FREE

Martingale Gapsは、外国為替市場EURUSD M30向けに特別に設計された、完全自動のプロの取引ロボットです。自動取引で少しのお金で始めたい人のために特別に設計されています。もちろん最小ロットで。他の人にとっては、リスクを高めるだけで十分です。 このEAはパラメータを設定する必要はありません。 EURUSDM30で作業する準備ができました。 入力と出力の順序は、移動平均、勢力均衡の2つの指標に基づいています。 アカウントのエクイティがこの値を下回った場合、専門家はすべてのポジションをクローズし、自動取引を停止します。 値はアカウント通貨で設定する必要があります。例: Protection_Min_Account = 700は、エクイティが700 USD(アカウントがEURの場合はEUR)を下回ると、ポジションをクローズします。 静的入力intProtection_Min_Account = 0; //最小アカウントで取引を停止します。 エキスパートは、ティックごとにオープンポジションをチェックし、選択されたものよりも低い(短い場合は高い)SLまたはSLが見つからない場合
FREE
T3 2Lines – ダブルラインで捉えるトレンドの精度 「T3 2Lines」は、T3(Triple Exponential Moving Average)をベースにした2本の移動平均ラインを表示するMT4インジケーターです。短期および長期のT3ラインを同時に描画することで、トレンドの転換点や持続性をより精緻に判断することが可能になります。 このインジケーターでできること 短期と長期、2種類のT3移動平均線をチャートに同時表示 各ラインの期間と平滑係数(smoothing factor)を個別に設定可能 トレンドの初動や継続判断、押し目・戻りの識別に活用 視認性の高いライン表示で裁量トレードの補助に最適 T3とは? T3(Triple Exponential Moving Average)は、一般的な移動平均(SMAやEMA)よりも滑らかなカーブを描くのが特徴です。従来の移動平均に比べてノイズが少なく、トレンドの本質をより明確に視覚化することができます。「T3 2Lines」では、このT3を短期・長期で重ねることで、より多角的な相場分析が可能になります。 主な用途と活用シナリオ ク
FREE

ティックスキャルパー「Tick Scalper」
純粋な価格行動、インジケーターなし。常に損切り/利確を設定し、トレーリングストップで追跡。 主要パラメータ パラメータ デフォルト値 説明 TakeProfit — 固定利確(ピップ単位)。 StopLoss — 固定損切り(ピップ単位)。 TrailingStop — ポジション修正のためのトレーリングストップ距離(ピップ単位)。 cSeconds — シグナルチェック間隔(秒単位)。 MinPriceShot — シグナルをアクティブにする最小価格変動(ピップ単位)。 MaxOrdersCount — 同時に開ける最大注文数(定数)。 RiskPercent — 残高に対するリスク%(自動ロット計算用)。 FixedLotSize — 固定ロットサイズ(UseAutoLot = falseの場合)。 UseAutoLot — 残高とリスクに基づく自動ロット計算。 MagicNumber — EA注文の一意識別子。 MaxSpread — 取引開始可能な最大スプレッド(ピップ単位)。 通貨ペアのプリセットと
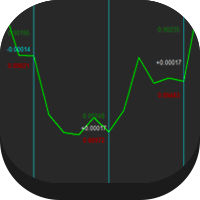
This indicator gives the highest and lowest information of the currency you have selected and the day you selected. It also shows the average. In this way, you can find out the profit / loss probability of your transactions for the same days. Reported: Average points per week Average points per year Lifetime average points Note: It does not provide you with buy / sell signals. Shows average points only
FREE

This indicator demonstrates that the price change of financial instruments is NOT a random walk process, as advocated by the "Random Walk Hypothesis", and as popularised by the bestselling book "A Random Walk Down Wall Street". I wish that were the case! It is shown here that the real situation with price change is actually much worse than a random walk process! Deceptive market psychology, and the bulls-bears tug of war, stack up the odds against traders in all instruments, and all time frame
FREE

Below you will find the explanation of the complete version of MultiCurrencyCTX not yet published. MultiCurrencyCTX Strategy Explanation up to version 1.331 MultiCurrencyCTX is an Expert Advisor based on ADX indicator and on the DXY index of the US dollar which allows to identify the strength of the US dollar and therefore carry out Buy or Sell operations on the currencies correlated to it. The EA uses the following currencies for its trading activity: EURUSD - GBPUSD – USDJPY – USDCAD - USDCH
FREE

BB & RSI Candle Color: Technical Analysis Indicator on MetaTrader 4 The "BB & RSI Candle Color" indicator is a powerful technical analysis tool designed for MetaTrader 4 traders looking for an effective visual representation of market conditions. Created by 13 Crow Trading Club, this indicator combines the popular Bollinger Bands and the Relative Strength Indicator (RSI) to provide clear and accurate visual signals. This indicator offers three key aspects: Candle Color: Normal candles are displa
FREE

ロボットは、1週間のうちでマルチタイムフレームでローソク足の高値、安値を調査します。
またその価格での反転を予測しながらエントリーします。
ベスト通貨はEURUSD でタイムフレームはH1,H4が好相性です。
デフォルトの設定では、最大で10までエントリーしますので、エントリー数を調整してください。
バスケットクローズを使用して、複数のエントリーを利益が一定値になるとまとめてクローズします。
デフォルトではストップロスは30pipに設定してありますので、ベストの値を入力してください。
利益がマイナスでクローズすると、次のエントリーからロットサイズを上げる設定も使用できます。
タイムフィルターや、GRIDオーダーの機能もついています。 マジックナンバーは自動設定です。複数のチャートにEAをアタッチすると自動で割り振られます。 スプレッドフィルターを使用しない場合はゼロを入力します。 デモテストデーターはMyfxbookと、mq5 webにあります。 URL: Miracle Robot https://www.mql5.com/ja/signals/1795756?utm_source=
FREE

The StrikePin indicator is a technical, analytical tool designed to identify trend reversals and find optimal market entries. The StrikePin indicator is based on the pin bar pattern, which is the Price Action reversal pattern.
An entry signal, in a trending market, can offer a very high-probability entry and a good risk to reward scenario.
Be careful: the indicator is repainting since it is looking for highest high and lowest lows. You should avoid to use it in experts but you can use it in
FREE

This semaphore indicator is based in the standard RSI, which is applied over the Envelopes indicator that shows an envelope or envelope fluctuation borders. This is a version of RSI vs Envelopes Graph drawn in a separate window . A sell signal emerges when the upper envelope/border is broken by the RSI indicator from top to bottom. A buy signal emerges when the lower envelope/border is broken by the RSI indicator from bottom upwards. The indicator can draw arrows on the indicator, draw vertical
FREE

This is a very simple yet useful tool to close positions with different conditions and methods. You can use panel buttons to close positions or set multiple rules to close all positions. Panel has two main tab, Active Order and Pending Orders:
Active Tab:
You can set profit or loss target to close all positions.
You can set equity target to close all positions,
You can set a special time to close all positions. Moreover, by panel buttons you can close only buy/sell positions or only negative/pos
FREE

Background The EA trades a grid of orders using the martingale technique. It is designed for multi-currency trading. It opens and closes a large number of orders. My account monitoring: https://www.mql5.com/en/signals/author/mizrael
Advantages Trading results are visible every day. The EA works 24/5. Is not sensitive to trading conditions. Suitable for a rapid deposit boost. Ease of use.
Recommendations Use the EA on several pairs simultaneously. Recommended deposit 500 $. When using the EA on
Highly configurable OBV indicator.
Features: Highly customizable alert functions (at levels, crosses, direction changes via email, push, sound, popup) Multi timeframe ability Color customization (at levels, crosses, direction changes) Linear interpolation and histogram mode options Works on strategy tester in multi timeframe mode (at weekend without ticks also) Adjustable Levels Parameters:
OBV Timeframe: You can set the lower/higher timeframes for OBV. OBV Bar Shift: Y ou can set the offset
FREE
The Light Pullback Breakout Trading can determine the breakdown of price highs and lows and trade after a small pullback (depending on settings). It does not use risky methods, there are not as many settings as in the advanced version , but this EA is free and can trade on all currency pairs and timeframes. There are various settings for finding lines and filters for transactions. Full (extended version): https://www.mql5.com/en/market/product/41327 Differences from the free one: customizable
FREE

BB-Sub – サブウィンドウ表示型ボリンジャーバンド BB-Sub は、ボリンジャーバンド(Bollinger Bands)をチャートのサブウィンドウに独立表示できる、シンプルかつ高機能なインジケーターです。通常のボリンジャーバンドはメインチャートに重なって表示されますが、BB-Subはサブウィンドウで動作するため、ローソク足や他のインジケーターと重ならず、バンドの動きや形状の変化に集中して分析したい方に最適です。 主な特徴 上限バンド、下限バンド、ミドルバンド(SMA)をサブウィンドウに同時表示 初期値は20期間・±2σですが、期間やバンド幅(偏差)はパラメーターで自由に調整可能 計算に使用する価格(終値・始値・高値・安値・中央値・典型価格・加重平均)を選択でき、戦略に応じた最適化が可能 他のインジケーターとの比較・併用や、複数のサブウィンドウによるマルチタイム分析にも対応 軽量設計でチャートの動作が重くならず、長期データにも快適に対応 サブウィンドウの高さを調整することで、より細かくバンドの拡大・収縮やボラティリティの変化を観察可能 パラメーター一覧 パラメーター名 説明 初期
FREE

L'indicatore Trend Reversal è uno strumento tecnico progettato per identificare potenziali inversioni di trend sul mercato, basandosi sulla formazione di Pin Bar . È particolarmente efficace su time frame come H1 (orario) , dove i pattern di inversione tendono a essere più affidabili. L'indicatore segnala le inversioni di trend disegnando un pallino rosso per indicare un potenziale trend ribassista e un pallino verde per un potenziale trend rialzista. Come Funziona l'Indicatore L
FREE

free only until the end of the week
The following indicator must be used and contextualized according to your trading methodologies. It provides excellent trading insights and identifies rejection zones on the drawn lines. Several parameters can be customized. The indicator will plot three levels above and below the opening price on D1, W1, and MN1. It will provide the daily ADR and display two additional daily sessions (EUROPE session and USA session). The colors of the various lines can be cu
FREE

Economic Calendar Viewer
This economic events reader is adapted to load data from a csv file. You can prepare the csv file yourself according to this template, you can do it in notepad or csved. The file should normally be named Calendar-MM-DD-YYYY.csv. And contain lines with data column headers according to this example. In the Impact column, i.e. impact on the market depending on the importance of the event, the names accepted from the least important are: None, Low, Medium, High. In columns
FREE
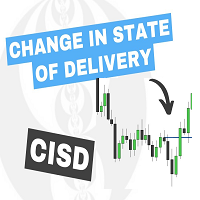
The Change In State Of Delivery (CISD) indicator detects and displays Change in State Of Delivery, a concept related to market structures.
Users can choose between two different CISD detection methods. Various filtering options are also included to filter out less significant CISDs.
USAGE Figure 2 A Change in State of Delivery (CISD) is a concept closely related to market structures, where price breaks a level of interest, confirming trends and their continuations from the resulting
A free program for copying orders between terminals on the same computer.
Any orders are copied in any direction, between any accounts.
The principle of operation:
On the terminal from which you want to copy, the "Server" parameter is set. On the terminal or terminals where the copied positions need to be opened, the "Client" parameter is set. It is also necessary to enter the account number of the "Server" terminal on the client.
In the future, it is planned to increase the functionality
FREE

Enhance your price action strategy: inside bar breakouts at your fingertips
This indicator detects inside bars of several ranges, making it very easy for price action traders to spot and act on inside bar breakouts. [ Installation Guide | Update Guide | Troubleshooting | FAQ | All Products ] Easy to use and understand Customizable color selections The indicator implements visual/mail/push/sound alerts The indicator does not repaint or backpaint An inside bar is a bar or series of bars which is/a
FREE

O EA "Surprising" é um robô inteligente que abre ordens em momentos estratégicos, sempre buscando lucro e segurança da conta. Pode ser usado em vários ativos, mas provou ser mais lucrativo em Ouro. O timeframe M5 ou M30 é muito bom para este robô. Se houver uma única ordem aberta, ele a fechará usando o trailing stop, buscando o melhor lucro. Se o preço se mover na direção oposta à ordem aberta, ele abrirá uma nova ordem do mesmo tipo na próxima zona de suporte ou resistência para compensar a o
FREE
ワンタッチ・チャートスイッチャー | 日々の分析を、もっと快適に
たくさんの通貨ペアや時間足をチェックするのは、トレーダーにとって日常的な作業です。しかし、チャートを一つひとつ手動で切り替えるのは、少し手間がかかるもの。 この「ワンタッチ・チャートスイッチャー」は、そんな日々のチャート分析を、少しだけ快適にするために開発されたMT4用インジケーターです。 チャート上に配置されたボタンをクリックするだけで、通貨ペアや時間足を素早く切り替え。分析のリズムを崩すことなく、スムーズに次の作業へ移ることができます。 主な機能 ワンクリックで素早く切り替え
チャート上に表示されたボタンをクリックするだけで、通貨ペアや時間足を瞬時に変更できます。分析の流れを止めません。 あなた好みに細かくカスタマイズ
表示したい通貨ペアや時間足のリストはもちろん、ボタンの色やサイズ、配置まで、ご自身の使いやすいように細かく設定可能です。 チャートを広く使える表示/非表示機能
ボタンが不要な時は、「Hide」ボタンで一時的に非表示にできます。必要な時だけ表示させることで、チャート画面をスッキリと保てます。 現在
FREE

3 strategies with RSI! Alerts! Signal freshness check! The indicator is based on the classic RSI. I recommend watching my advisor - Night Zen EA It includes 3 strategies: Entry of the RSI indicator into the overbought zone (for buy trades) / oversold (for sell trades) Exit of the RSI indicator from the overbought zone (for sell trades) / oversold (for buy trades) Touching the overbought limit (for sell trades) / oversold (for buy trades) The indicator provides alerts. To enable them in the s
FREE
Grid Assistant Pro – Utility for Managing Grid Strategies on MetaTrader 4
Grid Assistant Pro is a professional utility that helps traders manage and monitor unidirectional grid strategies directly from the MT4 chart.
It provides a visual dashboard , clear controls, and automated risk protection features for precise and efficient grid operation.
Key Features
Visual Dashboard
Real-time metrics: Balance, Equity, Floating P/L, Drawdown %, Free Margin Grid status: active and pending or
FREE

ATR Accelerator Indicator informs you about strong price movements based on the ATR Indicator. This Indicator works for all Timeframes and Symbols, the strength of movements can be configured.
Important: Get informed about new Products, join our MQL Channel: https://www.mql5.com/en/channels/etradro
Useage This Indicator works for all Timeframes and Symbols, the strength of movements can be configured. Features works on all timeframes and forex pairs or indices. Alert and Notify function i
FREE

Простой, но полезный индикатор для контроля волатильности при внутридневной торговле. Индикатор наносит на текущий график уровни средней волатильности (ATR) за указанное количество дней. На текущем торговом дне уровни динамические и перемещаются в зависимости от минимума и максимума цены текущего дня в режиме "реального времени". Во входных параметрах мы задаем: - количество дней для расчета и отрисовки уровней среднего АТР - цвет линий уровней среднего АТР - толщину линий уровней среднего АТР
FREE

This tools is design to easily forecast the projection of the current trend through the inputs of Zigzag and get out of the market when the trend do not the ability to maintain it's volatility to go further... the indicator gets the initial and final price from the value of zigzag automatically by adjusting the intdepth of zigzag. You can also switch from Projection to Extension from the inputs tab of indicator.
FREE

Intraday Setup Indicator uses Bollinger Bands as a main indicator to find a good setup filtered with candle stick pattern such as engulfing and pin bar. This is great tool for those who trade with Bollinger bands for entry or use it as a filter for trend. It is suggested to use a higher time frame when using this tool. There are many input setting for user to conveniently find a good probability setup.
FREE
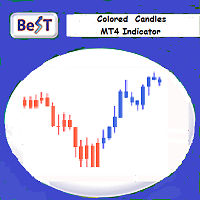
BeST_Colored Candles is an MT4 FREE indicator that can change the color of the Candlesticks based on the MACD, SAR or RSI values and levels. It is a Composite indicator that by selection uses the values each one of these 3 indicators and their critical levels in order to create numerical relationships that when satisfied cause their corresponding candlesticks coloration.
Input parameters
== Basic Settings
-- Please Select Indicator - for selecting which one of the above 3 indicators
FREE
MetaTraderマーケットは、開発者がトレーディングアプリを販売するシンプルで便利なサイトです。
プロダクトを投稿するのをお手伝いし、マーケットのためにプロダクト記載を準備する方法を説明します。マーケットのすべてのアプリは暗号化によって守られ、購入者のコンピュータでしか動作しません。違法なコピーは不可能です。
取引の機会を逃しています。
- 無料取引アプリ
- 8千を超えるシグナルをコピー
- 金融ニュースで金融マーケットを探索
新規登録
ログイン