YouTubeにあるマーケットチュートリアルビデオをご覧ください
ロボットや指標を購入する
仮想ホスティングで
EAを実行
EAを実行
ロボットや指標を購入前にテストする
マーケットで収入を得る
販売のためにプロダクトをプレゼンテーションする方法
MetaTrader 4のためのエキスパートアドバイザーとインディケータ - 49
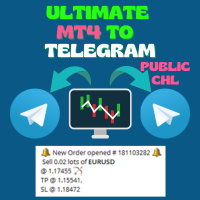
Ultimate MT4 to Telegram Public Channel sends controlled trades (via symbol, magic, comment) to a public telegram channel. It sends open and closed trades, including pending orders and TP/SL modifications, along with chart screenshots, to this public telegram channel. Additionally, you can send trade reports of open trades and summary profit/pip reports for day, week, or month. You can customize the design of the trade actions or reports with variables and emoticons.
A beautiful panel allows
FREE

この無料ツールが気に入っていただけましたら、ぜひ5つ星の評価をお願いします!本当にありがとうございます :) 「リスク管理アシスタント」エキスパートアドバイザーコレクションは、様々な市場環境においてリスクを効果的に管理することで、取引戦略を強化するために設計された包括的なツールスイートです。このコレクションは、平均化、スイッチング、ヘッジの3つの主要コンポーネントで構成されており、それぞれが異なる取引シナリオに合わせて独自のメリットを提供します。
このEAは、市場で標準的なリスク管理戦略を発展させたものです。
https://www.mql5.com/en/blogs/post/756961
1. 「平均化アシスタント」EA: MT4: https://www.mql5.com/en/market/product/115468 MT5: https://www.mql5.com/en/market/product/115469 2. 「スイッチングアシスタント」EA: MT4: https://www.mql5.com/en/market/product/115478 MT5:
FREE

DayTradeMaster: A Professional Tool for Daily Trading DayTradeMaster is a powerful Expert Advisor (EA) based on proven trading strategies and indicators to deliver precise buy and sell signals. This EA is the perfect tool for a day trading approach, enabling efficient utilization of market movements and maximizing profits. Key Features: Indicator Synergy: Combines RSI and MA indicators for trend analysis and signal generation. Multiple Candle Patterns: Supports Pin Bar, Morning Star, Engulfing,
FREE

SwingTradeMaster – a fully automated Expert Advisor based on classic Price Action and adaptive risk management.
The EA combines candlestick patterns (Pin Bar, Engulfing, Morning/Evening Star, Hammer) with RSI trend filters and ATR-based dynamic stop levels.
Transparent logic
Breakeven protection
Works on any pair and timeframe
Recommended for traders who want a professional, reliable and easy-to-use trading system. SwingTradeMaster is a fully automated Expert Advisor designed for swing and
FREE

Donchian通道(唐奇安通道指标)是用于交易突破的最古老、最简单的技术指标之一。 一般来说,唐奇安通道的宽度越宽,市场波动就越大,而唐奇安通道越窄,市场波动性也就越小 。此外,价格走势可以穿过布林带,但你看不到唐奇安通道的这种特征,因为其波段正在测量特定时期的最高价和最低价。 交易实用必备工具指标 波浪自动计算指标,通道趋势交易 完美的趋势-波浪自动计算通道计算 , MT4版本 完美的趋势-波浪自动计算通道计算 , MT5版本 本地跟单复制交易 Easy And Fast Copy , MT4版本 Easy And Fast Copy , MT5版本 本地跟单复制交易 模拟试用 Easy And Fast Copy , MT4 模拟账号运行 Easy And Fast Copy , MT5 模拟账号运行 唐奇安通道指标计算: 唐奇安上阻力线 - 由过去N天的当日最高价的最大值形成。 唐奇安下支撑线 - 由过去N天的当日最低价的最小值形成。 中心线 - (上线 + 下线)/ 2 唐奇安通道信号 唐奇安通道常用作突破指标。它提供了两种主要类型的突破信号,一个是上阻力线或下支撑线
FREE

The indicator helps to determine the potential for price movement within the day and on a trend. For calculations, the average price movement on the instrument is used. If you have a problem setting TP, the indicator allows you not to overestimate your expectations. For volatile instruments, the SL position can also be taken into account. If the entry was in the right place, the risk / reward ratio will prompt a profitable level for profit taking. There is a reset button at the bottom of the sc
FREE
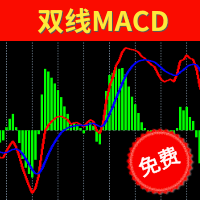
Two Lines MACD Many people who conduct technical transactions on MT4 like to use MACD to judge the turning or continuation of the market. When everyone uses the MACD indicator that comes with MT4, they find that the indicator is a single-line MACD, and the histogram seems to be similar to the past. The MACD that I understand does not match. In order to provide traders with a perfect trading experience, we especially provides free two-line MACD indicators for all traders! The single line in the
FREE

ColmexEA v2.03 представляет собой полностью автоматизированное торговое решение, сочетающее эффективную стратегию входа в рынок с продвинутым управлением рисками. Его баланс между защитой капитала и возможностью получения прибыли делает его подходящим как для новичков, так и для опытных трейдеров. Советник разработан с акцентом на долгосрочную стабильную работу и предлагает разумный компромисс между частотой торговли и качеством сигналов.
FREE

Moving indicator. It is written so that it doesn't signal when two moving averages cross. Easy to operate. It performed well on European and Asian currencies. Designed for long-term and medium-term types of trading. Индикатор мувингов. Написан так что даёт сигнал при пересечении двух скользящих. Прост в управлении. Хорошо себя показал на европейских и азиатских валютах. Рассчитан на долгосрочный тип торговли.
FREE
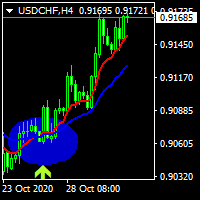
hi dear today i write an indicator of crossing 2 moving averages and show a label for the signals of it . .......................you can select the period of movings and the method of moving............... ......................and also method of apply price and see the movings and signals.................. ................also you can turn off showing movings to see just signal labels.......................... ................................................wish the best for you................
FREE

The "MACD Trend Follower" is an indicator based on the MACD oscillator. It serves to spot the trend direction by giving it a fixed color until the trend changes (the trend direction colors are customizable). The default MACD settings for the indicator has been changed to adapt to the fast moving Forex market, but they can be changed to suit the trader.
Recommended settings for the indicator : - MACD Fast EMA : 8 Periods. - MACD Slow EMA : 13 Periods. - MACD SMA : 5 Periods.
Indicator inputs :
FREE
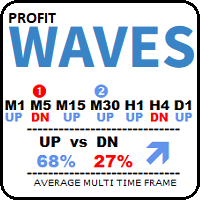
MT Rider — Multi Time-Frame Trend Indicator (Free Edition) Important Update for All MT Rider Users We have created an official community space , where all future improvements, upgrades, and additional tools will be released.
This includes: ️ upcoming upgraded versions of MT Rider
️ access to the MT4 OneClick trading panel
️ early previews of new tools
️ support and helpful resources
️ direct communication and announcements If you already have MT Rider downloaded here on MQL5, you are wa
FREE

Great dashboard for market analytics. Help you to analyze the values of the Moving Average indicator and prices.
Using this dashboard you can: find signals from the Moving Average from all timeframes; find signals from the Moving Average from all symbols; check - how far the Moving Average is from the price; check - the Moving Average value has changed; 2 types of signal.
Modes of operation (switched by a button on the graph): current value of Moving Average; the difference between the
FREE

THE_____ IIIREX_CLAW_vs_CLUSTER_EAIII______ Set1: Price Offset 100, Stopp Loss 100-1000, Take Profit 2000
Set2: Price Offset 200, Stopp Loss 100-1000, Take Profit 2000
Set3: Price Offset 100, Stopp Loss 100-1000, Take Profit 1000
Set4: Price Offset 200, Stopp Loss 100-1000, Take Profit 1000
Set5: PriceOffset 100-1000 (Recomment 200) higher is lower Risk, Stopp Loss 500 Take Profit 1000, 2000, or 3000 it is the same Target
Set it to your Moneymanagement
Indize: DE40
“IC Market” Recomment
FREE

This indicator includes various types of moving averages. The indicator contains the following set of moving averages: CA (Cumulative Moving Average) MIN (Minimum for the period) MAX (Maximum for the period) SMA (Simple Moving Average) EMA (Exponential Moving Average) DMA (Double exponential moving average) TMA (Triple exponential moving average) LWMA (Linear Weighted Moving Average) SMM (Simple Moving Median) SMMA (Smoothed Moving Average) HMA (Hull Moving Average) NoLagMa The list of moving av
FREE

Double Exponential Moving Average (DEMA) is a well-known trend indicator. DEMA was developed by Patrick Mulloy and published in February 1994 in the "Technical Analysis of Stocks & Commodities" magazine. It is used for smoothing price series and is applied directly on a price chart of a financial security. Besides, it can be used for smoothing values of other indicators. The advantage of this indicator is that it eliminates false signals at the saw-toothed price movement and allows saving a posi
FREE

The Flag Streamer Pattern indicator is an indicator designed to find flag and pennant patterns. When the legend finds patterns, it draws lines on the graph screen. Magenta lines represent the streamer pattern. Aqua colored patterns represent the flag pattern. You can change the pattern colors according to your request. Our Popular Products Super Oscillator HC Cross Signal Super Cross Trend Strong Trend Super Signal Parameters fs- =======Channel Trend Setting===== Channel - Channel period setting
FREE
A free program for copying orders between terminals on the same computer.
Any orders are copied in any direction, between any accounts.
The principle of operation:
On the terminal from which you want to copy, the "Server" parameter is set. On the terminal or terminals where the copied positions need to be opened, the "Client" parameter is set. It is also necessary to enter the account number of the "Server" terminal on the client.
In the future, it is planned to increase the functionality
FREE

SwingTrade Candle Patterns EA uses Pin Bar, Engulfing, Morning/Evening Star and Hammer patterns with RSI confirmation and ATR-based money management. Stable swing trading with low drawdown and steady profit growth. Valid for Prop Firms. Strategy Recognizes Pin Bar, Engulfing, Morning/Evening Star, Hammer candlestick patterns. Confirms trades with RSI trend filter . Uses ATR-based Stop Loss and Take Profit → adapts to volatility. Built-in breakeven system to protect profits. No martingale, no
FREE

Stop Guessing, Start Sniping: Introducing SR Sniper! Tired of entry points that seem random? The SR Sniper indicator is your new essential tool for finding high-probability trades with surgical precision. It's designed to cut through the market noise, giving you clear Buy and Sell signals right at the most critical price zones. This powerful indicator combines the dynamic analysis of the Commodity Channel Index (CCI) with automatic Support and Resistance (S/R) detection —and then filters everyt
FREE

This version of the indicator works only in the tick data stream. In this way, we only see the current situation from the moment of launch. I recommend using the classic version Real-Time Currency Valuation . The indicator calculates currency strength of eight major and also can calculate strength of any other currency, metal or CFD.
Main Features It is able to display only the currencies that are currently necessary, thus not overloading you with unnecessary information and notifications. It
FREE

It's demo version of Auto StopLoss Defender , you can buy on page - https://www.mql5.com/ru/market/product/33112 or extended version of the program is Auto StopLoss Premium , you can set stoploss and takeprofit - https://www.mql5.com/ru/market/product/33113
Demo restrictions: Stop-loss reset to 0.10% for new order.
While you are trading, Auto StopLoss Defender doing all the routine work. "Must have" for scalping. Best way to save account balance in case of force majeure.(Internet connec
FREE

Free informative Indicator-helper. It'll be usefull for traders who trade many symbols or using grid systems (Averaging or Martingale). Indicator counts drawdown as percent and currency separate. It has a number of settings: Count deposite drawdown according equity value and send e-mail or notifications to user if DD more than set; Sending e-mail when max open orders reached; Shows price and remaining pips amount before MarginCall on current chart and Account generally; Display summary trade lot
FREE

Buy 1 Get 1 Free
Key Benefits of Using Auto TPSL (Take Profit / Stop Loss) "Auto TPSL" is an Expert Advisor (EA) designed to automatically manage Take Profit (TP) and Stop Loss (SL) for your orders in MetaTrader. This offers significant advantages for traders: Saves Time and Reduces Workload: You don't need to manually set TP/SL for every order. The EA will handle it automatically as soon as an order is opened. Consistency in Risk Management: Helps you maintain discipline in setting profit tar
FREE
An Expert Advisor based on the 3 candlestick pattern.
1-SL, 2-TP, 3-OFF - 1 pulls up StopLoss. 2 pulls up TakeProfit. 3-disabled.
auto SL / TP on hi-low count bars - number of bars for 1-SL, 2-TP expiration on profit - after passing N bars, TP changes
expiration on loss - after N bars have passed SL to open an order + commission pips for loss expiration - the number of points for expiration on profit
The rest of the settings are intuitive.
FREE
Simple and unobtrusive utility for displaying weeks, days and hours
Options to control the display of separator lines and labels allow you to customize them to your own taste Display of the separator lines either only in the main chart, or across any indicator windows Automatically reduce intensity of less relevant separator lines and labels for the chart‘s current magnification
FREE

Function Indicate Buy Sell Signals Indicate Strength of Buy Sell Signals This system is for both type of traders (Short & Long Term) Instead of Other Calculations, Parabolic Sar & Awesome are also used In Any time frame this can be use. What is in for Trader? Trading Switch: Short Term & Long Term Finally, we all knows that Forex Trading needs completely concentrate & proper cash management, So I never promising that my program will never give you loss but I tried well to provide good and respo
FREE

Wicks UpDown Target GJ
Wicks UpDown Target GJ is specialized in GJ forex pairs.
Choppy movement up and down on the opening range every day. Trading breakouts on London session and New York session is recommended.
Guideline Entry Strategy Idea:
Step 1 - Breakout Forming (Warning! Trade on London Session and New York Session) Step 2 - Breakout Starting (Take Action on your trading plan) Step 3 - Partial Close your order & set breakeven (no-risk) Step 4 - Target complete Step 5 - Don't trade
FREE

Dominate the Market with CCI Crossover Master! Stop guessing and start trading with confidence ! The CCI Crossover Master indicator is your secret weapon for capturing high-probability moves based on proven momentum and trend analysis. It simplifies the complex " CCI Crossover Master " strategy, giving you crystal-clear Buy and Sell signals directly on your chart. Key Advantages That Drive Your Success: Precision Entry Signals: Never miss a high-potential trade again. The indicator generates sh
FREE

Harrow Order is an Expert Advisor (EA) that works based on Support and Resistance, Martingale and Anti-Martingale methods. Support and Resistance is used to indicate the best position to place orders. Martingale is used to fix unprofitable orders. And Anti-Martingale is used for increasing potential profitable orders. This EA runs with two basic steps, namely try and execute. First, it will send one initial order to find out the market conditions at a nearest Support or Resistance level. Second,
FREE

Unlock your trading potential with Momentum Master , the smart indicator designed to help you navigate the markets with confidence. This powerful tool provides clear, actionable signals by combining the strengths of multiple proven indicators. Say goodbye to guesswork and hello to precision trading. Momentum Master is more than just a signal provider; it's your personal market analyst. It uses a unique combination of Moving Averages (EMA 34 & 55) to identify the trend, MACD for trade confirmatio
FREE

If an Expert Advisor cannot make profit on any instrument or any timeframe, it is a bad Expert Advisor. This algorithm used the regularities inherent to any market. You can adjust this EA for working on virtually any instrument, or even on all of them at once, it all depends on your trading style. The algorithm determines the reversal points with a certain probability based on the statistical data. The market is considered to be a random process. A random process has a normal distribution of pro
FREE

ATR Pyramid ️: ステロイド注射されたジェンガの塔よりも高く利益を積み上げるチケット 、市場のボラティリティをトレンドサーフィン ️とポジション追加パーティー に変える、最初のトレードだけが大損のリスクがある中 、残りはストップロスをエレベーターのように上げて守り 、エスプレッソを飲んだウサギより速くあなたのフォレックス口座を増やす唯一の本当の方法となる快適ゾーンを作り出す!!! 利益積み上げ屋とトレンドサーファーの皆さん、注目! ️ この ATR Pyramid インジケーターは、金融ピラミッドを構築するのが好きな方々のためのものです(合法的なものだと約束します )。 ATRは市場のボラティリティしか示さないって言われてるの知ってる? でも、どんでん返し - それが全てじゃないんだ! この賢い小さなツールは、カフェイン中毒のブラッドハウンドより速くトレンドの方向を嗅ぎ分けられるんだ。 そして何を思う? 食べ放題バイキングのように、これを使って利益を積み上げているんだ。 ️ でも、まだあ
FREE

RRS Impulse Plus EA is an advanced version of RRS Impulse EA . This upgraded version provides more flexibility with several new options. The EA scalps using the Relative Strength Index (RSI), Stochastic Oscillator, Moving Average (MA), and Bollinger Bands indicators to identify trend and counter-trend opportunities. As a multi-pair EA , it scans multiple currency pairs for signals. This EA includes various features such as Trailing, Risk Management, Money Management, Restriction Mode, and more.
FREE

Mathematician EA MQLSquare is not just another trading tool; it's a high-end solution designed to empower traders with exceptional precision and unwavering confidence in the dynamic world of financial markets. Armed with advanced algorithms and mathematical models, this cutting-edge software provides traders, both seasoned professionals and newcomers, with a formidable edge to make informed decisions and optimize their trading strategies. Key Features: Tested and Proven: Mathematician EA has
FREE

ChannelRSI4 買われ過ぎと売られ過ぎのゾーンの動的レベルを示す相対力指数(RSI)指標。
動的レベルは変化し、インジケーターと価格の現在の変化に合わせて調整され、一種のチャネルを表します。
インジケーターの設定 period_RSI-RSIインデックスを計算するための平均期間。 apply_RSI-適用価格。価格定数のいずれかです。PRICE_CLOSE-終値、PRICE_OPEN-始値、PRICE_HIGH-期間の最高価格、PRICE_LOW-期間の最低価格、PRICE_MEDIAN-中央価格(高値+安値) / 2、PRICE_TYPICAL-通常価格(高値+安値+終値)/ 3、PRICE_WEIGHTED-加重平均価格、(高値+安値+終値+終値)/ 4。
period_channel-買われ過ぎゾーンと売られ過ぎゾーンの動的チャネルの計算期間。
FREE
T3 2Lines – ダブルラインで捉えるトレンドの精度 「T3 2Lines」は、T3(Triple Exponential Moving Average)をベースにした2本の移動平均ラインを表示するMT4インジケーターです。短期および長期のT3ラインを同時に描画することで、トレンドの転換点や持続性をより精緻に判断することが可能になります。 このインジケーターでできること 短期と長期、2種類のT3移動平均線をチャートに同時表示 各ラインの期間と平滑係数(smoothing factor)を個別に設定可能 トレンドの初動や継続判断、押し目・戻りの識別に活用 視認性の高いライン表示で裁量トレードの補助に最適 T3とは? T3(Triple Exponential Moving Average)は、一般的な移動平均(SMAやEMA)よりも滑らかなカーブを描くのが特徴です。従来の移動平均に比べてノイズが少なく、トレンドの本質をより明確に視覚化することができます。「T3 2Lines」では、このT3を短期・長期で重ねることで、より多角的な相場分析が可能になります。 主な用途と活用シナリオ ク
FREE
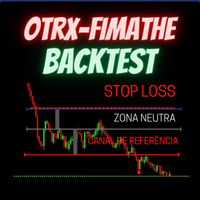
OTRX Fimathe Backtest is a tool for the Trader or Enthusiast who uses the Fimathe technique created by Trader Marcelo Ferreira to carry out his training and validate if he can obtain profitability.
In this tool you will be able to:
1. Define whether you are looking for a buy or sell entry. (Trend).
2. Define by clicking twice on the horizontal lines where your Reference Zone and your Neutral Zone will be.
3. Monitor the entry, subcycle and exit of the trade.
4. Trading Summary, Daily, Week
FREE

Trading History - The best visual indicator of trade history.
Shows closed and current deals on the chart.
Closed deals are shown with a solid line, current ones - with a dotted line.
Positive trades are displayed in aqua color, negative ones - in red color .
The panel displays the number of closed and current pips and their profit. The indicator is perfect for trading analysis.
FREE
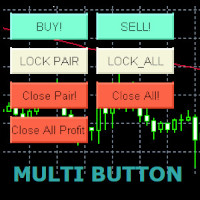
Use this multifunction button to execute orders instantly! Several buttons will handle:
1. BUY: Open a BUY order with preferred size (configurable in Expert config). 2. SELL: Open a SELL order with preferred size (configurable in Expert config). 3. LOCK PAIR: Open an order with the same lot to LOCK your order position, based on the currently opened chart (current pair). 4. LOCK ALL: Open an order with the same lot to LOCK your order position, based on all your open positions (all pairs). 5. Cl
FREE

Индикатор "Trend zone" Помощник трейдеру, показывает на графике текущую тенденцию. Он надеюсь станет незаменимым индикатором в ваше трейдинге. Индикатор не перерисовывается и не меняет свои значения про переключение временных периодов The "Trend zone" indicator is a trader's assistant, shows the current trend on the chart. I hope it will become an indispensable indicator in your trading. The indicator does not redraw and does not change its values about switching time periods
FREE

This indicator integrates the Bollinger Band strategy in calculation with a volume-over-MA
calculation to further narrow down "Areas of Interest" levels for a potential re-test zone to the right of the chart.
We added a Moving Average calculation for a multi-level cloud and further broke down more conditions to highlight both
volume flow crossover on the High and Extreme High MA's and also high and extreme high volume spikes on set period average
without bull\bear conditions. Original Bull/Bear
FREE

Uses of EA - Trailingstop: Move stoploss continuously. - Breakeven: Move the stoploss once. Custom parameters: All OrderOpenTime: + true: acts on all order + false: only affect the order opened since EA run All OrderType: + true: acts on all order. + false: only the order is running (Buy, Sell) TraillingStop: true (Use), false (do not use) TrailingStop Save (Point) TraililngStop Distance (Point) BreakEven: true (Use), false (do not use) BreakEven Save (Point) Brea
FREE

The Profitunity version of Bill Williams in my vision The EA works according to standard indicators: Aligator + AO + Fractals To move into a deal, a pin bar is also used at a distance of N points from the Aligator (Distance Pin from Alig). To exit positions, there is TP, SL, several Trailling options, closing all orders by the total profit. NOT GRAIL but it works! The Profitunity version of Bill Williams in my vision.
What about the settings of the advisor and how it works. Fix Lot - fixed lot
FREE
Constructor is a convenient tool for creating, (building strategies) testing and applying trading strategies and ideas, as well as testing and using separate indicators and their groups.
Constructor includes opening, closing, deal tracking, averaging and recovery modules, as well as various trading options with and without averaging and martingale. You are able to connect up to 10 different external indicators. Find the detailed instructions in the attached pdf file.
Trading settings
averaging
FREE

This indicator is based on the ADX indicator and indicates the trend very easily.
You can customize the indicator to your needs: ADXPeriod ADXSignal_Level BarWidth CandleWith HeikenAshi
The Adx color candles indicator is fully FREE and compatible with the other part of the system; the Acc arrow >>>> https://www.mql5.com/en/market/product/33770 ENJOY and check out my other indicator: https://www.mql5.com/en/market/product/32111
FREE

サキュバスは、ユニバーサルexpert Advisorです。
その主な利点は、最高のエントリ精度、トランザクションの90%以上です。
Expert Advisorパラメーターは、ユーザーが必要とする機能に応じてカテゴリに分けられます。 すべての機能を無効にできます。
Expert Advisorは、中小規模の預金を分散させるように設計されています。
メイン:
TakeProfit-利益を持つ取引を閉じるためのポイントの数
StopLoss-損失を伴う取引を終了するポイントの数
スリッページ-スリッページ
マジックアドバイザー ID
ロット-トランザクション量
動的ロット設定:
ダイナミック-を有効/無効にした動的計算の取引量
リスク-リスク係数。
ブロック、マーティン-ゲイル、クラシック。 一つだけの貿易は、各方向のために、一度に開くことができます。 損失が発生した場合、次の取引はボリューム乗数で行われます。
Martin-マーチンゲールを有効/無効にします
Multiplierマーティン-ロット乗数
Succubus expert Advisorはグ
FREE
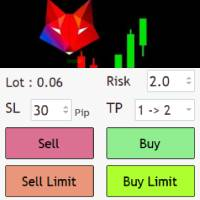
Risk management settings Automatic lot size calculation based on risk Open Buy and Sell positions with one click based on settings Open positions graphically (Buy Limit – Buy Stop – Sell Limit – Sell Stop) Real-time display of open positions' profit/loss and daily profit/loss Completely free You are welcome to explore and purchase from our other products as well. Please feel free to take a look and let us know if you have any questions.
FREE

Traditional RSI is one of the most popular and must-known indicator that every traders would use. In this combination, we use two RSI period with smoothed factor to smooth the RSI lines for better results. Besides, bottom of Indicator is the Trend-filter display in different colors in order to let Traders identify the trends much easier Grey : Sideway market Light-Blue : Weak UP-Trend Blue : Strong UP-Trend Light-Red : Weak DOWN-Trend Red : Strong DOWN-Trend Signal: Blue-Arrow
FREE
製品説明: BBMA Dashboard Guide BBMA Dashboard Guide は、BBMA に基づいたインジケーターで、 MN1 から M1 までのすべてのタイムフレームにわたる マーケット構造 を、ひとつのシンプルで直感的なダッシュボードで確認できるように設計されています。 このツールを使えば、複数のチャートを切り替える必要はありません。重要な情報はすべて 一目で分かるダッシュボード に表示されます。 主な機能: マルチタイムフレーム構造
月足から1分足まで、BBMA 分析を瞬時に表示し、長期トレンドと短期の値動きを同時に把握可能。 ポテンシャルペアオプション
あなたのトレードスタイルに合わせて市場のチャンスを分析: スイングトレード → 中期取引。 デイトレード → 日中取引。 スキャルピング → 短期ターゲットで素早いエントリー。 Fibo Musang ツール
柔軟なフィボナッチ Musang を搭載: 縦型と横型のスタイル に対応。 エントリーゾーンや利益目標をより正確に決定。 ️ カスタムペアセレクター
ダッシュボード

Prop Trader's Guardian: The Ultimate Risk Manager
(Product for MetaTrader 4)
Protect your capital and secure your funded account with the Prop Trader's Guardian. This is not just another drawdown checker; it's an account-level circuit breaker designed specifically for the strict rules of proprietary trading firms. When your daily limit is hit, it doesn't just close trades—it locks down your entire terminal to prevent any further activity until the next trading day.
The Prop Firm Trader's Dil

Wikirobo をご紹介 — すべての時間足に対応したスマートなエントリ―ゾーンインジケーター
Wikirobo は、すべての時間足上で Buy Limit(買い指値) と Sell Limit(売り指値) の形でエントリーポイントを自動的に表示します。
価格が提案されたエリアに達するまで待ち、そこから反応または反転するかを観察し、ご自身のストラテジーに基づいてエントリーできます。
各時間足には対応する ストップロス(Stop Loss) がチャート上に表示され、リスク管理とポジションサイズ管理を容易にします。
スキャルパー、デイトレーダー、スイングトレーダーすべてに対応でき、取引スタイルを問わず柔軟に使えます。
Wikirobo を使うには、 Telegram チャンネルに参加 して、最新のデータファイルをダウンロードしてください:
@wikirobo
インジケーターが導く — でも最終判断はあなたのストラテジーで。
Wikirobo:スマートなシグナル。よりスマートなトレーダー。
FREE

The Expert Advisor tool has been developed for NQ (Nasdaq), based on break logic and trend filter. The stop loss is based on fixed pips. It has been backtested on more than 10-year long on M1 data with high quality of modeling. The enclosed screenshots demonstrate the complexity and coverage of the test by Monte Carlo analysis with 200 simulations. The Expert Advisor passed via Cluster Analysis, Optimization profile, System parameter Permutation . There is no need to set up parameters - al
FREE

Risk Panel Pro (MT4) Risk Panel Pro is a Tool for MetaTrader 4 that automates placing Stop Loss and Take Profit based on a percentage of the account balance. It is a trade management utility; it does not provide trading signals and does not guarantee any profit. Main functions Auto-apply SL/TP on new orders using balance-based risk (default: SL 2%, TP 4%). Switch Automatic mode off to manage SL/TP manually. One-click buttons to apply SL or TP to existing positions at any time. Close Chart : clo
FREE

Product Title Clean Fractal Pro — RSI Fractal Bias Indicator: Precision Signals with H4 Edge Unlock high-probability trades on M30 charts with this non-repainting powerhouse . It combines: H4 RSI Bias (>50 for bullish, <50 for bearish) to filter major trends. 20-period SMA (Typical Price) for dynamic support/resistance. M30 RSI Momentum (above 40 for buys, below 60 for sells) to time entries. Fractal Confirmation (lower fractal for buys, upper for sells) on closed bars for rock-solid, lag-fre
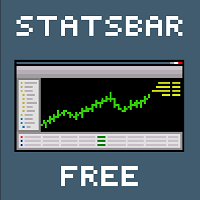
StatBar 1.6 Indicator showing balance, earnings for today, yesterday and the day before yesterday. The indicator also shows: - Server; - GMT; - Server time; - Shoulder; - Spread.
Description of variables: extern int Magic = "-1"; // Magic for statistics -1 = all 0 = manual extern string Symboll = "-1"; // Symbol for statistics -1 = all 0 = current EURUSD = for EURUSD
FREE

This indicator smoothes the value of CCI (Commodity Channel Index) and reduces its volatility. By using this indicator, the fluctuations created by the CCI indicator are reduced. The smoothed CCI value is placed in a buffer that you can use in your EA and strategy. Leave me a comment if you want By using this indicator, you no longer need to use the Moving Average indicator on the CCI indicator.
FREE

精密な取引分析を指先で:次世代取引分析ソフトウェア 市場に出回っている一般的な取引分析ソフトウェアは、時間別または週別の損益率統計のみを提供することが多く、より正確な取引分析のニーズを満たしていません。しかし、実際の取引市場では、毎日が独自の状況を呈しています。月曜日は静かで、水曜日は3倍のオーバーナイト金利で活発になり、金曜日は重要なデータ発表で非常に活発になります。明らかに、毎日統計分析を行うことは科学的ではなく、週単位で分析する方が理にかなっています。しかし、週足チャートは各日の統計的な状況のみを示しており、時間ごとの変化を捉えることができません。さらに、特定の銘柄は、ロングポジションとショートポジションで大きな違いを示すため、個別の分析が必要ですが、これは現在の取引分析ソフトウェアには欠けています。
時間単位が粗すぎることに加えて、既存の取引分析ソフトウェアは、戦略のフィルタリングの点でも不足しています。銘柄名のみでフィルタリングを行うことは、1つの銘柄で複数の戦略が同時に実行されている可能性があるため、科学的ではありません。同様に、マジックナンバーのみを頼りにフィルタリン
FREE

Synchronize objects from one chart to multiple charts. Synchronize objects from one chart to multiple charts. 1. Allows automatic synchronization of new and edited objects to other charts. 2. Allows synchronization of all objects on the chart to other charts at the current time. 3. Allows setting the charts to synchronize based on the position of the chart in the MT4 window. Version 1.2: Allow set list of object names that you don't want to sync (Separated by commas ",")
Allow set 5 types of o
FREE
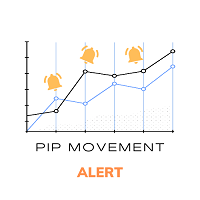
Pip Movement Alert MT4で市場のモメンタムを先取りしましょう。この多通貨対応の汎用インジケーターは、複数のシンボルにおける正確なピップの動きを追跡し、トレーダーにアラートを提供するために設計されており、外国為替、株式、暗号通貨、商品取引に最適です。Forex FactoryやRedditのr/Forexなどのトレーディングコミュニティで称賛され、InvestopediaやTradingViewの議論でも急激な市場変動を検出する能力で注目されており、価格の急激な変動を活用しようとするトレーダーにとって必須のツールです。ユーザーは、ピップベースの重要な動き(例:10ピップ単位)を最大95%の信頼性で特定し、リアルタイムアラートを活用してボラティリティの急上昇を捉えることで、取引タイミングが20-30%改善したと報告しています。主な利点には、多通貨モニタリング、カスタマイズ可能なピップ閾値、チャートを常に分析せずに追跡を簡素化する軽量デザインが含まれ、スカルパー、デイトレーダー、スイングトレーダーに最適です。 Pip Movement Alert MT4は、ユーザー定義の
FREE

Diversify the risk in your trading account by combining our Expert Advisors. Build your own custom trading system here: Simple Forex Trading Strategies
The expert advisor opens trades when EMAs cross and the Average Directional Index is above 25. The Stop Loss, Take Profit, and Trailing Stop are calculated based on the ATR indicator. The recommended currency pair is GBPAUD. The recommended timeframe to operate and to do backtests is D1. This Expert Advisor can be profitable in any TimeFrame
FREE
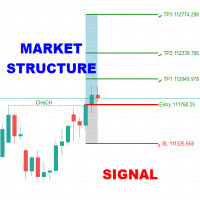
The Market Structure Signal indicator is designed to detect Change of Character (CHoCH) and Break of Structure (BOS) in price action, helping traders identify potential trend reversals or continuations. It combines market structure analysis with volatility (ATR) to highlight possible risk/reward zones, while also supporting multi-channel alerts so that no trading signal is missed. Interpretation Trend Analysis : The indicator’s trend coloring, combined with BOS and CHoCH detection, provide
Bar Timer Percent インジケーターは、現在のバーの形成時間をパーセンテージで示します。
インジケーターの設定 color_back1-背景色#1 color_flat1-背景#1の境界線の色 color_back2-背景色#2 Alert_Percent-サウンドアラートのパーセンテージ値 Sound_file-サウンドファイルの名前。カスタムサウンドファイルは、Soundフォルダーの下のターミナルフォルダーにあり、拡張子は-.wavである必要があります。 Bar Timer Percent インジケーターは、現在のバーの形成時間をパーセンテージで示します。
インジケーターの設定 color_back1-背景色#1 color_flat1-背景#1の境界線の色 color_back2-背景色#2 Alert_Percent-サウンドアラートのパーセンテージ値 Sound_file-サウンドファイルの名前。カスタムサウンドファイルは、Soundフォルダーの下のターミナルフォルダーにあり、拡張子は-.wavである必要があります。
FREE

This indicator calculates and draws lines over the chart. There are two types of trends: Trend A: the line is drawn using local lows for uptrends and local highs for downtrends Trend B: the line is drawn using local highs for uptrends and local lows for downtrends There are a few conditions, which have to be fulfilled and can be changed by the parameters (see also picture 4): MinBarAge : the count of bars to the last base point of a line is called BarAge and has to be greater than the parameter
FREE
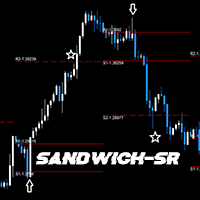
GENERAL DESCRIPTION
Simple SR Projection based on selected instrument's historical data. Best used in conjunction with current market sentiment, and fundamental analysis. Currently limited to selected pairs due to of historical data to project accurate levels.
Generally, for support and resistance, 2 levels are drawn, respectively. The inner levels (R1,S1) project the highs and lows during the opening stages of selected time frame. The outer levels, represent the targets to reach during the clo
FREE
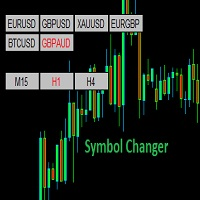
Symbol Changer (Custom) Indicator
This is a simple yet intuitive indicator. And its free.
The indicator provide easy navigation across various symbols and across different time frames all in a chart.
The buttons are displayed on the main chart.
It is flexible and easy to use with fast response speed.
FEATURES
UniqueID : This identifies the pairs for each chart
Use Custom Pairs : If set to true, load all the available symbols in the Market Watch. No means it loads the pairs selected be
FREE
Introduzione
L’indicatore Grid Option Strike è progettato per MetaTrader 4 e si basa sui livelli di strike delle opzioni sui future , fornendo una struttura chiara dei movimenti del prezzo su coppie di valute come EUR/USD, GBP/USD e AUD/USD . Questo strumento aiuta i trader a identificare aree di supporto e resistenza dinamiche basate sugli intervalli di 25 pip e 50 pip , frequentemente utilizzati dai trader istituzionali e nei mercati delle opzioni.
Lascia un commento per potere migliorare l'
FREE

Choose your desired lot size and profit target, and watch the magic happen !
Introducing the Trend Follower EA , your ultimate trend-tracking trading assistant. This intelligent algorithm tirelessly follows market trends and trades in the chosen direction until your profit target in dollars is met.
Additionally, we offer a unique "Single Cycle" option. When activated ( strongly recommended ), the EA automatically removes itself from your chart after reaching its profit goal. It patiently waits
FREE

This simple indicator paints with a darker color on the volume bar when the quantity traded is above the average of select number of periods of the volume itself, highlighting the moments when there was a large volume of deals above the average. It is also possible to use a configuration of four colors where the color tone shows a candle volume strength. The indicator defaults to the simple average of 20 periods, but it is possible to change to other types of averages and periods. If you like t
FREE
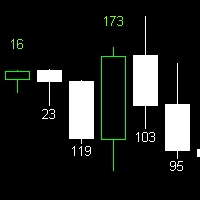
Candle Size Indicator Explore the candle size using this convenient indicator. It works across various timeframes, providing valuable insights for technical analysis. Key Features: Display the size of the candle after configuring the indicator. Compatible with all timeframes. The size of the candle is a significant metric in technical analysis, offering insights into market strength and volatility. This indicator enables clear and accurate visualization of candle sizes on your chart. Utilize thi
FREE
MetaTraderマーケットは自動売買ロボットとテクニカル指標を販売するための最もいい場所です。
魅力的なデザインと説明を備えたMetaTraderプラットフォーム用アプリを開発するだけでいいのです。マーケットでプロダクトをパブリッシュして何百万ものMetaTraderユーザーに提供する方法をご覧ください。
取引の機会を逃しています。
- 無料取引アプリ
- 8千を超えるシグナルをコピー
- 金融ニュースで金融マーケットを探索
新規登録
ログイン