YouTubeにあるマーケットチュートリアルビデオをご覧ください
ロボットや指標を購入する
仮想ホスティングで
EAを実行
EAを実行
ロボットや指標を購入前にテストする
マーケットで収入を得る
販売のためにプロダクトをプレゼンテーションする方法
MetaTrader 4のためのエキスパートアドバイザーとインディケータ - 50

The automatic advisor works according to a simple strategy for the breakout of the previous day's high and low. In the settings there is a function to reverse orders Reverse, when the maximum is broken, instead of buying, a sell will be opened, and when the minimum is broken, instead of selling, a buy will be opened. Real monitoring https://www.mql5.com/en/signals/833080
Settings Reverse - when the level is broken, orders will be opened in the opposite direction The maximum number of limit o
FREE

This simple indicator paints with a darker color on the volume bar when the quantity traded is above the average of select number of periods of the volume itself, highlighting the moments when there was a large volume of deals above the average. It is also possible to use a configuration of four colors where the color tone shows a candle volume strength. The indicator defaults to the simple average of 20 periods, but it is possible to change to other types of averages and periods. If you like t
FREE
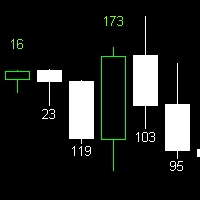
Candle Size Indicator Explore the candle size using this convenient indicator. It works across various timeframes, providing valuable insights for technical analysis. Key Features: Display the size of the candle after configuring the indicator. Compatible with all timeframes. The size of the candle is a significant metric in technical analysis, offering insights into market strength and volatility. This indicator enables clear and accurate visualization of candle sizes on your chart. Utilize thi
FREE

The indicator displays crossing zero level by Moving Average of Oscillator (OsMA) in the form of arrows. The indicator notifies about a signal by means of a pop-up Alert window, or sending notification to e-mail.
Parameters Fast EMA Period - fast EMA. This is an exponential moving average from a price with a short period. Slow EMA Period - slow EMA. This is also an exponential moving average of a market price but with a longer period. Signal SMA Period - MACD SMA. This is a signal line which is
FREE

保有ポジション/指値注文の一括SL/TP設定とキャンセルクローズ機能と含み益でのトレインリグストップ機能を持ったEAです。 [ポジション操作] -SL入力ボックス :SL値を価格で入力して左横の「SL」ラベルをクリックすると一括でSL設定が適用されます。 - TP入力ボックス :TP値を価格で 入力して左横の「TP」ラベルをクリックすると 一括でTP設定が適用されます。 - Pending :右側のボタンがTrueの時に指値注文への一括SL/TP設定がされます。Falseの時は指値注文へは一括SL/TP設定はされません。 - Open :右側のボタンがTrueの時にオープンポジションへの一括SL/TP設定がされます。オープンポジションへは 一括SL/TP設定はされません。 - ClosePending :現在の指値注文を一括でキャンセルします。 - CloseOpen :現在のオープンポジションを一括で決済します。
-補足- 設定したSL/TPをキャンセルするには、キャンセルしたい方(SL or TP)の入力ボックスに0を入力して左横の「SL」or「TP」ラベルをクリックするとキャン
FREE

Overview No Nonsense ATR is a tool designed to help the No Nonsense Forex Traders backtest strategies and trading in real time.
The indicator calculates the value of the Stop Loss and the Take Profit (SL/TP) based on the ATR (Average True Range) allowing to verify the historical data in a simple and practical way, showing not only the SL/TP values but also the place where they would be and if it was a gain or loss. The No Nonsense ATR also calculates the trading volume required for each trade a
FREE

Simple Trading System Update !!! Follow this link to see our 2024 Strategy !!! ( Download the EAs scanner )
INTRODUCTION : The strength meter is an trading tool that is used to identify trending and consolidating markets based on the percentage rate.
HOW TO USE IT :
You can use this indicator with Deal Trading Trend >> Click Here << To use this trading tool to identify trending and consolidating markets (the most important part)
FREE
BackTester FX — симулятор ручной торговли MetaTrader 4 .
Позволяет моделировать рыночные условия на исторических данных в тестере стратегий, вручную открывать и закрывать сделки, анализировать торговые стратегии без рисков потерять. Ключевые возможности Эмуляция ручной торговли в визуальном тестере стратегий Совместимость с любыми инструментами и таймфреймами Быстрое управление ордерами (открытие/закрытие) Настройки объема сделки, Stop Loss, Take Profit Работает как в тестере стратегий так и на
FREE

FTU カラス mt4 プラットフォーム用のインジケーター。取引のみに使用でき、他のインジケーターと組み合わせるのが最適です。 macd、adxなどのさまざまなインジケーターを使用して開発され、エントリーやトレンドの変化を示唆する矢印を描画します このインジケーターは FTU Idioteque に似ています。FTU Predictor などの他のインジケーターを参照してください。 YouTube で短い紹介ビデオをご覧ください: https://youtu.be/n_nBa1AFG0I 特徴: 矢印の販売と購入 視覚と音による警告 トレンド継続 / 早期トレンド転換シグナル 新機能: 履歴内のバーの数を制限する バーから矢印までの距離を変更する 使用法: このインジケーターは、ほとんどの資産グループ、外国為替、商品、指数、暗号通貨で使用できます。 すべてのタイムフレーム、再描画なし、高速読み込み 私の FTU Predictor と組み合わせると、確実に優位性が得られます。 いくつかのアドバイス: 資金管理と規律が鍵であり、単一の戦略や指標が成功をもたらすことはありません。損失は発
FREE

Unleash Your Trading Potential with Momentum Strength Signal! Tired of lagging indicators and confusing market noise? Momentum Strength Signal is the cutting-edge tool built to give you a decisive edge by focusing on what truly drives prices: pure market force . This isn't just another average indicator; it's a dynamic system that identifies the exact moment a trend begins and confirms its validity, helping you enter and exit trades with confidence. Why You Need This Powerhouse Indicator: Preci
FREE

Sweeper PRO – Advanced Candle Sweep Detector (3-in-1) For any questions, technical issues, or support requests, feel free to contact us through any of the following channels: WhatsApp Support: Contact1 Contact2 Email:
Money.transporter@gmail.com Overview Sweeper PRO is a powerful and fully customizable indicator designed to detect three unique types of candle sweeps — smart entry and reversal patterns commonly used by professional price action traders.
It automatically identifies po
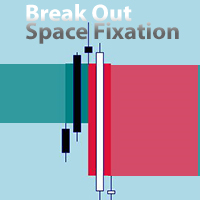
An EA version is being prepared. You can send a private message "notify about EA version".
EA will be versatile with many settings for trading on various indicators. The new EA will also allow trading on this indicator. For example, allowing signals after X signals/bars to X signals/bars in one direction, before changing direction. If Break Out happened before/after the signal of another indicator. Collect profit on each next signal above/below the previous one.
Send a private message "notify
FREE

this is a highly profitable semi-auto grid strategy.
MT4 Version
======== Usage======== :
Symbol: Any Main pairs Timeframe: H1 or higher Recommend Lots: 0.01 per 1000 USD
Note: Grid strategy is alwasy with some risk due to the increasely accumulated risk lots. but the high profit makes such strategy still being popular no matter how forex industry developed.
semi-auto trading should be the best way to equilibrate profit and risk. this EA has integrated many useful options for user to con
FREE

Trend is Friends is an line Indicator used as an assistant tool for your trading strategy. The indicator analyzes the standard deviation of bar close for a given period and generates a buy or sell trend if the deviation increases. It good to combo with Martingale EA to follow Trend and Sellect Buy Only/Sell Only for EA work Semi-Automatic. You can use this Indicator with any EAs in my Products.
FREE

Stoploss Follower has the function of setting stop loss value on each order dynamically. When the price moves in profitable direction, the EA will calculate and set a new stop loss value that follows the price. But when the price moves in reverse, the stop loss value still remains at the position. So when the new price touches this stop loss value, the order is closed. Trader can set the estimate of stop loss value with Stoploss input parameter. This parameter is in pips unit, i.e when a trader
FREE

This indicator works on this way: Trader should provided the n period "Number of Candle" ( the default period is 6) Then the indicator will calculate the number of pips in the last n period (not the current candle) And that is display on the chart With that the should confirmed his up trend or down trend analyse according to the number of pips in the last n candles( bullish or bearish) he has provided
FREE
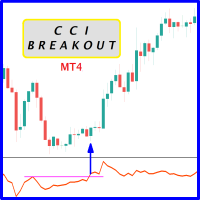
Probability emerges to record higher prices when CCi oscillator breaks out oscillator historical resistance level when exhibit overbought values. Since, oscillator breakout of support and resistance have similar effect as price breaks support and resistance levels, therefore, its highly advised to confirm price breakout with oscillator breakout; certainly, will have the same output in short trades. Concept is based on find swing levels which based on number of bars by each side of peak or trough
FREE

Introducing Arrogante EA , an Expert Advisor designed for the MetaTrader 4 (MT4) platform. This EA utilizes a trend-following strategy combined with specific reentry signals derived from a blend of technical indicators. It also features a configurable Martingale system for position management and recovery. Arrogante EA is suitable for traders looking for Forex trading automation and who are comfortable with strategies involving Martingale as a recovery method. Key Features: Entry Strategy: Use
FREE
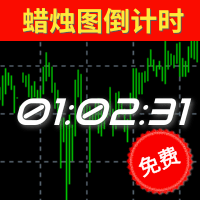
倒计时指标功能介绍 类别
解释
备注
预计结束倒计时 计算当前周期蜡烛图的结束时间(可应用于所有周期),其考虑了蜡烛图可能会因为日常休市而提前结束的情况; 如果该蜡烛图包含多个休市和开市的情况下,以最后的休市或者蜡烛图收盘时间为准。 值得特别注意的是:本指标并没有将平台额外公布的节假日休市、修改休市或者开市时间等因素纳入考虑范围,它仅仅是基于MT4所公开的交易时间做计算,无法100%确保本品种的收盘或者开盘时间无误 ,故使用者需提前明确该品种交易时间情况。
预计开盘倒计时 仅限于状态为"休市中"的提示,根据MT4上公开显示开市时间进行预估大约还有多久时间开盘; 和预计结束倒计时类似,并没有将额外公布的时间纳入考量。由于W1和MN1周期中包含多次的开盘和收盘,所以该两周期无休市提示。
【状态】 颜色 状态 备注 绿色 正常 一切正常 黄色 服务器无报价 服务器实际上传送到MT4并非是毫无中断的,可能是1分钟之内出现多次,甚至是连续较长的时间无报价,取决于您所处的网络延迟、服务器的情况等等。
本品种已有X秒无报价 MT4上并不是所有的品种的报价都是最新的,有可能某个品种长期无
FREE

What is ADR? Quite simply, ADR (Average Daily Range) is the average of price movement over a period of time. It can be used as a gauge of how far price may move on any given trading day. This indicator calculates 5, 10, 20 Average Daily Range Features: - Average: Daily Range, Prev 1/5/10/20 days - Calculator maximum stop loss/profit target by Risk/Reward percent of ADR in Pips. - Candle countdown - ... Contact me if you need: https://t.me/Cuongitl
FREE

The LexusBO indicator is recommended for trading binary options . Signals are generated when the RSI, ADX, CCI indicators cross the customizable levels. The indicator displays signals using "up/down" arrows on the chart. Their values are available in the buffer arrays (buffer with index 0 - "up" arrow, with index 1 - "down" arrow). This makes the indicator easy to use for automated trading through specialized Expert Advisors. The recommended timeframe is M5. The indicator has a built-in counter
FREE

Close Positions on Candle Close This tool allows you to automatically close positions based on the last candle's closing price, helping confirm trade exits and avoiding unpredictable price movements. How It Works: The EA waits for a candle to close above or below the Stop Loss level before executing a position close. It eliminates the need to manually monitor trades and helps automate exit strategies. Settings: Order_Type: Select the types of orders or positions to be managed. CandleTimeFrame:
FREE

This scanner shows the trend values of the well known indicator SuperTrend for up to 30 instruments and 8 time frames. You can get alerts via MT4, Email and Push-Notification as soon as the direction of the trend changes. This is the FREE version of the indicator: SuperTrend Scanner The free version works only on EURUSD and GBPUSD!
Important Information How you can maximize the potential of the scanner, please read here: www.mql5.com/en/blogs/post/718074
With the following FREE indicator you c
FREE
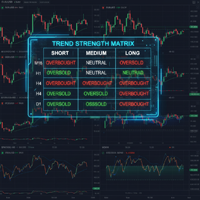
Powered by SVX Strategies Quant Team Tired of switching between charts? Trend Strength Matrix gives you an eagle-eye view of the market. This professional dashboard monitors the Adaptive RSI state across 4 key timeframes (M15, H1, H4, D1) simultaneously. Stop Monitoring, Start Automating
Watching a dashboard all day is exhausting. If you want the execution to be handled automatically by our systems, copy our official algorithms: Copy "Friday Pulse" (Conservative/Stable) Copy "SVX AI Systems" (H
FREE

MA MTF Overlay Chart is software that allows you to overlay the candlestick chart of a financial instrument with a second candlestick chart of the same one, or of another, financial instrument, by setting a different timeframe from that of the basic chart. The software is very simple to use and the input parameters are listed below.
Input parameters: Overlay chart set-up Financial instrument : financial instrument that you want to overlay on the base chart Time period : secondary instrume
FREE
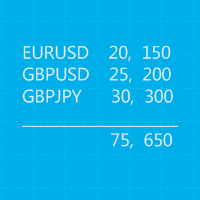
This is a MetaTrader 4 script. It helps to summarize all trades into every symbol.
Input Select Period: This is 7-option input. It includes Last Month, This Month, Last Week, This Week, Today, All History, and Date Specified. Specify Starting Date: Enter a date if you selected Date Specified in "Select Period" input. Specify Ending Date: Enter a date if you selected Date Specified in "Select Period" input. The summary is saved into a file in MQL4\Files folder. Also, there is pop-up window for a
FREE

X-axis lines prevail in grid manner, ruled by Average True Range. There’s an inevitable change in specific periods of time of this matter! The Average True Range (ATR) indicator is not directly based on volume; instead, measures volatility in price movements. This indicator original in its revealing customization, stretches, expand, shrink, and evolve with 4 timely choices of grid states! MATR means “multiplying average true range” in which grandeurs the grid pip-distant levels, seeming to g
FREE
The LWO is a tool that effectively indicates the end of trends. Being an oscillator, it has values between 0 and 100, defining the areas of hyper-sold and those of hyper-bought. Its effectiveness is due to the weighing of prices at the end of individual periods on a logarithmic scale; this allows you to have a perception of the will of the market.
The parameters
The indicator has only 2 settable values, period and smooth factor.
The period indicates how many bars the weighing is performed, whi
FREE
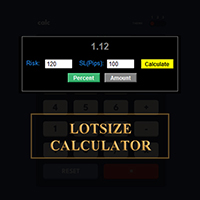
MetaTraderでロットサイズを計算しましょう!
トレーダーの皆さん、こんにちは。リスク管理重視のトレーダーですか?もしそうなら、これはまさにあなたのためのツールです。Ibrahimと申します。口座残高に対するリスクの割合に基づいてロットサイズを計算できるツールを開発しました。このツールは、リスクを%で指定するのではなく、リスクを負いたい絶対値がある場合にも、ロットサイズを計算するのに役立ちます。例えば、残高から100ドルのリスクを負いたいと指定できます。
MT5バージョン: https://www.mql5.com/en/market/product/155025
無料ですので、ぜひお試しください。コメント欄で、今後コミュニティ向けに開発してほしいツールや、今後追加してほしいツールがあれば教えてください。
ハッピートレーディング、ハッピーオートメーション!
FREE
The Swaps Indicator allows to monitor the swap rates of desired instruments in one place. There are several ways to choose the instruments list for the indicator: Select instruments from Market Watch Select all instruments Select instruments from the manually adjusted list All the setings color settings are adjustable in the indicator: you can set color for headers, for symbol names, for positive and negative swaps. There is also an ability to adjust the distance between the rows, columns and st
FREE
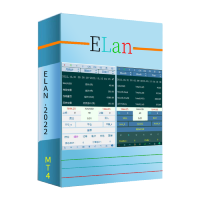
Elan: MT5およびMT4での取引体験を向上させる MT5またはMT4での取引効率を高め、取引時間を最大限に活用したいですか?それなら、Elanを見てみてください。これは、取引体験を最適化し、簡素化するために設計された強力な取引アシスタントです。 Elanは、取引ニーズをサポートする包括的な機能セットを提供します: ポジション管理 :視覚的なクローズオプションを使用してポジションを簡単に管理し、現在の注文の利益を一目で確認できます。 利益と損失の統計 :異なる取引期間にわたる利益と損失の詳細な統計で取引パフォーマンスを追跡します。正確なデータに基づいて情報に基づいた決定を下します。 注文管理 :アクティブおよび保留中の注文を監視し、取引を整理し、注文を見落とさないようにします。 市場情報 :さまざまなインストゥルメントのリアルタイムの市場動向と価格変動を常に把握し、より良い取引決定をサポートします。 アカウント情報 :アカウントデータとプラットフォームのステータスを簡単に表示し、アカウントの詳細とパフォーマンスを把握します。 コピー取引システム :複数のアカウントを効率的に管理す
FREE

このインジケーターは、チャート上の重要なテクニカル レベルを表示します。 これらのレベルは、価格変動のサポートまたはレジスタンスとして機能します。
最も重要なレベルは 100 ポイントと 50 ポイントの倍数です。 レベルを 25 ポイントの倍数で表示することもできます。
価格がそのレベルに達すると、アラートまたはプッシュ通知が表示されます。
MT5用バージョン https://www.mql5.com/ja/market/product/69740 設定 Show Levels 100 pips - レベルを 100 pips の倍数で表示します。 Show Levels 50 pips - レベルを 50 ピップスの倍数で表示します Show Levels 25 pips - レベルを 25 ピップの倍数で表示します Color Levels 100 pips - 100 ピップで割り切れるレベルの線の色 Color Levels 50 pips - 50 ピップスで割り切れるレベルの線の色 Color Levels 25 pips - 25 ピップで割り切れるレベルの線の
FREE

Perseus is a free Expert Advisor for GBPJPY . It based on MACD and Bollinger Bands . It has been tested for 10 years of history (from year 2011). Tested by Monte Carlo with 200 simulations too. All trades are cover by StopLoss . Doesn't use Martingale or other dangerous startegies. Perseus using fixed lot size, which you can set in settings. Perseus settings are optimized for the best results . There is no need to change it.
Recommendations Symbol: GBPJPY Timeframe: H1 Deposit: 300 USD Br
FREE
Unleash the full potential of your trading strategy with the Dynamic Range Breaker indicator! This essential tool is engineered to pinpoint significant market turning points and strong trend continuations, giving you the clarity and confidence to act. The Dynamic Range Breaker focuses on identifying clear "breakouts" from previous high and low points, signaling when the market is ready to make a decisive move. Forget the guesswork; this indicator empowers you with precise, actionable signals dir
FREE

这是一个交易辅助工具箱,并不是全自动交易的机器人 W10 系统请保持 100%的缩放比,如果超过这个值。按钮内的字体将超出按钮边框 常规: 一键下单、一键挂单、一键反手,自动设置止盈止损。 一键平仓、一键平多单(空单)、一键删除挂单。 一键反手、一键锁单、设置自动追踪止损。 根据画线追踪止损 非农: 消息突破单,可在非农或者其他重大消息时使用,在消息行情爆发前在当前价格上方 挂BUYSTOP,下方挂SELLSTOP。订单自动设置止盈止损。 划线下单: 支持最多四根做多趋势线或者做空趋势线并存。价格到达趋势线自动开单。 支持每根下单趋势线设置不同的仓位。 每根下单趋势线可以设置不同的止损趋势线、止盈趋势线。 支持止损止盈趋势线进行止损止盈追踪移动。 支持趋势线的“时效性”,如果价格运行到开单(止损、止盈)趋势线的右方仍未订单成交,则价格将永远不会接触到趋势线,策略失效。如需要请延长趋势线 杂项: 支持历史订单轨迹显示,可在图表显示历史记录中所有订单的下单轨迹,显示开仓价、平仓价、单量。 支持实时点差显示 支持平台信息显示,杠杆,一个点的价值,一手保证金,仓息,是否支持EA等等
FREE

B I G C H I E F P R E M I U M
Big Chief is an Expert Advisor that runs its own 2 proprietary analysis & algorithms. No indicator is used to analyze the entry point in the first method and the second method has an Ichimoku Indicator with proprietary settings. For the exit plan, it uses the proprietary Sequence Method & implement the cutlosses-let-profit-run strategy. You will be surprised that at the closing of all trades, almost most of them are having a positive profit and alm

OHLC マグネットは、水平線、長方形、価格ラベルに欠落しているマグネットポイントを追加します。 あなたはこのユーティリティが好きなら、 とコメントを評価してください。
指示:
前述のオブジェクトの1つを、ピクセルの近接範囲内の目的の始値、高値、安値、または終値にドラッグするだけで、選択した正確な価格ポイントにオブジェクトが自動的にアタッチされます。
パラメーター:
近接 (ピクセル): その特定の価格ポイントに接続するためのユーティリティの始値/高値/安値/終値をマウスカーソルがどの程度閉じるかをピクセル単位で指定します。デフォルトは10です。 価格ラベルを自動調整する: 価格ラベルを左側 (左の価格ラベルの場合) または右 (価格ラベルの場合) に自動的に調整します。既定値は有効です。
FREE

Prop Guardian Pro – Advanced Drawdown Manager With EA Killer Prop Guardian Pro is a comprehensive risk manager utility specifically designed for professional traders and Prop Firm candidates (FTMO, MFF, The5ers, etc.). It acts as a strict risk desk manager, ensuring you never violate your drawdown limits. Prop Guardian Pro goes beyond simple risk management by incorporating a "Psycho-Manager" engine. When a limit is hit, it stops trading and displays smart motivational messages to help prevent
FREE

A reversed engineered and improved version of the extremely popular AFSID scalper ( afs-id.com ). Includes re-modeled versions of these 2 well received scalping programs: " AF-Fibo ", and " AF-TrendKiller". Take note that this is a high risk scalper Though improvements have been made to mitigate some of the risks, the risks inherent to martingale scalpers still exists, so use it at your own risk.
afsida Scalper (improved AFSID)
This is a simple martingale scalper which works on any pair (1
FREE

Session Shade (MT4) – Non-Trading Hours Background Shading Overview Session Shade is a lightweight MT4 chart utility indicator that visually highlights non-trading hours by shading the chart background.
It is designed to help you confirm your daily time-filter window at a glance. This is a visualization tool only. It does not generate trading signals and it does not place, modify, or close any orders. Key features Shades non-trading hours (NG) on the chart background Keeps trading hours (OK) cl
FREE

After purchasing Dash Supply Demand, download "Connect Supply Demand" for free, which will be the information link that will fuel your Dash. "Connect Supply Demand" will be the information fuel that will carry data to your Dash. Don't forget that it must be in the same folder as your Dash! You can confirm the path to it through the indicator window! If you have any questions, we'll be happy to assist you!
FREE

O indicador com alertas do Setup de Larry Williams que conseguiu fazer U$ 10.000 virar U$ 1.100,00 em um campeonato de Trade em 1987 e comprovou fazendo a filha, que é atriz, fazer o mesmo estrago no mercado! A média de 9 para cima é compra, para baixo é venda, simples assim! Com alertas de sons e visual de compra, venda e flat, você se mantendo posicionado até a o alerta inverso a sua posição. Aconselhável usar de H1 para cima.
FREE
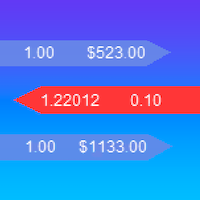
iExposure SYL displays information about opened trades considering commissions and swap, which affects the open price and the final outcome and and also allows drawing virtual transactions and calculating possible profits and losses in advance.
Differences from iExposure indicator of MT4: Separate profit column for BUY and SELL Trade open price considers commission and swap The indicator will come in handy for any hedging strategies that involve opening a large number of oppositely directed
FREE

Diversify the risk in your trading account by combining our Expert Advisors. Build your own custom trading system here: Simple Forex Trading Strategies
The expert advisor opens trades after CCI indicator exit the oversold or overbought areas. The Stop Loss, Take Profit, and Trailing Stop are calculated based on the ATR indicator. The recommended currency pair is GBPUSD and the recommended timeframe to operate and to do backtests is D1. This Expert Advisor can be profitable in any TimeFrame a
FREE

Volume Cross Over is an indicator that measure positive and negative volume flow in a financial instrument, such as a stock, commodity, or index. It is base on the idea of On-Balance Volume developed by Joseph Granville. However instead of trending lines, this indicator shows volume cross over. When the closing price of an asset is higher than the previous closing price, then the Bull volume is greater than zero and Bear volume is negative. It suggests that buying volume is dominating, an
FREE

The " Multi Kernel Regression " is a versatile trading indicator that provides graphical interpretations of market trends by using different kernel regression methods. It's beneficial because it smoothes out price data, creating a clearer picture of price movements, and can be tailored according to the user's preference with various options.
What makes this indicator uniquely versatile is the 'Kernel Select' feature, which allows you to choose from a variety of regression kernel types, such as
FREE

Indicator measures strength of each currency in your list.
Main idea: It simply iterates through all combinations of pairs and adds difference between open and close in percent. Parameters: List of currencies - what currencies will be calculated (maximum is 8) Calculation type - from which data will be strength calculated Calculation data input - used as input related to calculation type Symbol suffix - used in case of suffix on symbols, e.g: when your symbols look like EURUSDm, EURUSDmicro etc
FREE
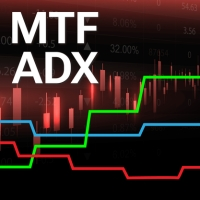
Using multiple timeframes for analysis with Multi Timeframe Average Directional Index can provide several significant benefits for traders: Comprehensive Market View: By applying Mtf ADX Standard across different timeframes, traders gain a broader perspective on market dynamics. This allows them to identify trends, patterns, and potential reversal points that might be more apparent or consistent across various scales. Enhanced Pattern Recognition: Multiple timeframes help in identifying repeati
FREE

The purpose of this new version of the MT4 standard indicator provided in your platform is to display in a sub-window multiple timeframes of the same indicator. See the example shown in the picture below. But the display isn’t like a simple MTF indicator. This is the real display of the indicator on its timeframe. Here's the options available in the FFx indicator: Select the timeframes to be displayed (M1 to Monthly) Define the width (number of bars) for each timeframe box Alert pop up/sound/ema
FREE

Automate Your Profits with Precision
Please Notice that this tool is just the beginning! I really need to know your opinion about it, just leave a review and we will make it better for sure! The UPDATES Would be based on your feedback!
How It Works: The Auto TP Specified Expert Advisor continuously scans for orders lacking take profit settings. Once identified, it applies the user-defined take profit level, ensuring consistent profit-taking across trades. Existing take profit settings
FREE

The Fibonacci indicator automatically displays the Fibonacci retracement levels, representing significant support and resistance. The range for calculating the indicator can be taken from the previous day, week, month, year or user-specified session.
Levels 100 % (High) of the range from the previous session. 0 % (Low) of the range from the previous session. 76,4 % of the range from the previous session. 61,8 % of the range from the previous session. 50 % of the range from the previou
FREE

Buy 1 Get 1 Free
Key Benefits of Using Auto TPSL (Take Profit / Stop Loss) "Auto TPSL" is an Expert Advisor (EA) designed to automatically manage Take Profit (TP) and Stop Loss (SL) for your orders in MetaTrader. This offers significant advantages for traders: Saves Time and Reduces Workload: You don't need to manually set TP/SL for every order. The EA will handle it automatically as soon as an order is opened. Consistency in Risk Management: Helps you maintain discipline in setting profit tar
FREE
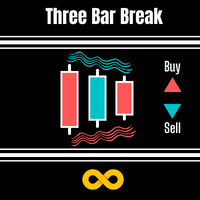
DESCRIPTION 3 Bar Break is based on one of Linda Bradford Raschke's trading methods that I have noticed is good at spotting potential future price volatility. It looks for when the previous bar's High is less than the 3rd bar's High as well as the previous bar's Low to be higher than the 3rd bar's Low. It then predicts the market might breakout to new levels within 2-3 of the next coming bars. Must also be traded during the active hours of the market you want to trade. EG EURUSD 7am - 5pm This
FREE
How To Trade
Execute your trades in 3 Easy Steps!
Step 1: Trade Setup Entry Buy in Signal Arrow color DodgerBlue. Entry Sell in Signal Arrow color RED. Success Rate ≥ 75% 100:25 Step 2: Set Stop Loss Stop loss BUY ----> You can set stop loss on Line RECTANGEL color DodgerBlue. Stop loss SELL ----> You can set stop loss on Line RECTANGEL color RED. Step 3: Set Take Profit Take profit BUY on RECTANGEL color RED. Take profit SELL on RECTANGEL color DodgerBlue. Strategy SIMPLE Day trading / Swing
FREE

Unlock Smarter Trading with Triple Candle Trend! Stop chasing signals and start trading with confidence and confluence . The Triple Candle Trend indicator is your all-in-one system designed to cut through market noise and deliver high-probability entry points. We don't rely on a single factor; we combine the power of three confirming tools into one clear signal! Why You Need This Indicator: Filter Out Noise, Find the Trend: This system uses the mighty EMA 200 as a foundational trend filter. If
FREE
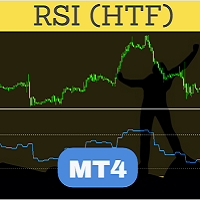
Perfected RSI (Relative Strength Index) HTF (Higher Time Frame) is perhaps the most advanced and reliable HTF indicator. Highly optimized in terms of execution, the indicator comes with standard settings of the RSI indicator which is supplied with the MT4 platform. Place the indicator on the chart, any timeframe. You may select a higher time frame in indicator inputs. The same indicator can be used on a chart multiple times to draw RSI from multiple timeframes or for different RSI period values
FREE

Title: Risk Commander Trade Assistant and Simulator Description: Risk Commander is a trade management panel designed to assist with manual execution and risk calculation. It functions as both a live trading assistant and a training tool within the Strategy Tester. Product Utility: Live Assistant: Facilitates trade execution with automated position sizing and risk management calculations in real-time. Training Simulator: Fully compatible with the MetaTrader Strategy Tester (Visual Mode). This all
FREE

The indicator is specially designed for the trading utility Trade Shell (included Trade Shell SMC ) to get it working on visual strategy tester.
Backtest your trading ideas and indicators. Run Trade Shell on visual tester and then put this indicator on the chart. After that you will be able to control all functions of the Trade Shell as well as with live using! It does not work live! Use it with visual tester only. It does not require to set any setting on input parameters.
Have a good luck
FREE

Screener Breakout Congestion: Have you ever missed a trading opportunity because you were not looking at the chart of that market in that specific time frame? Here is this screener to help you identify congestion breakouts in the markets you want to follow in the different time frames required. Once you have identified the markets (forex, indices, CDF) and the different time frames (1M, 5M, 15M, 30M, 1H, 4H, Daily), the screener is represented by several buttons that change colour when the conge
FREE

This is the countdown of the last candle Indicator. How much time remains in the current candle of your chart CTime display exactly how many hours, minutes and seconds remain before the current candle closes, and a new one opens. This allows you to be on the ball as soon as the next candle appears It could be useful for a trader who trades with candles as the main attention Available option to change the text color to suit the chart background. This Indicator is related to the system here .
FREE

Indicator ini berdasarkan Gain ADX - Follow Trend - Disertai Pivot, Support & Resistant Daily
Dengan indicator ini semoga menjadikan indicator yang porofit able, selama mengikuti signal yang tampil, apabila berwarna Hijau siap2 untuk Buy, dan berwarna Merah siap2 untuk Sell.
Akan tampil signal Sell/Buy di saat gain mencukupi, baik TF Kecil maupun TF Besar TF Besar / High TF adalah Trend Kuat TF Kecil / Low TF adalah Trend Lemah
Open Posisi pada High TF, signal akan menunjukkan Sell/Buy.
FREE

Introduction and Description
Colored candlesticks showing the trend based on two moving averages and the slope of the slow moving average. A trend is the overall direction of a market or an asset's price. In technical analysis, trends are identified by trendlines or price action that highlight when the price is making higher swing highs and higher swing lows for an uptrend, or lower swing lows and lower swing highs for a downtrend. Many traders opt to trade in the same direction as a trend, whil
FREE

Summary This indicator is based on RSI and Momentum indicators. It also considers moving averages of these two indicators. The three indicators have adjustable settings. The arrows do not repaint since the indicator only uses confirmed values and waits for the candle to close before painting an arrow. The indicator is also able to alert when arrows appear. There are 3 types of alerts - Popup, Email and Mobile Push Notifications. The arrows can be used in the EA and the inputs can also be optimiz
FREE

The Tarantulas expert Advisor is a night scalper and a robot for position trading at the same time.
Thanks to deep settings, this expert Advisor becomes an indispensable assistant in trading.
On the basis of this EA, you can implement dozens or even hundreds of profitable strategies.
Smart position tracking and time trading functions are enabled.
Trading is performed on pullbacks from overbought and oversold zones on trend changes.
The trend is determined using the author's "Providec Trend
FREE

Daily pivot are relatively important in trading. This indicator have options to select 5 commonly use pivot point calculations. User input Choose Pivot Point Calculation ( Method Classic, Method Camarilla, Method TomDeMark, Method Fibonacci or Method Woodies. ) Choose Applied Timeframe for the calculation (M5, M15, H1, H4, D1, W1 etc) Can be attached to any timeframe Choose color of Pivot point For MT5 version, please refer here: https://www.mql5.com/en/market/product/38816
FREE

The EU_15_111517128_S_Op_CF_SQ3 is an algorithmic trading strategy for MetaTrader, tested on EURUSD using the M15 timeframe from April 1, 2004, to April 24, 2024. There is no need to set up parameters, all settings are already optimized and fine-tuned.
Recommended broker RoboForex because of EET timezone.
You can find the strategy source code for StrategyQuant at the link: https://quantmonitor.net/eurusd-bollinger-bands-breaker/
Key details are:
Main Chart: Current symbol and timeframe
FREE

Advantages: Based on classic indicators - ATR, Moving Average Determines the trend / flat in the market by coloring the histogram with the appropriate color Arrows indicate confirmed signals It is an excellent filter for channel strategies (by extremes)
Settings:
Наименование Описание настройки Period of Flat Detector Number of bars / candles for analysis Period of EMA Period of EMA (Moving Average) Period of ATR Period of ATR (current timeframe) Coefficient of deviation Coefficient of deviati
FREE

CDS SR Fractal Level: Enhance Your Trading Accuracy with Automatic Fractal-Based Support and Resistance Levels The CDS SR Fractal Level indicator is an advanced trading tool designed by CDS to automatically identify and visualize key Support and Resistance (SR) levels. This indicator utilizes the concept of fractals to present relevant SR levels for your trading decisions. Key Features: Automatic Fractal Level Identification: The indicator dynamically marks fractal levels as they form on the pri
FREE

Sirr Smart AI Express 3 for MT4 EA is an automated and easy to use expert advisor that has the Stochastic indicator working in combination with RSI and MACD filters built in. We have spent a lot of time testing many expert advisors . After years of testing and development, the result is an dynamic EA that is very active with trades and capital management. Our product is also fully compatible with PipFinite Trend Indicator PRO as well. The EA has been designed for trading with the popular symb
FREE

Welcome to the World of our Trade Copier via Internet *whatever is the technology we can copy trades from/to MT4 platforms. You can trade manually from your mobile phone or you can attach your trading robots (EA) to your master account(s) and the trades will be copied to all your usersaccount(s). Our trade copier is not self-hosted, it means that you need to keep your computer or VPS running, everything is managed via internet.
Everything works Via Internet! ( Please add the address " h
FREE
MetaTraderマーケットはトレーダーのための自動売買ロボットやテクニカル指標を備えており、 ターミナルから直接利用することができます。
MQL5.community支払いシステムはMetaTraderサービス上のトランザクションのためにMQL5.comサイトに登録したすべてのユーザーに利用可能です。WebMoney、PayPal または銀行カードを使っての入金や出金が可能です。
取引の機会を逃しています。
- 無料取引アプリ
- 8千を超えるシグナルをコピー
- 金融ニュースで金融マーケットを探索
新規登録
ログイン