YouTubeにあるマーケットチュートリアルビデオをご覧ください
ロボットや指標を購入する
仮想ホスティングで
EAを実行
EAを実行
ロボットや指標を購入前にテストする
マーケットで収入を得る
販売のためにプロダクトをプレゼンテーションする方法
MetaTrader 4のためのエキスパートアドバイザーとインディケータ - 42

ZhiBiJuJi指標分析システムは、強力な内部ループを使用して独自の外部指標を呼び出してから、サイクルの前後に分析を呼び出します。 この指標分析システムのデータ計算は非常に複雑であり(サイクルの前後に呼び出す)、そのため信号のヒステリシスが減少し、そして事前予測の精度が達成される。 このインディケータはMT4の全サイクルで使用でき、15分、30分、1時間、4時間に最適です。 購入する マゼンタラインが表示され、マゼンタラインが0軸の上にあるとき、あなたはBuyの注文を出すことができます。 売る: ライムラインが表示され、ライムラインが0軸を下回ると、売りを出すことができます(Sell)。 注: 注文後に反対の信号が表示された場合、最善の方法は直ちにストップロスを閉じてから注文を取り消すことです。 注文後に反シグナルがあるので、この時点でのポジション注文の損失は小さいので、ストップロスに大きな損失はありません! 私たちは利益のために大きなバンドをつかむ必要があります、そしてこの指標は大きなバンドを捉える強い能力を持っています
Grid Martin is a fully automatic system. The advisor works according to the grid strategy with the possible use of martingale. Work = true Risk = 0.1 - lot T akeProfit = 100 - take profit Delta = 100 - grid step MartinKof = 1 - martingale coefficient MaxSpred = 35 - maximum spread Magic =123 - magic number Slipage = 5 - slippage Period_1 = PERIOD_D1 - indicator timeframe for opening the first deal.
FREE

Индикатор рисует уровни Фибоначчи с выделенными Ценовыми метками.При установке индикатора на график необходимо создать трендовую линию с именем указанным в поле" Unique name of trend line to place fib on ". По умолчанию имя=" Unique name of trend line to place fib on" = "+" .В индикаторе можно заменить уровни фибоначчи по своему усмотрению.Также меняются цвет,стиль,толщина линий и т. д.
FREE

Bamboo expert 4 is based on the custom indicator Bamboo 4 . Entry points are determined using Bamboo 4 values. Positions are closed when reaching specified profit and loss levels or when opposite signal appears if Stop Loss and Take Profit values are zero. Input Parameters Period - Period parameter of the indicator Bamboo 4; Mode - operation mode of the Expert Advisor (0-7); Stop Loss - loss fixing level in points; Take Profit - profit fixing levels in points; Lot - lot size; Magic Number - "mag
FREE

BB & RSI Candle Color: Technical Analysis Indicator on MetaTrader 4 The "BB & RSI Candle Color" indicator is a powerful technical analysis tool designed for MetaTrader 4 traders looking for an effective visual representation of market conditions. Created by 13 Crow Trading Club, this indicator combines the popular Bollinger Bands and the Relative Strength Indicator (RSI) to provide clear and accurate visual signals. This indicator offers three key aspects: Candle Color: Normal candles are displa
FREE

Ska ZigZag Line indicator determines the overbought and oversold regions within a trend. The indicator determines the overbought region by the candlestick high and the oversold region by the candlestick low in a form of a line. To utilize the full strategy i recommend using "Ska ZigZag Line" together with "Ska ZigZag BuySell". NOTE: This indicator is a line based indicator. HOW TO USE: Sell Signal; Place a sell trade when the Ska ZigZag BuySell indicator arrow appear on top of the Ska ZigZag Lin
FREE

Super MACD es un asesor experto avanzado diseñado para operar en el mercado financiero, centrándose en la estrategia del Moving Average Convergence Divergence (MACD). Este asesor ofrece la posibilidad de personalizar los niveles de Take Profit y Stop Loss en todas las operaciones, brindando así un control preciso sobre la gestión de riesgos y ganancias.
Parámetros recomendados Eur Usd M5 Características destacadas de Super MACD: Indicador MACD Optimizado: Super MACD utiliza una versión altament
FREE

Euro Pulse EA (Alpha Structure FX) Overview
Prop Firm Robot is an automated Expert Advisor for MetaTrader 4 that trades 5 minute timeframe using a multi-indicator confirmation model and built-in protection limits.
Entries are filtered by several standard indicators and are evaluated on new bars.
The EA includes spread/position limits, daily loss and drawdown limits, and account equity protections that can suspend new entries when triggered.
An optional news filter can pause new entries around sc

This indicator is designed to find the difference in MOMENTUM price and indicator. This indicator shows the price and indicator difference on the screen. The user is alerted with the alert sending feature. Our Popular Products Super Oscillator HC Cross Signal Super Cross Trend Strong Trend Super Signal Parameters divergenceDepth - Depth of 2nd ref. point search Momentum_Period - Second calculation period indAppliedPrice - Applied price of indicator indMAMethod - MA calculation method findEx
FREE
Free Demo Version for testing can be found here : https://www.mql5.com/en/market/product/38041
Smart risk management tools.
You can control profit , loss target easily and customizable. Custom profit , loss target by amount of money method. Closing and calculating all symbols or the current symbol only. Can work on every trading account currency. How to use? Just place this EA into any symbol,currencies that you want to take control. Then custom input parameters. Click "OK" button. Ready to
「GA Moving Average」(「GA 移動平均線」)は、移動平均線クロスオーバー戦略を用いたエキスパートアドバイザー(EA)であり、完璧なトレード戦略を実現するための多くの設定が可能です。
「GA Moving Average」の中心コンセプトは、移動平均線インジケーターを利用して潜在的なトレード機会を特定することです。異なる移動平均線の相互作用を分析することで、このEAは市場での買いシグナルと売りシグナルを生成することを目指しています。
主な特徴とカスタマイズオプション: 1. 移動平均線のパラメーター:トレーダーは、短期と長期の移動平均線の特定の期間を設定できます。これにより、トレーディングスタイルや好みに合わせて柔軟に適応することができます。さまざまな市場条件や時間枠に対応することが可能です。
2. クロスシグナルの生成:EAは、短期移動平均線が長期移動平均線を上回ると買いシグナルが生成され、短期移動平均線が長期移動平均線を下回ると売りシグナルが生成されるよう監視します。これにより、潜在的な買いチャンスや売りチャンスを示します。
3. リスク管理:EAにはリス
FREE

このインジケーターは、チャート上の重要なテクニカル レベルを表示します。 これらのレベルは、価格変動のサポートまたはレジスタンスとして機能します。
最も重要なレベルは 100 ポイントと 50 ポイントの倍数です。 レベルを 25 ポイントの倍数で表示することもできます。
価格がそのレベルに達すると、アラートまたはプッシュ通知が表示されます。
MT5用バージョン https://www.mql5.com/ja/market/product/69740 設定 Show Levels 100 pips - レベルを 100 pips の倍数で表示します。 Show Levels 50 pips - レベルを 50 ピップスの倍数で表示します Show Levels 25 pips - レベルを 25 ピップの倍数で表示します Color Levels 100 pips - 100 ピップで割り切れるレベルの線の色 Color Levels 50 pips - 50 ピップスで割り切れるレベルの線の色 Color Levels 25 pips - 25 ピップで割り切れるレベルの線の
FREE

This indicator signals about crossing of the main and the signal lines of stochastic (lower stochastic) in the trend direction which is determined by two stochastics of higher time frames (higher stochastics). It is not a secret that stochastic generates accurate signals in a flat market and a lot of false signals in a protracted trend. A combination of two stochastics of higher time frames performs a good filtration of false signals and shows the main tendency. The indicator is recommended for
FREE

親愛なる友人、ご清聴ありがとうございました。 異なる通貨ペアの動きが相互に関連していることを観察したい場合は、インジケーター Visual Correlation に注目してください。 異なる通貨ペアの動きは相互に関連しています。 Visual Correlation インジケーターを使用すると、スケールを維持しながら 1 つのチャート上にさまざまな金融商品を表示できます。 正の相関、負の相関、または相関なしを定義できます。
親愛なる友人、あなたは、いくつかの楽器が他の楽器よりも先に動くことをご存知でしょう。 このような瞬間は、グラフを重ね合わせることで判断できます。
親愛なる友人へ、チャート上に商品を表示するには、Symbol フィールドに商品名を入力する必要があります。 Version for MT5 https://www.mql5.com/ja/market/product/109155
FREE

The Trade Grid bot simplifies trading by executing multiple orders with a single click, as specified by the user. These orders are initiated instantly using the EA buttons on the chart and can be closed simultaneously using the close button also located on the chart. Additionally, Trade Grid efficiently manages trades by automatically closing them once they reach a predefined profit or loss threshold.
FREE

Pattern Explorer is a reliable tool for applying all the power of the most popular Japanese Candlestick Patterns . It uses Machine Learning algorithms to confirm all the patterns. What is the most impressive thing about it? Select Take Profit and Stop Loss and click on “Backtest your strategy” button to backtest your strategy in real time and to see according to your selection: Total signals Testable signals (signals that are reliable to be tested) Profitable signals (%) Loss signals (%) Total p
FREE

This is a trend indicator.
Timeframe: any Symbol: any Color meaning: blue: long trend, up trend red: short trend, down trend yellow: market trend is changing Feature: 1, very easy to use, obvious signal, profitable 2, suitable to work on charts of any timeframe 2, all type of alerts 3, standard data buffers, can be easily implanted into any EA program. 4, all color customizable.
wish you like it :)
FREE

When prices breakout resistance levels are combined with Larry Williams' Percentage Range "WPR" oscillator breaks out its historical resistance levels then probability emerges to record farther prices. It's strongly encouraged to confirm price breakout with oscillator breakout since they have comparable effects to price breaking support and resistance levels; surely, short trades will have the same perception. Concept is based on find swing levels which based on number of bars by each side
FREE

The recommended timeframe is H1!
The indicator has two kinds of signal.
This is a signal to open a position from the appearance of an arrow. The price leaves the channel In the first case, the indicator builds arrows based on the constructed channel and Bollinger Bands years.
In another case, the trader can trade if the price just went beyond the channel. If the price is higher than the channel - we sell. If the price is lower than the channel, then you can look for a place to buy.
It can al
FREE

Unlock Instant Pattern Recognition with Our Advanced Trading Indicator Are you looking to instantly spot key candlestick patterns like Engulfing, Doji, Marubozu, Harami, Hanging Man, Shooting Star, Evening Star, Hikkake, Dark Cloud Cover, or Black Crow as they form? With this powerful indicator, you can monitor all 28 currency pairs in real time and get instant alerts whenever one of these crucial patterns is detected. Key Features: Real-Time Alerts: Instantly know when any of the key candlestic
FREE
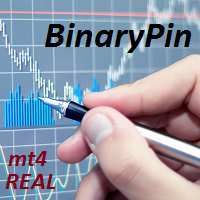
BinaryPin is an indicator developed and adapted specifically for trading short-term binary options. The indicator's algorithm, before issuing the signal, analyzes many factors, such as market volatility, searches for the PinBar pattern, calculates the probability of success when making a deal. The indicator is set in the usual way. The indicator itself consists of an information window where the name of the trading instrument is displayed, the probability of making a successful transaction, the
FREE
Expert Advisor Features trailing profit in the deposit currency (Trailing Stop Money) closing by a profit or loss in the deposit currency opening orders at a specified time managing positions opened manually or by another Expert Advisor calculating initial lot based on the current balance limiting the maximum lot volume choosing trading type several types and methods of averaging visually displays the current breakeven price, draws horizontal lines "Line break even BUY"-blue, "Line break even S
FREE

1.毎月、毎週、および毎日のピボットは、各期間の開始データと終了データを使用して計算されます。
2.これにより、グラフ上に簡単な線が表示され、要点がどこにあるかを識別し、計算の誤差を減らすことができます。
3.インジケータは、ピボットの計算方法がわからなくても、楽器の主なピボットをすばやく定義するのに役立ちます。
あなたはより良い価格の位置を理解することができるようにあなたはまた、毎週と毎日のピボットを比較することができます。
5この指標は、あなたがより効果的に抵抗や支持に近いところで取引するのを助けます。
1. Maitsuki, maishū, oyobi mainichi no pibotto wa, kaku kikan no kaishi dēta to shūryō dēta o shiyō shite keisan sa remasu. 2. Kore ni yori, gurafu-jō ni kantan'na-sen ga hyōji sa re, yōten ga doko ni aru ka o shikibetsu shi, keisan no go
FREE

この指標は、前月の始値、高値、安値、終値を今月の低い時間枠でプロットします。
これらのレベルは良いサポートとレジスタンスレベルとして機能します。
時間価格の大部分はレベル内で変動します。
価格がこれらのレベルに達するのを待って、それに従って行動してください。
レベルの合流点に特に注意してください。
私の観察によると、Close(White)レベルが他のレベルとコンフルエントになっている場合は、脱落またはバウンスの可能性が高いです。
前の月にスクロールして、理解を深めるためにこれらのレベルで価格アクションを観察します。
入力パラメータ
入力パラメータなし
オープン=カラースプリンググリーン
高=カラーマゼンタ
低=カラーダークカーキ
閉じる=カラーホワイト
指標をお楽しみください。
FREE

With this system you can spot high-probability trades in direction of strong trends. You can profit from stop hunt moves initiated by the smart money!
Important Information How you can maximize the potential of the scanner, please read here: www.mql5.com/en/blogs/post/718109 Please read also the blog about the usage of the indicator: Professional Trading With Strong Momentum This FREE Version of the indicator works only on EURUSD and GBPUSD. The full version of the indicator can be found here:
FREE

4H Open Line Indicator - Settings Overview This custom indicator is used to draw and visualize the opening price , midline , and high/low ranges of 4-hour candles on smaller timeframes. It's particularly useful for intraday traders who want to see higher-timeframe levels. Indicator Inputs and Descriptions Parameter Value Description OpenLineColor White Color of the line indicating the open price of the 4H candle. OpenLineWidth 1 Width of the open price line. OpenLineStyle Solid Line style
FREE

The Magic LWMA indicator is of great help in determining trend direction. It can be an excellent addition to your existing strategy or the basis of a new one. We humans can make better decisions when we see better visually. So we designed it to show a different color for rising and falling trends. Everyone can customize this in the way that suits them best. By setting the Trend Period, we can optimize it for longer or shorter trends for our strategy. It is great for all time frames.
IF YOU NEE
FREE

Donchian channels are a tool in technical analysis used to determine the relative volatility of a market and the potential for price breakouts.
Can help identify potential breakouts and reversals in price, which are the moments when traders are called on to make strategic decisions. These strategies can help you capitalize on price trends while having pre-defined entry and exit points to secure gains or limit losses. Using the Donchian channel can thus be part of a disciplined approach to managi
FREE

Master Candle (MC) Indicator automatically detects "Master Candles", also known as "Mother Candles", i.e. candle that engulf several candles that follow them. See screenshots. You can choose how many candles Master Candle should engulf. By default it is set to 4. Feel free to change colour and thickness of lines as it suites you.
I find this indicator to be very useful to identify congestions and breakouts, especially on 60 minutes charts. Usually if you see candle closing above or below "Maste
FREE

このインジケーターは、アクティブおよび非アクティブな取引セッションを表示し、取引セッションがアクティブ (1) または非アクティブ (0) であるかどうかとしてグローバル変数を設定します。 iCustom ライブラリ関数を使用すると、次のように Expert Advisor またはスクリプトからこの指標を呼び出すことができます。 // カスタム インジケーターを呼び出す iCustom ( Symbol (), PERIOD_D1 , "Market/RedeeCash_TimeZone" , 0 , 0 ,Blue,Red); // グローバル変数の値を取得する double NewYorkSessionIsActive = GlobalVariableGet ( "TZ-NewYork" ); double LondonSessionIsActive = GlobalVariableGet ( "TZ-London" ); double SydneySessionIsActive = GlobalVariableGet ( "TZ-Sydney" ); double TokyoSe
FREE

GTAS FidTdi is a trend indicator using combination of volatility and potential retracement levels. This indicator was created by Bernard Prats Desclaux, proprietary trader and ex-hedge fund manager, founder of E-Winvest.
Description The indicator is represented as a red or green envelope above or under prices.
How to use Trend detecting When the envelope is green, the trend is bullish. When it is red, the trend is bearish.
Trading Once a trade is opened, GTAS FibTdi shows retracement zones wh
FREE

Sweep Trend チャート上のインジケーターは、指定された設定に従って価格変動の揮発性部分を長方形の形でマークします。
設定の説明 TrendPips-ポイント単位のフィルター値 TrendBars-バーの数で値をフィルタリングします signal_shift-シグナルの場合、現在のバーに対して指定された期間だけシフトバックします CountBars-インジケーターを表示するバーの数 Color_1-交互の長方形の色の1つ Color_2-長方形の2番目の色 アラート-ユーザーデータを含むダイアログボックスを表示します。 テキスト-信号のカスタムテキスト。 Send_Mail- [メール]タブの設定ウィンドウで指定されたアドレスにメールを送信します。 件名-メールヘッダー。 Send_Notification- [通知]タブの設定ウィンドウでMetaQuotesIDが指定されているモバイル端末に通知を送信します。 開発者の場合: インジケーターには1つのシグナルバッファーがあり、その値は表示長方形の形成後に1に等しくなります。それ以外の場合は、ゼロに等しくなります。インジケ
FREE

FUNDING DEVIL INDICATOR has been developed by traders for traders and is not another combination out of existing indicators or a "magic, solve all situations" tool.
PASS THE FUNDED ACCOUNTS WITH IT.
It is the answer for beginners and experienced traders about the misleading concepts of the mainstream, causing 90% of retail traders, never making a living out of trading.
Successful traders are "following the smart money" and do NOT try to catch every move from start to end. Consistent traders
FREE

One Click Trade Pro is a tool that allows you to open orders with just one click, choosing all the parameters, including the Magic Number! Useful if you want to quickly submit trades specifying also their Magic Number. Other than submitting new orders you can also see the list of orders (with their Magic Number) and change their Stop Loss and Take Profit. The PRO version also allows you to: Open opposite pending orders Setup and submit orders using lines, for a better visualization
How does it
FREE

Transform Your Trading with the Visual Trend Ribbon Tired of missing the big moves? Do you struggle to identify the market's true direction? The Visual Trend Ribbon is your solution. This powerful indicator cuts through the market noise, giving you a clear, visual understanding of the trend so you can trade with confidence. Instead of a single, lagging line, the Visual Trend Ribbon uses a dynamic band of multiple moving averages to show you the market's true momentum. When the ribbon expands, t
FREE

RSI / TDIアラートダッシュボードを使用すると、取引するすべての主要ペアでRSIを一度に(ユーザーが選択可能に)監視できます。
次の2つの方法で使用できます。
1.複数の時間枠を選択すると、通常の取引条件を超えて延長された複数の時間枠がある場合にダッシュが表示されます。複数の時間枠にわたって買われ過ぎまたは売られ過ぎのレベルを達成したため、価格が最近激しく押し上げられたため、引き戻しまたは逆転が間もなく行われることを示す優れた指標です。
2. 1つの時間枠(トレードするのが好き)と複数のRSIレベルを使用して、その時間枠でのRSIの延長の強さを示します。これは、価格が一方向に非常に長く押し込まれ、市場が利益を得ることになっている場合に、平均回帰取引を行うための優れた戦略です。スクリーンショットの例では、H4 RSIが25レベルを超えて2ペアで拡張されていることがわかります。これは、通常の価格アクションよりもはるかに遠いため、長く行く良い機会です。
ダッシュボードは、選択した時間枠でろうそくが閉じたときに、選択したレベルでの延長された状態(買われ過ぎと売られ過ぎ)を警告

対称三角形パターンダッシュボードを使用すると、ここで利用可能な対称三角形パターンインジケーターによって描画される対称三角形パターンについて、複数の市場と時間枠を一度に監視できます。 https://www.mql5.com/en/market/product/68709/ 上記のインジケーターにアクセスして、対称的な三角形のパターンがどのように形成され、それらを取引するための戦略に従うのが簡単かについて詳しく学んでください。
ダッシュボードはスタンドアロン製品であり、インジケーターが機能する必要はありません。パターンを監視し、形成されたときにアラートを発行するだけなので、チャートでパターンを実際に確認したい場合は、対称的な三角形のパターンインジケーターも必要になります。
対称的な三角形のチャートパターンは、価格が上昇または崩壊することを余儀なくされる前の収縮と統合の期間を表しています。下のトレンドラインからのブレークアウトは新しい弱気トレンドの始まりを示し、上のトレンドラインからのブレークアウトは新しい強気のトレンドの始まりを示します。
このダッシュボードはこれらのパターンを識
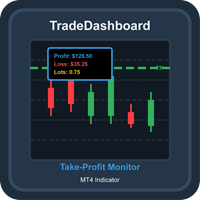
TradeDashboard Comprehensive MT4 Indicator for Trade Visualization and Analysis Overview TradeDashboard is a powerful MetaTrader 4 indicator designed to enhance your trading experience by providing real-time visualization of take-profit levels for all open positions. This advanced tool goes beyond basic TP indicators by displaying comprehensive metrics including potential profits, losses, and total lot sizes, all directly on your chart. Key Features Take-Profit Visualization : Clearly displays h
FREE
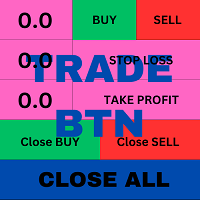
This is an ON CHART trade management panel. In other words, ON CHART Lot Size, Buy, Sell, Stop Loss, Take Profit, Close Buy, Close Sell and Close All buttons! *IMPORTANT NOTE: Input settings are NOT usable. You can change or insert Stop Loss and Take Profit values only on the chart panel. (See the below video!) This one is MT4 version!
BUTTONS List: 1. Lot Size - (0.01) is default click on it and insert the lot size with which you want to open a trade. 2. Stop Loss - (0.0) is default click on i
FREE

This indicator show candle time remaining. The remaining time of the candle is calculated every 200 milliseconds. 1. You can set x (horizontal), y (vertical) of text. 2. You can set font, color, size of text. 3. You can remove the text without having to remove the indicator from the chart. The remaining time of the candle depends on the timeframe of the chart with the indicator.
FREE

RaysFX Stochastic L'indicatore RaysFX Stochastic è un indicatore personalizzato per la piattaforma MetaTrader 4.
Caratteristiche principali:
-Indicatori separati: L'indicatore viene visualizzato in una finestra separata sotto il grafico principale. -Livelli dell'indicatore: L'indicatore ha due livelli predefiniti, 20 e 80, che possono essere utilizzati come livelli di ipervenduto e ipercomprato. -Buffer dell'indicatore: L'indicatore utilizza quattro buffer per calcolare e memorizzare i suoi
FREE

Rebate System performs a large number of trades with the minimum profit, which gives the opportunity to earn from receiving rebates (returning part of a spread). It is based on two grids (buy and sell), when one of them is in a drawdown, the other one can enter with an increased lot size, keeping the account away from the drawdown. It features a news filter, which prevents the possibility of getting into a trend without rollback caused by news releases. The default parameters are for EURUSD and

Volume Profile Pro インジケーター このインジケーターは、 Volume Profile Pro ツールであり、「どの価格帯で最も取引が行われているか」を分析するのに役立ちます。以下の特別な機能が追加されています: 表示モード (Display Modes) Volume Profile (通常): 各価格帯の総取引量 (Total Volume) を表示し、重要なサポート・レジスタンスゾーンを可視化します。 Delta / Money Flow: 買い圧力と売り圧力 (Buy vs Sell) の「差(デルタ)」を表示し、その価格でどちらが市場を支配しているかを示します。ボリュームまたはマネーフロー (Money Flow) で表示可能です。 計算モード (Calculation Modes) Pro版の際立った特徴は、期間選択の柔軟性です: Fixed Mode (固定モード): 過去のローソク足の本数を固定で設定します(例:過去100本)。 Dynamic Mode (ダイナミックモード - 注目の機能): 垂直線が表示されます。マウスを使ってこの線をチャート上

Highlights trading sessions on the chart
The demo version only works on the AUDNZD chart!!! The full version of the product is available at: (*** to be added ***)
Trading Session Indicator displays the starts and ends of four trading sessions: Pacific, Asian, European and American. the ability to customize the start/end of sessions; the ability to display only selected sessions; works on M1-H2 timeframes;
The following parameters can be configured in the indicator:
TIME_CORRECTION = Correct
FREE

製品名 Smart ZigZag (MT4) – SmartView シリーズ 短い説明 MetaTrader プラットフォームで独特なユーザー体験を提供する ZigZag インジケーター。以前は利用できなかった高度な機能を提供し、ダブルクリックで設定を開く、削除せずにインジケーターを非表示/表示する、インジケーターウィンドウをチャート全体のサイズで表示するなどの機能を備えています。SmartView Indicators シリーズの残りの部分とシームレスに連携するように設計されています。 概要 SmartView シリーズは、革新的な機能を通じて MetaTrader プラットフォーム上のインジケーターに独特で特徴的なユーザー体験を提供し、インジケーター管理をより速く、より簡単にします。各インジケーターには、チャート上のスマートコントロールパネルが装備されており、基本情報を表示し、すべての重要な機能への迅速なアクセスを提供します。 以前は利用できなかった独自の機能 SmartView シリーズは、インジケーターでの作業をより簡単で迅速にする高度な機能を提供します: ダブルクリックで設
FREE
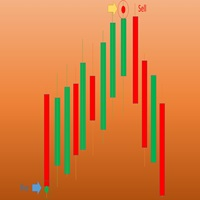
Wave Entry Alerts Oil is a custom indicator developed by Azad Gorgis for MetaTrader 4. This indicator is designed to provide alerts based on ZigZag patterns, specifically tailored for trading on the Oil (XIT/USD) symbol.
Key Features: - Chart Window Indicator: The indicator is designed to be displayed on the main chart window. - Arrow Signals: The indicator generates arrow signals on the chart, indicating potential reversal points based on ZigZag patterns. - Customizable Parameters: Traders ca
FREE
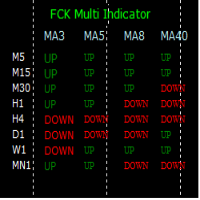
The FCK Multi Indicator for MT4 displays trend direction of multiple indicators on multiple time frames for a pair. So, forex traders can see the trend direction at a snap and trade with confluence of multiple indicators. Furthermore, it helps traders to see the trend in multiple time frames and trade in the direction of the overall market trend. Additionally, it shows the stop loss, pips to stop, pips in profit of any open position. The indicator display is very neat and is very helpful for bot
FREE

Forex Trade Manager Grid MT4 helps you to managing orders and achieve the goal. You only need to place first order with Take Profit, run EA and set in params profit (pips) you want to get. EA will be managing your positions, as will gather appointed amount of pips. It’s a strategy for management of manual trades opened on current pair. The strategy adds positions to currently opened trades in a grid management (with chosen distance in pips between trades) - up to 15 trades (or less). First up to
FREE

This indicator is designed for scalping in the Forex market and trading binary options. A signal appears at the opening of a new candle. Usage Recommendations: For Binary Options: It is recommended to open trades when a signal appears on the first candle. A buy signal appears when the blue X replaces the red one, while a sell signal occurs when the red X replaces the blue one, as shown in the screenshots. For the Forex Market: Enter a trade when a signal appears as described above. It is advisa
FREE

If you like this project, leave a 5 star review. Often times we are using brokers that are outside of the GMT-0 timezone, this
not only complicates things, but, it can make seeing when a trading session starts
a bit more difficult than it should. This indicator allows you to set a timezone offset it will draw a vertical line for the: Day. Week. Month. Quarter. year.
FREE

This indicator is stand alone version from MP Pivot Levels (All in one) containing Demark's Pivots.
Calculations: PP = X / 4 R1 = X / 2 - LOWprev S1 = X / 2 - HIGHprev Uses: When the pair currency price may change the direction of movement. Possible constraints of support and resistance that creates plateaus for the currency pair prices. Tendency identification by comparing the present prices according to current day's pivot point and also the prior day's pivot points. ____________
FREE
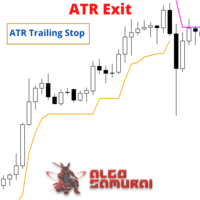
The ATR Exit indicator uses the candle close + ATR value to draw trailing stop lines (orange under buys, magenta over sells) that advance with the trend until the trend changes direction. It uses a multiple of the Average True Range (ATR), subtracting it’s value from the close on buy, adding its value to the close on sell. Moreover, the trailing stop lines are generated to support the order’s trend direction (long or short): In an upward trend, the long trailing stop line (orange line under bu
FREE
The VR Close orders script is designed to close positions in the terminal at a profit or loss mark set by the trader. The program is written as a script and can work together on the same chart with any other indicators and expert advisors. The program has a simple visual panel and is easy to configure with the mouse. With this program's help, the trader can automatically close positions and delete orders depending on the conditions set. There is often a situation when you need to close position
FREE

The indicator rely on The Toby strategy >> The mother candle which is bigger in range than the previous six candles.
A vertical line shows the last Toby Candle with the targets shown up and down. The strategy is about the closing price out of the range of the toby candle to reach the 3 targets..The most probable to be hit is target1 so ensure reserving your profits and managing your stop lose.
FREE

A classical MACD indicator where both the MACD line and the Signal line are displayed as lines. The difference between MACD and Signal line is displayed as a histogram. A user can change the color and thickness of histogram lines. So, histogram lines can be grouped into four different groups: positive ascending, positive descending, negative descending and negative ascending. Multi-currency Dashboard for the indicator is available https://www.mql5.com/en/market/product/72354
FREE

The Buffer Reader will help you to check and export the custom indicators buffers data for your current chart and timeframe. You can select the number of buffer and historical bars to read/export. The data can be exported in a CSV format and the files will be stored in the folder: \MQL4\Files .
How it works Put the number of buffers to read in the Buffers_Total input parameter. Put the number of rows to display in the Rows_Total. Choose the CSV separator in the parameter. Copy the correct name
FREE

このエキスパートアドバイザーは取引を行いませんが、マーケットウォッチ内のシンボル全体をスキャンし、異なる時間枠で各株を 1 つずつスキャンし、最後に、どの時間枠のどのシンボルが強力な巻き込みローソク足を持っているかを示します。
さらに、MA 期間と RSI の上限と下限を定義でき、どのタイムフレームのどのシンボルが調整済み移動平均を超えるか、また、どのタイムフレームのどのシンボルが調整移動平均の上限または下限を超えるかが表示されます。 RSI。
Kono ekisupātoadobaizā wa torihiki o okonaimasenga, mākettou~otchi-nai no shinboru zentai o sukyan shi, kotonaru jikan-waku de kaku kabu o 1-tsu zutsu sukyan shi, saigo ni, dono toki-waku no dono shinboru ga kyōryokuna makikomi rōsoku ashi o motte iru ka o shimeshimasu. S
FREE

The script tries to determine the overall direction of the market, using smoothed Heiken Ashi candles. The coloring system (using bright and dark colors) is an attempt to detect strong market and weak market conditions. There's also an oscillator within the script
These are the features: Alert condition Features: You can now set alerts in the alert dialog for events like trend switch, trend strengthening and weakening; all for both Bullish and Bearish trend.
I also added the code for custom a
FREE

Sometimes there is money to be made in simplicity! The DAX Bull works using a simple moving average both for short and long. It has an advanced order and trailing system which essentially helps in hitting those big wins. This bot is a trend bot and as such expect win rate to be around 40%, expect around 13-20 trades per month. As always, judge more on live signals and your own backtesting! If you have questions just message me on MQL5.
My main selling point as a EA creator? Brutal honesty. I s
FREE

MASi Three Screens is based on the trading strategy by Dr. Alexander Elder. This indicator is a collection of algorithms. Algorithms are based on the analysis of charts of several timeframes. You can apply any of the provided algorithms.
List of versions of algorithms:
ThreeScreens v1.0 - A simple implementation, with analysis of the MACD line; ThreeScreens v1.1 - A simple implementation, with analysis of the MACD histogram; ThreeScreens v1.2 - Combines the first two algorithms in
FREE

Unleashed False Breakout EA strategy trade idea is Support & Resistance key level of price action. Price breakout Support & Resistance than reverse in the zone. Before execute order horizontal line will appear on the key level of Support & Resistance .When there's open order and losses, it will automatically recover the amount of losses on the next execute order as profit. Blue (support) Pink (resistance) Timeframe: M30 H1 Currency:
USDCAD EURUSD XAUUSD *Note on the input take profit in (
FREE

PatternVol EAは、市場の独自の観察に基づいて作成され、パターン、ローソク足分析、ローソク足ボリュームの分析で構成され、EAにはインジケーターが含まれていません。現時点では、アドバイザーは私の非インジケーター戦略の小さなコンストラクターです。各戦略を個別に無効化および有効化するか、複数の戦略からアセンブリを作成できます。アドバイザーの作業は今日まで続いており、新しい戦略が追加され、アルゴリズムが改善されています。将来的には、誰もが独自の取引戦略を組み立てることができる、非指標戦略の大規模なアグリゲーター(コンストラクター)になるでしょう。
* Expert Advisorは、ECNアカウント(5桁)およびH1タイムフレームのEURUSDペアでの使用をお勧めします。
Expert Advisorは、厳密なSLおよびTP設定を使用します。
Test DEMO: https://www.mql5.com/ru/signals/978514
エキスパートアドバイザーのパラメーター
Slippage... -すべりの最大レベル
OnOff ...-戦略を有
FREE

“Gold Miner Robot” is a very powerful AI-Based robot designed and built to accurately analyze the market and trade on gold. Developed by “Keyvan Systems” after more than 3 years of research and development on each tick of the gold chart. "Gold Miner Robot" uses a complex algorithmic approach based on price analysis, trend analysis. We have also provided two other personalized indicators called "GoldMinerRobot SI 1" and "GoldMinerRobot SI 2" for better market analysis, which you can download free
FREE

"IF YOU'RE LOOKING UNIQUE TRADING INDICATOR… AT AN AFFORDABLE PRICE… YOU'VE COME TO THE RIGHT PLACE!" Additional bonus: You get the Forex Trend Commander Indicator absolutely free! Successful traders can turn any not-so-good trading system into a profitable one by using proper money management! With two built-in systems DayTradingArrow v1 generates a high percentage of successful trades. The indicator gives an incredible advantage to stay on the safe side of the market by anyone who uses it.
B

This indicator provides common shapes as drawing object options. The shapes are rotatable, resizable, draggable, and will keep their proportions (according to their handle trendline) across different chart scales. Multiple drawings are supported.
Shapes: Square Rhombus
Triangle (quadrilateral & isosceles) Circle (grid, overlapped grid, flexi grid, rotatable grid, concentric circles) Features: rays (all object edges will be rays) show/hide each individual drawing type, or all delete last drawn ob
FREE

EURUSD H1 Simple Martingale that works on daily swing levels, low DD, TP and SL defined on the basis of certain pre-set calculations in the algorithm, executes one trade at a time, weekly trading no overnight on weekends, possibility to establish customized exit times, possibility of customize money management. average return of 7.92% per year with the factory settings of the V1, it is always constantly updated, it is recommended to use it with a GMT +2 server TESTED SINCE 2003
Happy trading
FREE
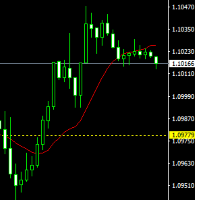
The indicator draws lines (with line objects) to the close prices of the previous day close, on selected timeframes. The indicator uses the closing price of the past day to draw a horizontal line, it can help you determine the direction of the market at the moment, which is necessary for making trades.. Parameters
Line Color Line style Line width Set on the top
FREE

Designed to mark a specific price and time point on an MT4 chart based on a single mouse click, synchronizing this data across all timeframes for the same symbol. Its primary purpose is to help traders pinpoint and track critical levels or events (e.g., support/resistance or entry points) with persistent visual markers. The indicator uses dashed lines for price and time crosshairs, accompanied by labels that dynamically adjust to stay within chart boundaries, ensuring clarity regardless of win
FREE

Limited time offer! For the launch of NextBot Scalper EA , the price of this indicator will drop to FREE !
Introducing a pragmatic and innovative tool for MetaTrader 4 (MT4) traders: the Linear Regression Next channel indicator, enhanced with the determination coefficient R 2 . This indicator serves as a foundational tool for traders seeking to understand market trends through the lens of statistical analysis, specifically linear regression.
The essence of this indicator lies in its ability t
FREE

STM Trade Panel MT4で取引を簡素化しましょう。このユーザーフレンドリーなエキスパートアドバイザー(EA)は、MetaTrader 4での取引実行と管理を効率化するために設計されており、ワンクリックでの注文配置とカスタマイズ可能な利益および損失閾値に基づく自動取引クローズを提供します。MQL5、Forex Factory、Redditのr/Forexで直感的なインターフェースと効率的な取引管理により高く評価されており、このEAは外国為替、指数、暗号通貨などのボラティリティの高い市場でスキャルパー、デイトレーダー、スイングトレーダーの主要なツールです。ユーザーは、取引実行時間が40〜60%削減され、リスク管理が改善されたと報告しており、多くの人が迅速な設定と利益ロック機能を持つシンプルなパネルを称賛しています。使いやすさを求める初心者トレーダーや複数の取引を管理するプロフェッショナルに最適なSTM Trade Panel MT4は、さまざまな取引戦略において効率と規律を向上させます。 STM Trade Panel MT4は、ワンクリックの購入/売却ボタン(ButtonB
FREE
MetaTraderマーケットはトレーダーのための自動売買ロボットやテクニカル指標を備えており、 ターミナルから直接利用することができます。
MQL5.community支払いシステムはMetaTraderサービス上のトランザクションのためにMQL5.comサイトに登録したすべてのユーザーに利用可能です。WebMoney、PayPal または銀行カードを使っての入金や出金が可能です。
取引の機会を逃しています。
- 無料取引アプリ
- 8千を超えるシグナルをコピー
- 金融ニュースで金融マーケットを探索
新規登録
ログイン