 MetaTrader 5
 エキスパート
 インディケータ
 ライブラリ
 ユーティリティ
 ウィジェット
 ルール
YouTubeにあるマーケットチュートリアルビデオをご覧ください
ロボットや指標を購入する
仮想ホスティングで
EAを実行
EAを実行
ロボットや指標を購入前にテストする
マーケットで収入を得る
販売のためにプロダクトをプレゼンテーションする方法
MetaTrader 4のためのエキスパートアドバイザーとインディケータ - 48
 自動売買ロボットは市場取引を自動的に実行しますが、インジケータを使用すると、相場をより適切に分析し、価格行動を予測できます。
これらのアプリケーションを使用すると、より多くの機会を獲得しながら、より多くの情報に基づいた方法でMetaTrader4で取引を実行できるようになります。
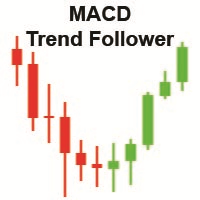
The "MACD Trend Follower" is an indicator based on the MACD oscillator. It serves to spot the trend direction by giving it a fixed color until the trend changes (the trend direction colors are customizable). The default MACD settings for the indicator has been changed to adapt to the fast moving Forex market, but they can be changed to suit the trader.
Recommended settings for the indicator : - MACD Fast EMA : 8 Periods. - MACD Slow EMA : 13 Periods. - MACD SMA : 5 Periods.
Indicator inputs :
FREE

このインジケーターは、トレンドの方向とトレンドの転換を示します。 Ganesha Trend Viewerは、GOLD(XAUUSD)専用に設計されたトレンドフォローのインジケーターですが、その他のあらゆる金融商品で使用することもできます。 インジケーターは後で描画し直すようなことはしていません。 推奨する時間足(Timeframe)はH1です。 Ganesha Trend Viewer は、すべてのMeta Traderでサポートされるシンボルで使用できます。 (通貨、金属、暗号通貨、株式、インデックス..)
パラメタ設定
MA Short Period ----- 移動平均 短期間 MA Long Period ----- 移動平均 長期間 Alerts ON ----- アラートオン Mobile Notification On ----- モバイル通知オン
FREE

RSI indicator with signal lines, at the intersection of which a corresponding notification will be issued, which can be in the form of a normal alert, or in the form of a user sound file.
The indicator also has the function of sending push-notifications and email notifications at the intersection of these levels.
The values of the levels can be set independently in the indicator settings, and, if desired, they can be changed and configured directly in the indicator window. To check the oper
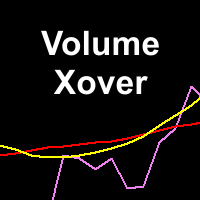
This indicator determines minimum volumes needed during a candle formed so that it would be higher than current volume's average. Although you can place MAs on your volume indicator, this indicator has non-repaint characteristic so you may not to worry about sudden volume increase. This indiator also draw volume indicator for its own. Input Description: period: Period used for indicator. Must be higher than 1. Output Description: VolumeXover: This indicator's main feature. During the time the vo
FREE

"Giant" is a flexible system in relation to trading strategies. It consists of two high-quality indicators that are installed on five different timeframes of the same currency pair (see screenshot). It monitors the trend and gives signals to open. The system passed a large number of checks and showed high accuracy. Indicators are sold separately. The second word in the main name is the indicator itself. This issue sells the indicator "Attention" .
FREE

Powerful non-repainting tool for intraday or swing tading, part of the Power Lines Trading System, used in real trading on a daily basis with proven solid trading signals. The Power Lines indicator is pretty straightforward and easy to set up and can be used perfectly on every timeframe and with every currency pair or other financial instrument. For intraday trading the using of M5, M15 or M30 timeframes and for swing trading H1, H4 or D are recommended. Avoid M1 and be careful with M5 timeframe
FREE

Reborn — A Trend Robot With Strategies Built In
Reborn is a trend-following trading robot built on the Investment Castle Indicator, with several ready-made strategies inside so you can match it to your style — from straightforward stop-loss and take-profit to kill-and-switch direction changes with recovery.
What it does for you Multiple built-in strategies: choose the approach that fits your market and risk appetite. Trend-driven entries: powered by the Investment Castle Indicator. Smart recov
FREE

The trading strategy bases on MACD signal and confluence of trends on multiple time frames. It supports martingale, smart trade and many options so that you can setup their own trading strategy from the basic one. Look for new idea, improve trading performance by yourself without limitation.
Outstanding Features Martingale trading : turn on/off martingale strategy. When you find out a parameter set which has a small value of maximum continuous loss, you can consider to turn on martingale mode t
FREE
YOU CAN NOW DOWNLOAD FREE VERSIONS OF OUR PAID INDICATORS . IT'S OUR WAY OF GIVING BACK TO THE COMMUNITY ! >>> GO HERE TO DOWNLOAD
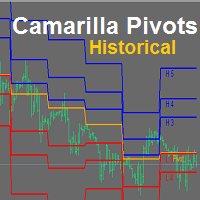
Camarilla Pivots Historical plots the historical data of the camarilla pivot point levels on the chart. The Camarilla Pivot levels was originated in 1989 by Nick Scott. The levels are used as primary support and resistance levels by Intraday traders. The levels are calculated with the following formula: R4 = C + RANGE * 1.1/2 R3 = C + RANGE * 1.1/4 R2 = C + RANG
FREE

FREE EDITION! ~paid edition no longer available. may be updated and re-added in the future~ This expert advisor is used to automate one or more commonly used trading strategies. Currently available strategies: -Moving Average Crossover -MACD Cross over 0 line -MACD Cross over Signal - PAID EDITION ONLY -Moving Average Crossover with MACD Signal cross - PAID EDITION ONLY -Bollinger Band Cross - PAID EDITION ONLY
-CCI Filter for each of the above strategies. - PAID EDITION ONLY -StochasticFilter
FREE

This EA implements the EMA 8/18 strategy, which is used by many traders. Brief description of the strategy: The Buy is determined when the EMA 8 indicator crosses the EMA 18 from below, with the price moving more than 50 points from the crossing. The buy position is opened when the price touches the EMA for the first time, after that, as the price rises, the trade is maintained by a trailing stop with a step of 30-35 points. The opposite is for opening a sell position. The parameters of the fast

This EA trades the forex markets by a specific combination of ATR and parabolic SAR indicator signals and transaction management. the EA has stop loss and take profit. minimum trading account 500.
default settings for GBPUSD 1h. settings for optimization: ATRperiod lot sarStep sarMaximum tpFactor slFactor this EA(){ operates once per bar; fast methods of optimization are valid(){ user can optimize by model (control point); || (open prices only); }}
developed, tested and optimi
FREE

This Expert Advisor is designed for news trading. This version is the free version for MT4. The amount of news to handle is limited to 5 news in USDPY (0.01 Lot). Please find below the other versions of this expert (The Pro versions have not limitations) : News Advisor MT4 Pro. News Advisor MT5 Pro. News Advisor MT5 Free. The main advantage of this expert is that it’s offering backtesting capabilities (something that is not found in most news expert advisors). This ability gives you the opportun
FREE

RSI TrendGate 3MA は、RSI と 3本の移動平均線(MA)を組み合わせて、相場のトレンド方向を確認しやすくするためのチャート表示インジケーターです。
トレンド方向が一定条件で「上昇寄り」「下降寄り」と判断できる状態になったときに、チャート上へ矢印を表示します。 本製品は、矢印を単独の売買サインとして使用する目的ではありません。推奨する使い方は、上位足でトレンド方向を確認し、下位足ではユーザー独自のルールでエントリータイミングを判断する運用です。 概要 本インジケーターは、次の要素で方向判定を行います。 3本MAによるレジーム判定(方向の土台)
短期・中期・長期の3本MAを計算し、並び順で相場状態を分類します。
上昇レジーム:短期MA > 中期MA > 長期MA
下降レジーム:短期MA < 中期MA < 長期MA
その他:レジームなし(MAが絡んでおり方向が明確でない状態) 短期MAの傾きフィルター(任意)
短期MAの傾きを、指定シフト間の差分で確認します(例:Shift1 と Shift3)。
一定以上の傾きがある場合のみ方向判定を有効にでき、横ばいに近い局面を除外し
FREE

こんなお悩みはありませんか? ロット計算を手でやるのは、時間がかかって面倒ではありませんか? 通貨ペアが増えるほど、手間も増えていませんか? 損失の上限を割って口座を失うのが怖くありませんか? 口座を失うたびに、前より心が折れそうになっていませんか? 私自身がこの繰り返しに苦しみました。自分のために作ったツールです。 この製品について 本製品はインジケーターです。注文機能は一切含まれていません。
注文を出す・変更する・決済する、いずれもできません。
MetaTrader 4 版です。 チャート上の損切りラインをドラッグするだけで、口座残高とファームの損失上限からロット数を計算します。 できること 損切りラインをドラッグすると、ロット数がその場で更新されます ラインの位置から売買方向を判定します。価格より下ならBUY、上ならSELL。
パネルに表示します 利確プレビューライン(任意・初期設定はオフ)。
「Show the TP preview line」をオンにすると、Risk-Reward の設定から自動配置され、損切りラインを動かすと連動します 損失額を口座通貨で表示
FREE

Based on a combination of indicators, PS Acid Fulx is an excellent indicator for knowing when to buy or sell on any asset and temporaryity. The indicator myself I have used it as a tool for my analysis when trading Forex. It is a useful and easy-to-understand trend indicator. If you combine it with your own analyses you will surely get a good result in your operation.
FREE

「セットして忘れるだけ」の多通貨対応リスク管理マネージャー ️ トレードを無防備なままにしないでください。 Auto Stop Loss (MT5 Manager) は、安全性を最優先するトレーダーのための究極のバックグラウンド・ユーティリティです。通常のパネルとは異なり、このツールは舞台裏で絶え間なく動作し、エントリーしたすべてのトレードを即座に保護します。裁量トレードでも、他のEAによるトレードでも、このマネージャーはすべてのポジションに即座にハードストップロス (Stop Loss)、テイクプロフィット (Take Profit)、および動的トレーリングストップ (Trailing Stop) を適用します。 ゲームチェンジャー: たった 1つのチャート からポートフォリオ全体を管理します。10個ものウィンドウを開いてPCを重くする必要はありません。お気に入りの通貨ペアをリストアップするだけで、このマネージャーがそれらすべてを同時に監視します。 [ Get the MT5 Version Here ]
主な機能 マルチシンボル管理 (CPU節約
FREE
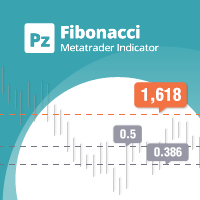
Are you tired of plotting fibonacci retracements or extensions manually? This indicator displays fibonacci retracements or extensions automatically, calculated from two different price points, without human intervention or manual object anchoring. [ Installation Guide | Update Guide | Troubleshooting | FAQ | All Products | Get Help ] Easy to use Manual anchoring is not needed Perfect for price confluence studies The indicator evaluates if retracements or extensions are needed Once drawn, yo
FREE

Squeeze and Momentum Indicator Indicator — Version 1.0
The Squeeze and Momentum Indicator is designed to highlight periods of low volatility followed by potential expansions in market activity. It combines Bollinger Bands and Keltner Channels to identify “squeeze” conditions and uses a momentum histogram to estimate the likely direction of the move once volatility expands.
How it works: A squeeze occurs when the Bollinger Bands contract inside the Keltner Channels. This condition is marked wit
FREE

Dynamic Trend Follower メインチャートインジケーター深層解析:デュアルMA変色 + ゴールデンクロス/デッドクロスマーカー + 売買シグナル + トレンド転換 + ストロングクロス インジケーター概要 Dynamic Trend Followerは、 MT4プラットフォーム 専用に設計された高品質メインチャート移動平均クロス総合シグナルインジケーターです。従来の単一移動平均線やシンプルなクロスの限界を突破し、 デュアルMAトレンド変色システム 、 クロス"+"マーカーと差値パーセンテージ 、 売買シグナルアロー 、 トレンド転換プロンプト 、および ストロングクロス認識 を統合し、MA状態判定と多層シグナル注釈メカニズムと組み合わせて、マーケットのトレンド方向、クロスバーストポイント、および主要な反転警告をメインチャート上に視覚的に表示します。その核心的価値は、多次元MAアルゴリズム融合とシグナルフィルタリングメカニズムを活用して、トレーダーが複雑な市場環境で高確率のトレンドフォローおよび反転チャンスを正確に識別するのを支援することにあります。 1. コア信号シ
FREE

Salva EA Free is an advanced and fully automated system, which passes backtesting since 2005. The basis of this strategy is the price chart itself, trading is performed based on the price movement range. Dynamic algorithms and filters are used for taking profit or closing trades. Built-in reworked system for filtering market entries and exits: Checking the trading direction using integrated trend indicators. Checking the channel range for the minimum and maximum values. Checking for the price ex
FREE

Sniper Trend Fusion This indicator is a powerful all-in-one trading tool designed to simplify chart analysis and improve decision-making. It combines multiple proven techniques into a single system, helping traders identify trend direction, volatility, key price levels, and market structure without clutter.
Instead of switching between multiple indicators, everything you need is integrated into one smooth and efficient interface. Key Advantages All-in-One System
Combines trend, volatility, sup
FREE

Ea Stepperは、mt4プラットフォーム用の完全に自動化されたExpert Advisorで、短期、中期、長期の戦略に使用できます。戦略は、ボラティリティが非常に低い期間を探して、日次トレンドの方向にエントリを配置することです。トレンドの方向が変化し、未解決の取引が不採算であることが判明した場合、ロットが増加した取引は反対方向に開かれます。
提供される条件:
スプレッドと手数料が可能な限り低いECNアカウント
ヘッジ口座レバレッジ500:1
VPS提供
1000ドルの最低預金が提供されます(少ない金額で使用できます)
入力パラメーター(最初にIN_ALL_CAPITALSパラメーターを最適化することをお勧めします):
MaxLotSize:取引の最大ロットサイズ。ブローカーの最大ロットサイズから分離できます。
MaxSpread:スプレッドがこれよりも高い場合、ピップはトレードされません。この値をブローカーのアドバタイズされた平均スプレッドに設定することを強くお勧めします。
MagicNumber1:アカウントの他のエキスパートアドバイザーとの取引を区別します。
FREE

Emulate TradingView drawing experience with magnet snap to the nearest price.
Supported drawing tools: Vertical Line Horizontal Line Trend Line Horizontal Ray (Angle Trend Line) Fibonacci Retracement Rectangle
Input:
Threshold (px) : The distance in pixel unit to snap the crosshair to the nearest price. Crosshair color: The color of crosshair.
Feel free to write the review, request more features or report bugs.
FREE

Many traders use The Bull-Bear Indicator, I decided to combine the two into just one, so the visualization is better, and I am sharing it with you. the trading rules remain the same, you can adjust the period as per your preference.
The Bull-Bear Indicator is a free indicator with several versions widely published on the internet, this is just a version that I put together, I hope you like it. If you want to know the indicators of my authorship, please visit my page here .
FREE

FREE
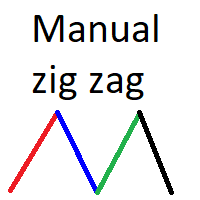
Manual Zig-zag allows you to build a zig-zag with the mouse, to build it is necessary to turn on the zig-zag and left-click. The file must be placed in the \ MQL4 \ Indicators folder then in the terminal from the list of indicators put it on the chart.
A zigzag can be built so that this zigzag can only be seen on the current time frame or in all halves at once.
You can change the color and thickness of the line while on the chart without getting into the settings.
You can quickly remove each
FREE

Average Price Plus is an essential indicator for day-to-day operations. With it, you can graphically check the average price between several open orders on your chart. The average price is the breakeven point between your orders. In addition to the average price, the indicator also shows you the number of pips and the financial value resulting from your open orders, the percentage gains, the number of lots in operation and the number of open orders. Negative values in "pips" or in financial val
FREE

EURJPY Ichimoku–TEMA Breakout (H1) is a fully automated MetaTrader 5 strategy designed to capture **confirmed trend breakouts** on EURJPY using an Ichimoku cloud direction filter with rule-based **pending STOP execution** around a TEMA reference level adjusted by volatility. The EA was backtested on **EURJPY on the H1 timeframe** from **January 2, 2015 to August 22, 2025** using a **MetaTrader 5 (hedged)** backtest engine. No parameter setup is required — the system is delivered with optimized
FREE

This is simple indicator for displaying Multi Moving Average line in chart, with one single Indicator. Just place the indicator in your chart, select how many MAs you want to display. And you are ready to go. Parameters can be changed on the fly by the control panel provided by the Indicator. This indicator are still in development, if you have any further feature request, please let me know in the comment.
FREE
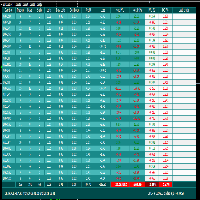
FCK Trade Report This indicator was developed by Fx Candle King. BEFORE CHOOSE CUSTOM PERIOD, GO TO TERMINAL WINDOW (ctrl+T), right click on ACCOUNT HISTORY and CHOOSE ALL HISTORY. This report searches the filtered data in your ACCOUNT CURRENT & HISTORY TRADE, Select your timespan for the report open and closed trades etc... Chose the report type - List only OPEN orders / List only CLOSED orders / List both OPEN and CLOSED orders
FREE
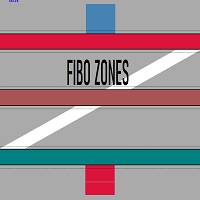
Индикатор предназначен для разметки ,фибо уровней и фибо зон.Также есть возможность удаления и редактирования уровней на текущем графике. При установке нескольких индикаторов (FIBO-ZONES)на график,не забывайте менять имя в поле (NAME).В утилите также есть возможность менять цвет зон, толщину линий и стиль линий уровней фибо. При установке индикатора ,зоны выстраиваются автоматически.
FREE
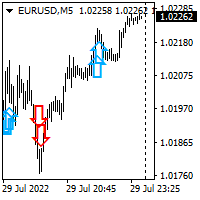
Hello all. This indicator helps you to open a trade, when break out occurred, also you can add to your position and ride it if trend continued. I use it on 1-5 min chart, as you can use short stop loss. Also profit target should be small as well. It is better to enter few small position, so you can book some profit early and ride the rest for bigger gains. Look at the past to have a plan. Enjoy.
FREE

Hypothetical trend line display
Distance from the trend line
Can be used in all symbols
Can be used in all time frames
An interesting indicator for predicting small waves
The greater the distance from the trend line, the more likely it is to return to the trend line
Settings:
The first three(osic 1,2,3):
are the same as the settings of the zigzag indicator
The bigger these numbers are, the bigger the trend lines and the longer the trend
Back Show:
The number of candles displayed
Clr1,2:
The
FREE

Советник работает на пересечении двух Moving averages рассчитанных по ценам Open и Close. Но несмотря на простоту показывает неплохие результаты. Параметры: Time frame — Период для расчёта Moving averages Period MA — Период усреднения Moving averages Method MA — Метод Moving averages Lot — Размер контракта Step averaging — Шаг усреднения позиции Take profit — в пунктах Magick number —
FREE

It's a simple but useful tool for creating a grid based on Envelopes.
Only 2 parameters can be set: 1) "Period" - the period of all visible Envelopes (i.e. 4) and 1 Moving Average (Envelopes axis), 2) "Deviations Distance" - the distance between Envelopes.
Naturally, the colors of all 9 lines can be changed as desired. It works with everything that is available in your Market Watch.
Good luck!
FREE

Trend is Friends is an line Indicator used as an assistant tool for your trading strategy. The indicator analyzes the standard deviation of bar close for a given period and generates a buy or sell trend if the deviation increases. It good to combo with Martingale EA to follow Trend and Sellect Buy Only/Sell Only for EA work Semi-Automatic. You can use this Indicator with any EAs in my Products.
FREE

Short Description Statistical Support & Resistance zones with probability-based strength ratings. Automatically identifies key price levels where the market has historically reacted. Historical Level SR Historical Level SR automatically detects significant Support & Resistance zones using statistical analysis of historical Daily pivots. Instead of relying on subjective chart drawing, the indicator evaluates each zone using real H1 market behavior, measuring how often price interacted with the le
FREE

Action Scanner is a market scanner. It’s yet another product in my "Can’t trade with out it" series. Do you want to know what is moving right now? Action Scanner scans your watchlist and opens the 10 currently most moving charts. You can chose between, most moving in points, most moving in your account currency(if you were to trade it with a standard lot size 1.00) and most moving in percentage. The standard version is a complete tool with no limitations. However the pro version has additiona
FREE

Easy to use, fully automated neural network trading robot. Works on the H1 timeframe with two currency pairs (AUDCAD, USDCAD). Limitations of the free version - only two currency pairs support (7 in the full version) and 0.01 lots max order size.
Minimal recommended deposit size: with grid enabled - $150 per symbol; with grid disabled - $100 for all symbols.
Parameters Instruments - currency pairs to trade; Order size calc method - type of the calculation of the order size; Fixed order size -
FREE
As per name Strength, This Indicator is a affordable trading tool because with the help of Popular Developers & Support of M Q L Platform I have programmed this strategy. I tried to input different types and different periods of Calculation regarding Support Resistance, Trends, Trend lines, Currency Strength, Oversold and Overbought Indications for good results. Furthermore, I have also care about Adjustable Settings So Trader can easily get in touch with market in another way also. What
FREE
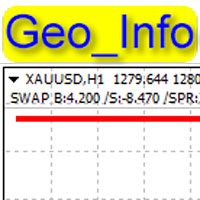
Geo_Info is one of the most informative indicators displaying net levels as well as basic data on a symbol and trading positions in a space-saving manner. displays brief data on the basic symbol parameters in the upper left corner of the chart: Swap for Buy order, swap for Sell order, current spread, margin, tick size, stop level, order freeze level . The data is shown for one lot in points. The data is displayed as follows: SWAP B:4.200 /S:-8.470 /SPR:342 /MRG:256.0/TCV:0.10/STL:0/FRL The data
FREE

Time Based Close - Automated Trade Management EA Overview
Time Based Close is a powerful and user-friendly Expert Advisor (EA) designed for MetaTrader 4 (MT4). It automates trade management by closing positions based on a user-defined holding time, while also protecting your account with a dynamic drawdown control feature. Whether you're a beginner or a seasoned trader, this EA simplifies your trading strategy and helps you manage risk effectively. Key Features Time-Based Closing : Automatical
FREE

Perseus is a free Expert Advisor for GBPJPY . It based on MACD and Bollinger Bands . It has been tested for 10 years of history (from year 2011). Tested by Monte Carlo with 200 simulations too. All trades are cover by StopLoss . Doesn't use Martingale or other dangerous startegies. Perseus using fixed lot size, which you can set in settings. Perseus settings are optimized for the best results . There is no need to change it.
Recommendations Symbol: GBPJPY Timeframe: H1 Deposit: 300 USD Br
FREE

This indicator helps you to scan all symbols which are in the Market Watch window and filter out a trend with alerts. It works on five most effective indicators which are used by most of traders for trading: Moving Average Average Directional Moment (ADX) Relative Strength Index (RSI) Parabolic SAR MACD It calculates two bars for scanning. When box colour changes to coral or royal blue colour, it indicates you for trend change for long and short entry. And also you will get alert on screen. When
FREE

Most performance stats live scattered across the terminal's History tab — win rate isn't shown anywhere, profit factor needs a calculator, and there's no clean way to hand a summary to a prop firm, a signal subscriber, or your own records. Trade Report Generator reads your account's closed-trade history directly from the terminal and turns it into two things: a live on-chart summary panel, and a one-click, fully self-contained HTML report you can open in any browser or print straight to PDF. On-
FREE
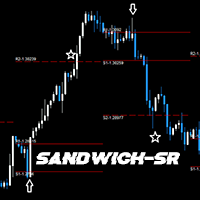
GENERAL DESCRIPTION
Simple SR Projection based on selected instrument's historical data. Best used in conjunction with current market sentiment, and fundamental analysis. Currently limited to selected pairs due to of historical data to project accurate levels.
Generally, for support and resistance, 2 levels are drawn, respectively. The inner levels (R1,S1) project the highs and lows during the opening stages of selected time frame. The outer levels, represent the targets to reach during the clo
FREE

Discover our brand new trading robot, IT Fractals EA , a revolution in the world of automated trading. Our EA pushes the boundaries by utilizing the fractals indicator for exceptional performance.
Key Features :
Fractals Strategy : IT Fractals EA stands out by adopting an innovative strategy based on the fractals indicator. This clever approach allows you to pinpoint market reversal points with precision, thus identifying optimal trading opportunities. Advanced Management : Our EA comes equip
FREE

The Tarantulas expert Advisor is a night scalper and a robot for position trading at the same time.
Thanks to deep settings, this expert Advisor becomes an indispensable assistant in trading.
On the basis of this EA, you can implement dozens or even hundreds of profitable strategies.
Smart position tracking and time trading functions are enabled.
Trading is performed on pullbacks from overbought and oversold zones on trend changes.
The trend is determined using the author's "Providec Trend
FREE

Panel Tool – Button Click Trading (Replaces Default Trade Panel)
Features
1. Open or close Long positions with a button click.
2. Open or close Short positions with a button click.
3. Set lot sizes.
4. Set Stop-Loss (SL) or Take-Profit (TP) points (0 = not used).
5. Set order comments.
6. Display the Break-Even price .
7. Show total Long and Short lot sizes.
8. Display Profit or Loss in USD.
9. Show daily Profit or Loss in USD.
10. Set ID = 0 to manage manual orders together .
FREE

The MA ribbon is not a single indicator but rather an overlay of multiple moving averages (typically four to eight or more) of varying lengths plotted on the same price chart. Visual Appearance: The resulting lines create a flowing, ribbon-like pattern across the price chart. Components: Traders can use different types of moving averages, such as Simple Moving Averages (SMA) or Exponential Moving Averages (EMA), and adjust the time periods (e.g., 10, 20, 30, 40, 50, and 60 periods) to suit t
FREE

This indicator allows you to manipulate the visibility of the chart in real time. The right side is hidden from the user. The virtual timeline can be moved to any place on the chart. Also, the indicator works on a closed market. If you are using visual analysis for trading, then this indicator is a great tool to test your strategy. It will allow you not to peep into history and be honest with yourself in analysis.
Good luck!
FREE
Trade Signals & Session Bias in one tool. Detects Asia, London & NY session trends, shows bias strength, alerts bias flips, and plots entry/SL/TP levels with R:R. Simple dashboard for quick decisions. Simple but powerful trading assistant. This indicator automatically detects the market bias during the Asia, London, and New York sessions .
It helps traders stay on the right side of the trend, avoid neutral zones, and catch bias flips with alerts. Bias Detection – Shows session bias as
FREE

This expert Advisor is a more developed version of News Hunter Bot OneTime . The EA places pending orders BuyStop and SellStop before the news release at a specified distance from the current price. The date and time of the news release is set in the EA parameters for a few days in advance. In total, you can set the time for 20 news. Also, the EA indicates how many minutes before the news you need to place pending orders and after how many minutes you should remove pending orders that have not

HOT Predator IQ7 – トレーディングにおけるスマートハンター 無料版 – プレミアム版に移行する前に、自分の本能を確かめよう 手頃な価格のパワー。プレミアムなインテリジェンス。100% 無料でお試しいただけます。 「HOT Quantum IQ7 8 Symbols」の プレミアムバージョンをご覧になったことがある方は、ぜひご覧ください。(マーケット/プロダクト/153368)そして「EA Quantum IQ7 ALL in ONE」のプレミアムバージョン もご覧ください 。(マーケット/プロダクト/153369)
この 無料エディションは、 完全なプロフェッショナル スイートにアップグレードする前に、ビジュアル マーケットハンティングの技術を探索、学習、習得できるように作成された ゲートウェイ エクスペリエンス です。 ------------------------------------------------------------------------------------------ コンセプト HOT Predator IQ7 は単なるインジケータ
FREE

This SMART Expert Advisor trades SAFE and STEADY a nd manages all position's risk.
This is why we call it Smart Safe Steady .
Features Scalper: It is Scalper EA, but does not accept risk a lot to trade over sized, although you can bypass it's default setting in your own risk. Conservative: It is not going to keep trades open in high volatile market so it is SAFE and would close the trades even in zero profit. Martingale: This is not loss accepting so in case of loss, it runs special type of Mar
FREE

ArrowForce MAD — вход в рынок без лишнего шума! Умный индикатор, который: Не перерисовывается Работает в тестере Даёт чёткие сигналы BUY/SELL Использует проверенные алгоритмы: ️ EMA10 / EMA20 ️ Полосы волатильности (SMA + StdDev) ️ MAD-фильтрация для отсева слабых сигналов ️ Alerts и Push-уведомления Идеален для: M5–H1, трендовой и коррекционной торговли.
FREE

Multi currency ai trading bot for mt4 it is rich of parameters like equity control , tp and sl in different option like money and pips also drawdown control risk control trading timing and lot size in detailed options also closing control for trades supported with nice control panel with many options you can make your parameters as you wish that ea work with any pair any frame also any equity you can adjust that in equity balance
FREE
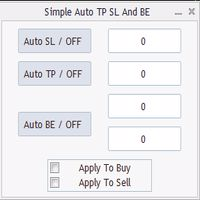
Program for automatic placement of stop loss and take profit orders. Values are calculated as points distance from open price. BreakEven option is also included. all options could be applied to BUY, SELL separately or together. Enter values in points in the fields on the right side of the menu and press dedicated button to aplly your settings.
If in doubt, The instruction is displayed in the tooltip.
FREE
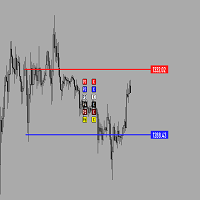
Утилита предназначена для создания ценовых уровней на графике.Утилита имеет панель управления с кнопками ,для создания и удаления ценовых уровней.При создание уровней ,также на экране появляются ценовые метки с прямоугольной зоной в области цены ,для лучшего зрительного восприятия.Также в утилите имеются настройки,толщины линий ,стиля линий и цвета линий.Размеры меток также можно измерить в настройках.
FREE

I decided to list it for free. Combined Informer of DeMarker with RSI MTF. Each parameter can be change values in menu. it is good for scalping or for weekly trading and looks as universal fx-toy. Now I use it for BTC, ETH, BNB. In menu you can turn on daily percentage gain info, weekly and monthly gains also included as informers. Short ATR helps to determine when price was slow/stopped and entry for pulse pump/dump. The filter of numbers of RSI can be tuned for overbought/oversold values w
FREE

Simple trading system that uses the boundaries of Bollinger bands to enter trades. Trades are closed when price reaches the other boundary of the band. The goal of the system is to average out in profit after consistent trading.
The system is intended to work 100% hands free and is very customisable. For optimal results lot sizes should not be too large on low capital accounts.
FREE

Check out other great products from https://www.mql5.com/en/users/augustinekamatu/seller
This indicator finds the entry points based on divergences of common indicators and does not repaint . The principles used ensure that it can be used on CFDs, Commodities and Stock with incredibly great results. With proper money management and portfolio balancing the Indicator can be applied to any trading strategy to generate consistent profits. A Winning Trading Strategy This article describes the com
FREE

**Exit Manager — trail and close your trades by rule**
Exit Manager takes over the exits on trades you already have open. You open positions however you like — by hand, from a signal, or from another EA — and this one manages them out with three rules you can mix: a peak-based Trailing Take-Profit, a Time-in-Trade close, and an ATR-trailing stop.
Exit-only EA: it never OPENS trades; it manages and closes existing ones.
MO トレーディングツールシリーズの一部です。マーケットで「MO」を検索すると、他の無料・有料ツールをご覧いただけます。
https://www
FREE
説明
Volatility ATR Crossover Histogram は MetaTrader 4 用のインジケーターで、高速 ATR と低速 ATR を比較することでボラティリティの拡大と収縮を測定します。結果は別ウィンドウのカラーヒストグラムに表示されます。緑色のバーはボラティリティ上昇局面を示し、赤色のバーはボラティリティ低下局面を示します。エントリータイミング、トレード管理、市場環境の検出に役立つユニバーサルフィルターとして設計されています。 動作原理
このインジケーターは、カスタマイズ可能な期間で 2 つの ATR を計算し、その差を描画します。高速 ATR が低速 ATR を上回ると、ヒストグラムは正となり緑色になります。高速 ATR が低速 ATR を下回ると、ヒストグラムは負となり赤色になります。これによりボラティリティのレジームシフトが強調され、ブレイクアウトトレード、トレンドフォロー、平均回帰戦略に有効です。 トレードシグナル
緑のヒストグラムがゼロ以上 → ブレイクアウトやトレンド継続に適した市場。
赤のヒストグラムがゼロ以下 → レンジ相場、押し目、
FREE
High, Low, Open, Close — isn't this too much? Sometimes you need a unique history of prices. But if choose one thing, you lose the rest. Smoothing also leads to data loss. Often you lose one of the most important market details: information about extremes. It is due to the preservation of information about the highs and lows, the correct "smoothing" for the history of price is a zigzag. But zigzags also have drawbacks — they do not provide intermediate values. The Price Line indicator solves thi
FREE

The indicator allows you to trade binary options. The recommended time frame is М1 and the expiration time is 1 minute. The indicator suitable for auto and manual trading. A possible signal is specified as a arrows above/under a candle. You should wait until the candle closes! Arrows are not re-painted Trade sessions: TOKYO section (Half end) and LONDON section (First half) Currency pairs: EUR/USD Working time frame: M1 Expiration time: 1 minute. The indicator also shows good results when using
FREE

Ska ZigZag Line indicator determines the overbought and oversold regions within a trend. The indicator determines the overbought region by the candlestick high and the oversold region by the candlestick low in a form of a line. To utilize the full strategy i recommend using "Ska ZigZag Line" together with "Ska ZigZag BuySell". NOTE: This indicator is a line based indicator. HOW TO USE: Sell Signal; Place a sell trade when the Ska ZigZag BuySell indicator arrow appear on top of the Ska ZigZag Lin
FREE

The indicator is a multifunctional tool for automating the analysis and visualization of the trading process. Main features:
News display — the indicator automatically loads and displays economic news on the chart, allowing you to take into account important events when trading. Dynamic timeframe change — during the news release, the chart switches to a preset period for more detailed analysis. Adapting to the number of orders — the timeframe can change automatically depending on the number of
FREE

AR Canada is a fully automated trading robot optimized for USDCAD H1. This free version trades only a fixed lot with minimum volumes. No hedging, no martingale, no grid, no arbitrage, etc. The EA applies the trading algorithm based on crossing the moving averages. Take Profit and Stop Loss values are fixed and have a ratio of 1:4. Positions are closed by the EA when Take Profit or Stop Loss level is reached.
Parameters MagicNumber = 3 - unique EA magic number.
FREE
MetaTraderマーケットは、履歴データを使ったテストと最適化のための無料のデモ自動売買ロボットをダウンロードできる唯一のストアです。
アプリ概要と他のカスタマーからのレビューをご覧になり、ターミナルにダウンロードし、購入する前に自動売買ロボットをテストしてください。完全に無料でアプリをテストできるのはMetaTraderマーケットだけです。

取引の機会を逃しています。
- 無料取引アプリ
- 8千を超えるシグナルをコピー
- 金融ニュースで金融マーケットを探索