YouTubeにあるマーケットチュートリアルビデオをご覧ください
ロボットや指標を購入する
仮想ホスティングで
EAを実行
EAを実行
ロボットや指標を購入前にテストする
マーケットで収入を得る
販売のためにプロダクトをプレゼンテーションする方法
MetaTrader 4のためのエキスパートアドバイザーとインディケータ - 37
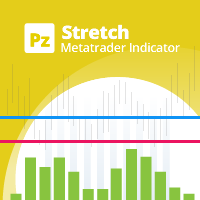
The Stretch is a Toby Crabel price pattern which represents the minimum average price movement/deviation from the open price during a period of time, and is used to calculate two breakout levels for every single trading day. It is calculated by taking the 10 period SMA of the absolute difference between the open and either the high or low, whichever difference is smaller. This value is used to calculate breakout thresholds for the current trading session, which are displayed in the indicator as
FREE

The market is unfair if only because 10% of participants manage 90% of funds. An ordinary trader has slim changes to stand against these "vultures". This problem can be solved. You just need to be among these 10%, learn to predict their intentions and move with them. Volume is the only preemptive factor that faultlessly works on any timeframe and symbol. First, the volume appears and is accumulated, and only then the price moves. The price moves from one volume to another. Areas of volume accumu

Three Bar Break is based on one of Linda Bradford Raschke's trading methods that I have noticed is good at spotting potential future price volatility. It looks for when the 1st bar's High is less than the 3rd bar's High as well as the 1st bar's Low to be higher than the 3rd bar's Low. This then predicts the market might breakout to new levels within 2-3 of the next coming bars. It should be used mainly on the daily chart to help spot potential moves in the coming days. Features :
A simple metho
FREE

あなたなしでは損益分岐点が勝ちトレードに変わることにうんざりしていませんか? Unwickable Stop Loss (USL) により取引を継続できます!
あなたは綿密に取引を計画し、忍耐力を発揮し、「完璧な」瞬間にエントリーしました。 取引が自分に有利に進むと、ストップロスを損益分岐点に移動し、資本がリスクにさらされない安心感を得ることができます。 しかしその後、市場は予期せぬ方向に進み、あなたを止め、意図した方向に進みます (スクリーンショット A を参照)。 何が違うのか考えたことはありますか? ストップの移動のタイミングを計るのは、エントリーのタイミングと同じくらい難しく、タイミングを間違えると早期の退出につながることがよくあります。 停留所の移動による不確実性を回避するためのより良い方法があるとしたらどうでしょうか? 早期の撤退を排除して、取引を長く続けることができるもの Unwickable Stop Loss (USL) を導入します。これは、ハード ストップロスとシームレスに連携する、リスク管理における革新的なツールです。 USL は、ウィックによって時期尚早
FREE
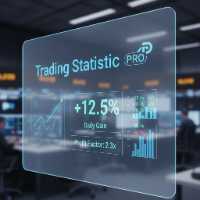
The statistical indicator for the metatrader 5 TradingStatisticPro collects statistical data on your trade, which makes it easier to assess the effectiveness of trading, the profit received and the risks. The indicator is compactly placed in the corner of the main chart of the terminal and displays the following information: 1. The profit earned. 2. Maximum drawdown. 3. The recovery factor. 4. Profit factor. 5. The ratio of profitable and unprofitable transactions (winrate). 6. Average profit a
FREE

This indicator displays potential price levels, support and resistance levels, highest and lowest price levels for Asian, European and American sessions. It works for the day that you select from user interface. It is suitable for gold, bitcoin, all currencies, commodities, crypto currencies and all investment instruments on the metatrader. You can use on the your day trade transactions easily. This indicator is for metatrader4 platform.
FREE
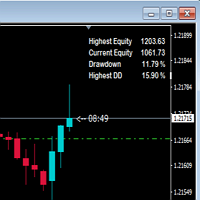
This indicator shows drawdown based on highest equity. Usually drawdown is used to show performance of a trading account especially when someone participate in a trading contest. If drawdown exceed a determined number, the contest account will be disqualified. So, I hope, this indicator will warn us in maintaining the drawdown and the account still be saved.
FREE

Volume Footprint Analysis is a precision-engineered, volume-based indicator that transforms raw market volume into an intuitive, color-coded signal system. Built on concepts from Volume Spread Analysis (VSA) and Smart Money principles, this tool removes the guesswork from volume interpretation and gives traders clear, actionable insights on when to buy or sell — on any timeframe and across any trading instrument. MT5 Version - https://www.mql5.com/en/market/product/138565/ Join To Learn Mark

The RSI Arrows MTF indicator is based on the RSI indicator. Represents input signals in the form of arrows. It has 6 types of calculation. All signals are generated on the current bar of the selected period.
Signals do not redraw in the first 4 modes! But it is possible to redraw in cases of a sharp change in market movement.
All signals in MTF mode correspond to signals of the period specified in MTF. It is maximally simplified to use both for trading with only one indicator and for using t
FREE

Overview: Multipound Scalper MT4 is a multicurrency Expert Advisor developed for short-term trading. It uses a customizable trading time filter combined with proven technical indicators — Moving Averages and Bollinger Bands — to identify high-probability market entries and exits. Designed for traders seeking a structured scalping approach, this EA includes built-in risk control and flexible symbol selection. Key Features: Supports multiple currency pairs Custom trading session hours Trade signa
FREE

Multi timeframe fractal indicator which shows the higher timeframe's fractal point on lower timeframes.
Parameters Fractal_Timeframe : You can set the higher timeframes for fractals. Maxbar : You can set the maximum number of candles for the calculations. Up_Fractal_Color, Up_Fractal_Symbol, Down_Fractal_Color, Down_Fractal_Symbol : Color and style settings of the fractal points. Extend_Line : Draws a horizontal line from the previous fractal point until a candle closes it over or a user-specif
FREE

Χ15 indicator is a MetaTrader 4 tool that allows you to BUILD & BACKTEST ON REAL TIME your own strategies quickly, easily and efficiently. It contains 15 of the most popular technical analysis indicators that you can use, each one in a different way. Choose the indicators that you want to use, select how you will use them and you will see on the chart BUY (green) and SELL (red) arrows implementing your strategy. Choose Take Profit and Stop Loss and you will see the results of your strategy with
FREE

ATR-normalized slope oscillator designed to measure price acceleration relative to volatility. This zero-centered histogram clearly reflects trend strength, impulse changes, and divergence between price and momentum. The indicator does not repaint historical values and works on any symbol and timeframe. It can be used as a standalone analytical tool or as an external oscillator inside Dynamic_Divergence_Universal_PRT for professional divergence detection. https://www.mql5.com/ru/market/product/1
FREE
Avantgarde: Grid This Expert advisor uses simple and robust grid method to place trades. simple and easy to use. https://www.mql5.com/en/signals/534678 How It Works: The EA does not use indicators but uses a math based solution to price-action. The EA will perform the same trades in any timeframe. Avantgarde Grid is equipped with money management, Autolot and DD close trade. Take care when setting the <step> as it will alter the aggressiveness. The Greater the step the less risk. Parameters Buy
FREE
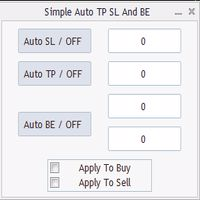
Program for automatic placement of stop loss and take profit orders. Values are calculated as points distance from open price. BreakEven option is also included. all options could be applied to BUY, SELL separately or together. Enter values in points in the fields on the right side of the menu and press dedicated button to aplly your settings.
If in doubt, The instruction is displayed in the tooltip.
FREE

FREE TopClock Indicator: This indicator is an Analog Clock That Shows: Local Time Of Pc or Time Of Broker Server or sessions(Sydney -Tokyo London -NewYork)Time or custom Time( with GMT -Base) this can shows Candle Time Remainer with Spread live. You can run this indicator several times for different times and move it to different places on the chart. If you would like, this indicator can be customized for brokers and their IB based on customer needs. For more information contact us if you
FREE
Chart State Saver for MT4 is utility which helps to save states of all your charts even if they will be closed. And then all saved charts' states can be easily loaded back to charts.
It stores templates for each particular currency pair and automatically applies them to charts once they will be opened at next time. Also they can be applied to the charts by your own needs. Thus you can close any chart at your MT4 without scaring to lose chart's data like drawls, messages, chart styling and so on

How the Indicator Works:
This is a Multi-timeframe MA multimeter indicator which studies if price is above or below a particular EMA range and shows Red/Green/Yellow signals. Red: Price Below EMA range Green: Price above range Yellow: Price within range
Indicator Properties:
EMA Settings: - Default Period is 200. You can change all MA Settings like Period, MA Method (SMA, EMA, etc) or MA Applied Price (Close, Open, etc).
- EMA Range list is a comma separated value list for different timeframes
FREE

"WinWiFi All in Signal is designed based on the principles of Candlestick Consolidation (กระจุกตัว) and Price Expansion (กระจายตัว). By identifying these key behaviors on the M5 timeframe, traders can execute high-frequency entries with confidence. Our system eliminates timezone discrepancies between brokers, focusing purely on price action."
WinWiFi All in Signal – Master the M5 Gold Market "Unlock the power of Price Action with our $600 proven strategy. WinWiFi uses a unique logic of Candlest
FREE

My Fibonacci An automated Fibonacci indicator that combines ZigZag swing detection with comprehensive Expert Advisor integration through a 20-buffer system. More details about data specification and EA integration: https://www.mql5.com/en/blogs/post/764109 Core Features Automated Fibonacci Detection The indicator identifies swing points using configurable ZigZag parameters and draws Fibonacci retracements and extensions automatically. It updates levels as new swing formations develop. Market Ad
FREE

Master Candle (MC) Indicator automatically detects "Master Candles", also known as "Mother Candles", i.e. candle that engulf several candles that follow them. See screenshots. You can choose how many candles Master Candle should engulf. By default it is set to 4. Feel free to change colour and thickness of lines as it suites you.
I find this indicator to be very useful to identify congestions and breakouts, especially on 60 minutes charts. Usually if you see candle closing above or below "Maste
FREE

This is a trend indicator.
Timeframe: any Symbol: any Color meaning: blue: long trend, up trend red: short trend, down trend yellow: market trend is changing Feature: 1, very easy to use, obvious signal, profitable 2, suitable to work on charts of any timeframe 2, all type of alerts 3, standard data buffers, can be easily implanted into any EA program. 4, all color customizable.
wish you like it :)
FREE

EA SCALPER GHOST PRO
This is single Entry type EA. It use smart alghoritme to detect market movement. It also use Stop loss and take profit . EA will not use any dangerous system like martingale, grid, averaging etc which can cause account blown in a second Tis EA use More than one pair to reduce risk. Right now im using 13 pair at the same time PROMO SALE PRICE Only $99 For first 10 copies!! 4 copies left Next Price will be ====>> $xxxx UP
RAMADHAN KAREEM PROMO ONLY $55 FOR LIFE TIME.. GRAB
FREE

EnergyX Indicator EnergyX is a unique tool that visualizes the "energy" of the market in a separate window. It helps you quickly see when energy is rising or falling, making it easier to spot potential trading opportunities. Yellow bars show when energy is increasing. Red bars show when energy is decreasing. How to Use: When price is approaching a resistance level: If energy is high and increasing (yellow), there is a higher chance the price will break the resistance. You may consider a buy
Unleash Smarter Trading with the Smart Signal Generator Tired of guesswork in your trading? The Smart Signal Generator is your new essential tool, designed to simplify your strategy and give you a powerful edge. This isn't just another indicator—it's a system built to provide you with high-probability entry signals, saving you time and boosting your confidence. Key Advantages & Features Intelligent Signal Generation : Our system goes beyond basic crossovers. It uses a built-in EMA filter to conf
FREE
ChartFix – Fixed Scale and Pan Chart Controls for MT4 ChartFix is a lightweight indicator that adds convenient on-chart navigation tools to MetaTrader 4. The controls are designed to offer a chart interaction style that creates an optional switch between MT4 default auto scale feature and a fixed scale chart that can be moved up and down and easily scaled vertically. Main Functions Zoom In / Zoom Out – Adjust the chart scale directly from on-screen buttons. Scale Mode Switch – Toggle between MT4
Signal Mastery: Your Edge in the Market Tired of lagging indicators and missed opportunities? Meet Signal Mastery (EMA20-MACD System) —the powerful, non-repainting indicator designed to deliver high-probability trading signals right when you need them. This isn't just another MACD or EMA tool. It's a professional-grade system that intelligently combines EMA 20 and MACD Crossover logic to pinpoint optimal entry and exit points. Best of all, it includes an optional EMA 200 filter to ensure you on
FREE

このスクリプトを使用すると、トレンド ライン、フィボナッチ リトレースメントなど、あらゆる種類の描画オブジェクトを 1 つ以上の他のチャートにコピーできます。
デフォルトでは、スクリプトは現在のチャート (スクリプトが適用されたチャート) のすべてのオブジェクトを、現在ロードされている同じシンボルの他のチャートにコピーします。
設定
目的地の時間枠 PERIOD_CURRENT 以外に設定すると、スクリプトが適用されたチャートと同じシンボルの開いているチャートにオブジェクトがコピーされます。 値を特定の時間枠、たとえば PERIOD_D1 に設定すると、同じ銘柄と期間のチャートのみが更新されます。 CopyObjectsOfType これをコピーしたい特定のタイプのオブジェクトに設定すると、そのタイプのオブジェクトのみが他のチャートにコピーされます。 CopyIndicatorWindowObjects True に設定すると、インジケータ ウィンドウのオブジェクトもコピーされます。これは、ソース チャートと同じ指標を同じ順序で持つ 2 番目のチャートに依存します。
チャート
FREE
SignalAlert インジケーターは、別のインジケーターからの売買シグナルを追跡し、それが発生するとサウンドアラートを送信するためのツールです。SignalAlertは、Binary Sixty Scalpingなどのインジケーターと連携して、シグナルに素早く反応するために役立ちます。 インジケーターの設定: IndicatorName – SignalAlertがシグナルを読み取るインジケーターの名前を指定します。例えば、「Binary Sixty Scalping」のように、正確な名前を入力してください。 BuyBuffer – 買いシグナルのバッファ番号を指定します。例えば、「Binary Sixty Scalping」の買いシグナルが最初のバッファにある場合、BuyBuffer = 0を設定します。他のバッファにある場合は、その番号を指定してください。 SellBuffer – 売りシグナルのバッファ番号を指定します。例えば、「Binary Sixty Scalping」の売りシグナルが2番目のバッファにある場合、SellBuffer = 1を設定します。 SoundFil
FREE

A signal indicator consisting of several well-known indicators that process data sequentially. 2 options - for schedule and basement. In the settings it is possible to enable alerts about the change of trend (alerts) sound, by e-mail and push. It is possible to change the colors and thickness of the lines, the colors and codes of the arrows, the number of calculation bars and separately configure the parameters included in the indicators.
FREE

Moving Average Cloud draws 4 MAs on chart simultaneously in histogram style. Indicator uses 4 MAs: slow sma & ema 200 and fast sma & ema 50. the range between 2 slows MAs and Fasts, represented by histograms on the MAs boundaries - creating kind of "cloud" that can be traded by all kind of MA strategies like support & resistance or other... Change of color of the same histogram points to momentum changing.
Combined with other market analysis, can greatly improve trading results.
FREE

Reverse copier is a tool that will open opposite buy/sell orders from your master account. It will help you with low profit EA's that lose consistenly and turn it to wins.
Feel free to ask for new functions/features and I will add it. Now it's a simple MT5 to MT4 bridge with straightforward logic of one position open/close.
How to install: https://www.mql5.com/en/market/product/141604
FREE

Expert Advisor Description EA TugOfWar will open both buy and sell positions at different times according to the triggered signal, the most positions and in accordance with the market direction that will win and profit. Profit target per war is 1% to 5%. Warmode normal = Longterm strategy Warmode extreme = Shortterm strategy
Parameter Description StartTrade = Time to start trading / open position EndTrade = Time to end trading / open position WarMode = 1 -> Normal, 2 -> Extreme (lots of tr
FREE

SniperGrid Shield EA — fully automated grid + hedge trading robot
Brief description SniperGrid Shield EA is a fully automated Expert Advisor using its own SGS_Signal to open high-quality trades and manage them via controlled grid and optional hedge logic.
Trading strategy The EA works in three layers:
Main trade — opens a single position per cycle based on SGS_Signal (optional ADX filter for trend confirmation).
Controlled grid — if price moves against the main trade by a user-defined ATR d
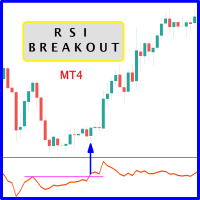
When prices breakout resistance levels are combined with Relative Strength Index "RSI" oscillator breaks out its historical resistance levels then probability emerges to record farther prices. It's strongly encouraged to confirm price breakout with oscillator breakout since they have comparable effects to price breaking support and resistance levels; surely, short trades will have the same perception. Concept is based on find swing levels which based on number of bars by each side to confi
FREE
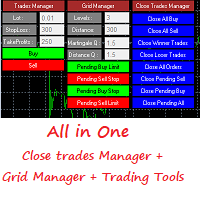
This is a demo version . Download the full version from this link https://www.mql5.com/fr/market/product/84850
Full version Allows you to : Set the number of levels (trades). Lot size and you can do Martingale to raise the lot size for each level. Set distance between levels, and you can manage the distance for each level using Distance Q. Static TP and SL for each level. You can open : BUY STOP / BUY LIMIT / SELL STOP / SELL LIMIT (levels in one click). Close all buy orders. Close all s
FREE

Candle Color Day - 曜日別に色分けされたローソク足インジケーター
概要 チャート上のローソク足を曜日に応じて色分けするシンプルな視覚ツールです。月曜日は1色、火曜日は別の色、といった具合です。特定の曜日に価格が特定の動きをする頻度を知りたいと思ったことはありませんか?このインジケーターは、そのようなパターンを確認するのに役立ちます。
対象者
以下のトレーダー向けです。
過去のデータから曜日を素早く特定したい
価格変動における季節性パターンを探している
チャート上で視覚的な参照資料を追加したい
特定の曜日が取引に与える影響を分析したい
仕組み このインジケーターは、既存のローソク足の上に色付きの線を描画しますが、元のローソク足はそのまま残ります。曜日ごとに異なる色が割り当てられます。デフォルト:
月曜日 - 赤
火曜日 - 緑
水曜日 - 青
木曜日 - オレンジ
金曜日 - 茶
土曜日と日曜日 - 灰色
設定: すべて2回のクリックで設定できます:
キャンドル幅 - キャンドル本体の太さ (1~10ピクセル)
影幅 - 影の太さ (
FREE

FUNDING DEVIL INDICATOR has been developed by traders for traders and is not another combination out of existing indicators or a "magic, solve all situations" tool.
PASS THE FUNDED ACCOUNTS WITH IT.
It is the answer for beginners and experienced traders about the misleading concepts of the mainstream, causing 90% of retail traders, never making a living out of trading.
Successful traders are "following the smart money" and do NOT try to catch every move from start to end. Consistent traders
FREE

One Click Trade Pro is a tool that allows you to open orders with just one click, choosing all the parameters, including the Magic Number! Useful if you want to quickly submit trades specifying also their Magic Number. Other than submitting new orders you can also see the list of orders (with their Magic Number) and change their Stop Loss and Take Profit. The PRO version also allows you to: Open opposite pending orders Setup and submit orders using lines, for a better visualization
How does it
FREE

Oil Master indicator is a very beginner-friendly buy sell arrow type indicator that works on oil pairs, this indicator focuses on giving quick scalping signals with built-in money management in form of Take profit and stop-loss colored lines that come with each arrow signal, the indicator also has its built in Stats panel that gives signal accuracy % alongside useful info. HOW TO USE : Open trade according to arrow direction, after that use the TP and SL lines above and below the arrow and drag
FREE
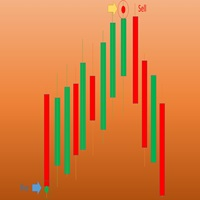
Wave Entry Alerts Oil is a custom indicator developed by Azad Gorgis for MetaTrader 4. This indicator is designed to provide alerts based on ZigZag patterns, specifically tailored for trading on the Oil (XIT/USD) symbol.
Key Features: - Chart Window Indicator: The indicator is designed to be displayed on the main chart window. - Arrow Signals: The indicator generates arrow signals on the chart, indicating potential reversal points based on ZigZag patterns. - Customizable Parameters: Traders ca
FREE

The indicator displays crossing zero level by Moving Average of Oscillator (OsMA) in the form of arrows. The this is a multi-timeframe indicator, and it displays signals from other timeframes. The indicator notifies about a signal by means of a pop-up Alert window, or sending notification to e-mail.
Parameters Time-frame - select timeframe to show indicator signals. Fast EMA Period - fast EMA. This is an exponential moving average from a price with a short period. Slow EMA Period - slow EMA. Th
FREE

OneShotFX is a scalping arrow signals type indicator, an all in one arrow system with money management and filtered signals. How to trade Buy : when up arrow prints on the chart open buy trade, set your tp and sl on colored tp and sl lines above and below the arrow signal candle. Sell: when up arrow prints on the chart open sell trade, set your tp and sl on colored tp and sl lines above and below the arrow signal candle. Why is it a good choice Plenty of signals : no need to wait for long per
FREE

Becktester Telegram Signals — Turn Telegram Signals into Real Backtests Automatically read signals from real Telegram channels , parse them (Buy/Sell/Entry/SL/TP), and backtest in MetaTrader 4 Strategy Tester . Verify parsing first with Live Parsing Test Mode . Important Information After purchasing the product, please leave a comment on the product page, and I will send you the Telegram Signal History Parser file. This file is not publicly available at the moment and is provided only to verifi

This is a modified Fractals indicator. It works similar the original Bill Williams' indicator, and is additionally enhanced with the possibility to change the top radius, in contrast to the standard radius of 2 bar. Simply put, the indicator checks the top and if it is the minimum/maximum in this radius, such a top is marked by an arrow. Advantages Adjustable radius. Use for drawing support and resistance levels. Use for drawing trend channels. Use within the classical Bill Williams' strategy or
FREE

Features:
- Current TF GMMA Cross and Trend (Mandatory Check.. G-Up/G-Down) - HTF GMMA Trend Check (Optional.. slanting arrow) - TDI or NRTR Trend Check (Optional.. diamond)
Read post for detailed description and downloading extra indicators: https://www.mql5.com/en/blogs/post/758264
Scanner:
This is a Dashboard Scanner for finding good trades using the GMMA method as base and TDI method for trend verification. All buttons for all Pairs and Timeframes are clickable and will change the chart f

DiverX is a powerful and versatile divergence indicator developed for the MetaTrader 4 platform. It detects both Regular and Hidden Divergences based on five popular technical indicators: RSI (Relative Strength Index) , RVI (Relative Vigor Index) , Stochastic Oscillator, CCI (Commodity Channel Index) , and MACD (Moving Average Convergence Divergence) . The indicator plots results directly on the main chart, providing visual lines, arrows, and labels for easy analysis.
FREE
自動最適化移動平均線(MA)インジケーター このインジケーターは、指定された期間(バー/ローソク足)内で最適な移動平均線(MA)の期間を自動で見つけ出します。最も大きな利益、または最高の利益・損失比率をもたらす組み合わせを自動で探します。 仕組み: 買いシグナル: 短期MAが長期MAを下から上にクロスした場合。 売りシグナル: 短期MAが長期MAを上から下にクロスした場合。 このインジケーターはさまざまな期間の組み合わせを試行し、最適なものを選んでチャート上に表示します。クロスが発生した場所には、その時点での利益が表示されます。 主な特徴 自動最適化: 利益または勝敗比率に基づいて最適なMAの期間を自動で検索します。 明確なシグナル表示: 最適化されたMAと、売買シグナルをチャート上に直接表示します。 利益の表示: 各クロスの位置に、その取引での利益額を表示します。 時間節約: トレーダーが手動で最適な期間を探す手間を省き、すぐに使えるエントリーシグナルを提供します。 設定項目 期間: 最適なMAを検索する対象となるバーの範囲。 MAの計算方法と価格: MAの計算に使用するメソッド(例
FREE
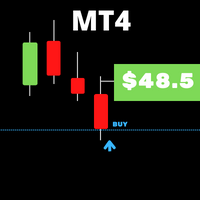
When you work with several assets and have several open positions in assets, it is a little complicated to visualize when profit or profit each active problem is giving, so with this in mind, we develop this indicator where it facilitates the visualization of operations in assets, where you you will be able to open several different resources and you will be able to visualize the individual result of each asset and speed up your decision making in your business.
FREE

The indicator synchronizes eight types of markings on several charts of one trading instrument.
This indicator is convenient to use in conjunction with "Multichart Dashboard" or other similar assistant that allows you to work with several charts at the same time.
"Multichart Dashboard" can be found under the link on my youtube channel.
Settings:
enable vertical line synchronization
enable horizontal line synchronization
enable Trend Line synchronization
enabling Fibonacci Retracement synchron
FREE

NearTheMarket is a fully automated trading EA with an excelent predicting criteria to enter into Market. First it opens market orders, buy or sell, with a predefined Take Profit. If after a specified time the trade is still open, the robobot deletes the Take Profit and opens a limited order with a lots amount equal to a multiple of lots of the market order. The mission of the robot is to get the PayOffPrice (average price of the net position) closer to market price. Again, if open orders are on
FREE

Indicator draws Round Number lines by distance of pips. 1. You can enable / disable indicator to show / hide the lines. 2. You can set distance of pips between the lines. 3. You can edit the number of lines. 4. You can edit properties of lines by inputs (style (DASH, DOT, SOLID, ...) , width (1 for DASH, DOT, 2 is not for DASH, DOT, it only SOLID), color). When indicator is deleted from the chart, the lines will be removed.
FREE
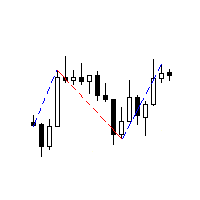
The Expert Advisor receives signals from an artificial neural network that uses the RSI indicator. Trades are closed by the opposite signals. Presence of a signal is checked at the closing of the bar. The EA also has the following functions: changing a position volume in proportion to the change in balance (function for the tester); transfer of unprofitable trades into breakeven;
Parameters Start with lot - initial position volume increased in proportion to the balance change; Lotsize by balanc
FREE

This is an unconventional version of the Heiken Ashi Smoothed indicator implemented as lines rather than a histogram. Unlike a usual histogram, the indicator draws the readings of the two moving averages in the form of colored lines.
Example If the candle crosses two indicator lines upwards, a trend is assumed to be changing from bearish to bullish. If the candle crosses two indicator lines downwards, a trend is assumed to be changing from bullish to bearish. The indicator is good at displaying
FREE
The goal of this indicator is to give you a quick & comprehensive view of your current profit. IceFX’s ProfitInfo is a utility indicator which displays the profit which is calculated from the actual trades on the chart(s). The indicator displays on a daily / weekly / monthly and yearly breakdown and shows the profit in pips / currency and percentage.
Main features: You can easily adjust IceFX’s ProfitInfo to display profit on the current open chart / current trade or even the profit of the enti
FREE

Unleash Your Trading Potential with the Golden Fractal Cross Are you tired of second-guessing your trades? Do you wish you had a clear, reliable system to guide your decisions? Introducing the Golden Fractal Cross —a powerful and user-friendly indicator designed to help you spot high-probability trading opportunities. This isn't just another average indicator; it's a complete strategy that combines the precision of fractal patterns with the dynamic power of Exponential Moving Averages (EMAs). Th
FREE

Auto Stop Trail And Profit is an expert advisor that monitors orders, when it detects that one has been placed, on the same chart that has been activated or on all assets, depending on its configuration, it will place its respective stop loss, take profit and perform trail stop loss (in a classic way, keeping a distance or "step by step").
You can see more of my products here: www.mql5.com/en/users/joaquinmetayer/seller
FREE

The art of Forex is a new complex Expert Advisor that continuously trades in both directions. A series of orders will be opened to get the best average price until the take profit is hit. It is optimal for making profits in an unpredictable market. A loss coverage system is integrated to allow the recovery of orders that are too distant from the current price. The best results are on EUR/USD H1 but you can use it on any forex pair and timeframe .
Live results : https://myx.gg/mql5
S
FREE

This tool adds alerts to your Fibo Retracement and Fibo Expansion objects on the chart. It also features a handy menu to change Fibo settings easily and quickly!
Features Alert for Fibo Retracement and Fibo Expansion levels. Sound, Mobile and Email alert. Up to 20 Fibo Levels. Continuous sound alert every few seconds till a user clicks on the chart to turn it OFF. Single sound alert with pop-up window. Keeping all user settings even after changing timeframes. New handy menu to change Fibo setti

BeST_ Classic Pivot Points is an MT4 Indicator that is based on the widely known and definitely classic Pivot Point of a market prices activity. A pivot point is calculated as an average of significant prices (high,low,close) from the performance of a market in the prior trading period. If the market in the following period trades above the pivot point it is usually evaluated as a bullish sentiment, whereas trading below the pivot point is seen as bearish. A pivot point and the associated suppo
FREE

Unlock Smarter Trading with the Bands Breakout! Are you tired of confusing charts and missed opportunities? Get clear, high-probability entry and exit signals right on your chart with the Bands Breakout indicator! This isn't just another indicator; it's a complete, trend-aware system designed to simplify your trading decisions and focus only on the best moves. Our unique engine combines the momentum power of the EMA 10 with the volatility framework of the Bollinger Bands to find definitive buy
FREE

The Magic Dice is an expert advisor that trades during large markets movements. It’s using pending orders. I’m sharing with you this expert in order to find the best broker for live trading because this expert need a broker with low spread and very fast execution. So, thank you in advance for giving me your feedbacks on this subject Please note that this expert is designed to be profitable only in low spread condition. In the default setting I’m using a spread filter of 3.0 just for passing the
FREE

Highlights trading sessions on the chart
The demo version only works on the AUDNZD chart!!! The full version of the product is available at: (*** to be added ***)
Trading Session Indicator displays the starts and ends of four trading sessions: Pacific, Asian, European and American. the ability to customize the start/end of sessions; the ability to display only selected sessions; works on M1-H2 timeframes;
The following parameters can be configured in the indicator:
TIME_CORRECTION = Correct
FREE

As per name Strength, This Indicator is a affordable trading tool because with the help of Popular Developers & Support of M Q L Platform I have programmed this strategy. I tried to input different types and different periods of Calculation regarding Support Resistance, Trends, Trend lines, Currency Strength, Oversold and Overbought Indications for good results. Furthermore, I have also care about Adjustable Settings So Trader can easily get in touch with market in another way also. What
FREE

+ 2 bonus strategies! Alerts! I recommend watching my advisor - Night Zen EA The indicator combines the most popular moving average strategies: Simple moving average crossover. Moving average crossover relative to the position of the slower moving average. 2 bonus strategies : The crossing of the fast moving average with the calculation of the opening prices of the slow moving average with the calculation of the closing prices taking into account the slower moving average. (The settings for th
FREE

そのスマートなアルゴリズムとエキスパートの注文により、常にゲームの先を行くことができます。 上昇相場と下降相場から利益を上げ、トレンドを簡単に予測し、投資ポートフォリオを常に把握する - Bollinger Blitz なら、それがすべて可能です!
Bollinger Blitz を使用すると、プロのように外国為替市場で楽に取引することができます。 当社の完全に自動化された EA は、業界をリードする 2 つの指標、コモディティ チャネル インデックスとボリンジャー バンドで動作します。 統合されたストップロス機能とテイクプロフィット機能を使用して、これまで以上に迅速かつ安全にポジションを開きます。 Bollinger Blitz で間違いを犯すのをやめて、プロのように取引を始めましょう!
エキスパートは、2022 年 1 月 1 日から 2023 年 1 月までの GBPUSD M5 履歴データでテストされました (MT4 での 1 年間のバックテスト)。
ダウンロードして自分でテストしてください。
GBPUSD M5
エントリーロット: 最小 0.1
ストップロス:
FREE

Gina Dual TPO — Brief MQL4 indicator TPO + Volume profile overlaid on chart — fast, scalable, and beginner-friendly. Built for traders who read market structure by POC and Value Area. What it is An MQL4 indicator that overlays dual market profiles—Time-at-Price (TPO) and Volume-at-Price (VPO)—directly on your chart. It’s fast (pixel-based drawing), scalable, and beginner-friendly. Who it’s for Intraday and swing traders who read market structure via POC (Point of Control) and Value Area to spot
FREE

Gold Matrix pro
Welcome to the Gold Matrix Ea pro.
The Robot is based on one standard Indicator. No other Indicator required =============================================================================================== This Robot is fully automated and has been created for everyone. The Robot works also on cent accounts. =============================================================================================== => works on all Time Frames from 1Minute to 1Day => On the lower Frames th
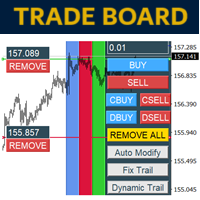
Trade Board MT4 – MetaTrader 4 用プロフェッショナルトレードアシスタント
購入前の重要情報 完全デモ版利用可能 – 実際の市場でテスト可能
Trade Board MT4 は完全に機能するデモ版を提供しており、トレーダーは機能制限なしでデモ口座を使用し、実際の市場環境で直接テストできます。Strategy Tester 内でトレードアシスタントをテストしても現実的な約定動作は再現されません。そのため、デモ版をダウンロードして実際の市場環境でテストすることを強く推奨します。 直接ダウンロードリンク 生涯無料アップグレード
Trade Board MT4 は継続的に開発されているプロフェッショナルトレーディングプロジェクトです。本製品は常に改善され、新しい高度な機能が追加され続けています。購入されたすべてのユーザーは、将来のアップグレードを完全無料で受け取ることができます。 初期購入者向け限定価格モデル
最初の100名 は 30ドル で購入可能。
次の100名 は 69ドル 。
最終価格 は 99ドル となります。
初期購入者は最低価格で最大価値と生涯

Ultimate Market Master Trend Master the Market’s Direction with Precision The Ultimate Market Master Trend indicator is an all-in-one market sentiment analyser designed for traders who demand clarity, accuracy, and confidence in every move.
It combines smart trend detection, multi-timeframe stochastic momentum, and dynamic visual cues to help you identify high-probability entries and exits with ease. Key Features 1. Smart Trend System (Main Chart) Uses a 200-period LWMA baseline to determine
MetaTraderマーケットが取引戦略とテクニカル指標を販売するための最適な場所である理由をご存じですか?宣伝もソフトウェア保護も必要なく、支払いのトラブルもないことです。これらはすべて、MetaTraderマーケットで提供されます。
取引の機会を逃しています。
- 無料取引アプリ
- 8千を超えるシグナルをコピー
- 金融ニュースで金融マーケットを探索
新規登録
ログイン