QCL Adaptive Band Oscillator MT4

QCL Adaptive Band Oscillator — MetaTrader 4

A smooth 0–100 oscillator with adaptive reference bands for a clearer view of price momentum.

QCL Adaptive Band Oscillator combines smoothed price calculations with dynamic upper and lower bands. Displayed in a separate indicator window, it helps you examine momentum swings, potential turning points, and divergences between price and the oscillator.

A smooth transformation keeps the oscillator and both bands within the 0–100 range, with a center reference at 50. Extreme readings are compressed smoothly rather than cut off, preserving the relative position of the oscillator and its bands.

Key Features

  • Consistent 0–100 scale: A clear, bounded display across charts.

  • Adaptive reference bands: Upper and lower zones adjust to changes in oscillator variability.

  • Smooth oscillator movement: Price smoothing helps reduce short-term fluctuations.

  • Divergence analysis: Compare oscillator peaks and troughs with price structure.

  • Optional center line: Display or hide the reference at 50.

  • Customizable appearance: Configure line colors, widths, and styles in the Colors tab.

  • Efficient calculations: Incremental updates reduce unnecessary recalculation on each tick.

  • Clean line-based display: The MT4 edition displays the oscillator, two adaptive bands, and optional center line without channel shading.

  • No alerts or trade execution: Designed for visual chart analysis.

Reading the Indicator

The 50 center line provides a reference for readings above and below the oscillator’s midpoint.

Movement beyond the adaptive bands highlights relatively extreme oscillator readings. A turn back toward the channel can draw attention to a change in momentum.

Compare successive oscillator highs and lows with price highs and lows to examine regular and hidden divergences. Divergence recognition is manual; the indicator does not automatically draw divergence lines or signal arrows.

The adaptive bands are reference zones, not automatic buy or sell signals. Fixed levels such as 20 and 80 should not be interpreted as RSI-equivalent thresholds.

Input Parameters

Parameter Default Description
Base Length 18 Lookback used in the core oscillator calculation.
Smoothing 8 Smoothing length. Lower values generally respond faster; higher values generally produce smoother movement.
Zone Length 63 Lookback used to measure the variability behind the adaptive bands.
Upper Range 1.6 Controls the upper band’s distance from the center before the smooth transformation.
Lower Range 1.6 Controls the lower band’s distance from the center before the smooth transformation.
Show Center true Displays or hides the center line at 50.

Line colors, widths, and styles are configured in the Colors tab. Channel shading is permanently disabled in this MT4 edition and has no input setting.

Calculation and Display

The core calculation is derived from Sylvain Vervoort’s smoothed Bollinger %b approach. A common smooth transformation is then applied to the oscillator and both adaptive bands.

The displayed values differ from conventional Bollinger %b. The transformation preserves their relative ordering and band crossings while compressing extreme readings.

The current candle’s reading updates as prices change. Initial values remain empty until sufficient calculation history is available. Windows with effectively zero price variation may also remain empty because the underlying calculation is undefined.

Platform

Designed for MetaTrader 4, using the current chart’s price data and timeframe. The indicator runs in a separate window.

QCL Adaptive Band Oscillator supports visual analysis and does not guarantee trading results.


おすすめのプロダクト
QCL Dynamic RSI Zones — MetaTrader 4 QCL Dynamic RSI Zones combines a smoothed RSI signal with adaptive boundaries to help you assess momentum relative to recent market conditions. Instead of relying on fixed overbought and oversold levels, the indicator adjusts its zones using recent RSI behavior. A dynamic balance line, a color-changing signal, and excursion columns display momentum conditions in a separate chart window. Key Features Adaptive boundaries: Upper and lower zones respond to recent
FREE
As you know, the main invariable indicator of all traders is the moving average; it is used in some way in most strategies. It is also obvious that this indicator is capable of showing good entries in every local area. For which it usually needs to be optimized or just visually adjusted. This development is intended for automatic optimization of the indicator. Once placed on the chart, the indicator will automatically re-optimize itself with the specified period ( PeriodReOptimization ) and dis
A ratio between 0 and 1 with the higher values representing a more efficient or trending market,  It is used in the calculation of Perry J. Kaufman Adaptive Moving Average (KAMA), dividing the price change over a period by the absolute sum of the price movements that occurred to achieve that change. The Fractal Efficiency or also known as Efficiency Ratio was first published by Perry J. Kaufman in his book ‘Smarter Trading‘. This is mostly considered a filter for volatile markets none the less
FREE
+ 2 bonus strategies! Alerts! I recommend watching my advisor -   Night Zen EA The indicator combines the most popular moving average strategies: Simple moving average crossover. Moving average crossover relative to the position of the slower moving average. 2 bonus strategies : The crossing of the fast moving average with the calculation of the opening prices of the slow moving average with the calculation of the closing prices taking into account the slower moving average. (The settings for th
FREE
GAP DETECTOR FVG in trading refers to "Fair Value Gap", . It is a concept used in technical analysis to identify areas on a price chart where there is a discrepancy or gap between supply and demand. These gaps can occur due to rapid movements in price, usually as a result of important news or economic events, and are usually filled later as the market stabilizes. The GAP DETECTOR indicator is designed to identify fair value gaps (FVG) on the price chart and filter them using volatility to dete
FREE
This is a multi-timeframe version of the popular Hull Moving Average (HMA). The Double HMA MTF Light indicator combines two timeframes on a single chart. The HMA of the higher timeframe defines the trend, and the HMA of the current timeframe defines short-term price movements. The indicator is freely distributed and hasn't audio signals or messages. Its main function is the visualization of price movements. If you need advanced functionality of the HMA multi-timeframe indicator (information ab

FREE
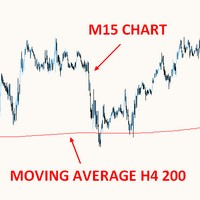
THIS FREE INDICATOR ALLOWS YOU TO SET THE TIMEFRAME OF THE MA YOU WANT ON YOUR CHART For example, it's very useful if you want to trade the H4 200 SMA using a lower timeframe chart, to identify price reactions such as reversals, Wyckoff schematics, etc. ***Please comment, rate and share it to your friends if you like it*** ------------------------------------------------------------------------- Moving averages are popular technical indicators used to identify trends, support and resistance leve
FREE
Follow The Line
Oliver Gideon Amofa Appiah
3.94 (16)
FOLLOW THE LINE GET THE FULL VERSION HERE: https://www.mql5.com/en/market/product/36024 This indicator obeys the popular maxim that: "THE TREND IS YOUR FRIEND" It paints a GREEN line for BUY and also paints a RED line for SELL.  It gives alarms and alerts of all kinds. IT DOES NOT REPAINT and can be used for all currency pairs and timeframes. Yes, as easy and simple as that. Even a newbie can use it to make great and reliable trades. NB: For best results, get my other premium indicators for more
FREE
Smart RSI MT4
Mostafa Saad Saeed Shawara
製品名 Smart RSI (MT4) – SmartView シリーズ 短い説明 MetaTrader プラットフォームで独特なユーザー体験を提供する RSI インジケーター。以前は利用できなかった高度な機能を提供し、ダブルクリックで設定を開く、削除せずにインジケーターを非表示/表示する、インジケーターウィンドウをチャート全体のサイズで表示するなどの機能を備えています。SmartView Indicators シリーズの残りの部分とシームレスに連携するように設計されています。 概要 SmartView シリーズは、革新的な機能を通じて MetaTrader プラットフォーム上のインジケーターに独特で特徴的なユーザー体験を提供し、インジケーター管理をより速く、より簡単にします。各インジケーターには、チャート上のスマートコントロールパネルが装備されており、基本情報を表示し、すべての重要な機能への迅速なアクセスを提供します。 以前は利用できなかった独自の機能 SmartView シリーズは、インジケーターでの作業をより簡単で迅速にする高度な機能を提供します: ダブルクリックで設定を開く:
FREE
Overview The TTM Squeeze indicator helps identify low volatility periods (squeeze) that often precede price breakouts. It uses Bollinger Bands (BB) and Keltner Channels (KC) to determine when the market is "coiling" and ready to move. Configuration Guide Volatility Settings The indicator uses Bollinger Bands to measure market volatility. When BBs are inside Keltner Channels, a squeeze is detected. The squeeze suggests the market is consolidating and may soon break out. True Range Option Optiona
FREE
This indicator provides a statistical analysis of price changes (in points) versus time delta (in bars). It calculates a matrix of full statistics about price changes during different time periods, and displays either distribution of returns in points for requested bar delta, or distribution of time deltas in bars for requested return. Please, note, that the indicator values are always a number of times corresponding price change vs bar delta occurred in history. Parameters: HistoryDepth - numbe
FREE
特別無料! Adaptive Trend Channel Pro v1.0 製品説明 【市場のノイズを排除】ボラティリティに自動適応する高精度トレンドチャネル 「Adaptive Trend Channel Pro v1.0」は、従来の固定幅チャネル(移動平均線±Pipsなど)の欠点を完全に解消するために開発されました。市場の 平均的なボラティリティ (ATR) に動的に合わせてチャネル幅が伸縮するため、レンジ相場でのダマシを避け、トレンド発生時の信頼性の高いエントリーシグナルを提供します。 このインジケーターの核となる優位性 ボラティリティ適応性 (ATRベース): 市場が静かな時はチャネルが狭くなり、市場が活発な時はチャネルが広がります。常に現在の市場環境に「適切な」取引レンジを表示します。 ノイズ排除: ボラティリティに応じてチャネル幅が変わるため、短期的なノイズによる無駄なシグナルが大幅に減少します。 2段階の高付加価値アラート: トレンド発生と平均回帰、2つの異なる戦略に対応した高精度なアラートを搭載しています。 2種類のアラート機能(高付加価値シグナ
FREE
The indicator displays signals according to the strategy of Bill Williams on the chart. Demo version of the indicator has the same features as the paid, except that it can work only on a demo account . Signal "First Wise Man" is formed when there is a divergent bar with angulation.  Bullish divergent bar - with lower minimum and closing price in the upper half. Bearish divergent bar - higher maximum and the closing price at the bottom half. Angulation is formed when all three lines of Alligator
FREE
Free automatic Fibonacci is an indicator that automatically plots a Fibonacci retracement based on the number of bars you select on the BarsToScan setting in the indicator. The Fibonacci is automatically updated in real time as new highest and lowest values appears amongst the selected bars. You can select which level values to be displayed in the indicator settings. You can also select the color of the levels thus enabling the trader to be able to attach the indicator several times with differe
FREE
Free informative Indicator-helper. It'll be usefull for traders who trade many symbols or using grid systems (Averaging or Martingale). Indicator counts drawdown as percent and currency separate. It has a number of settings: Count deposite drawdown according equity value and send e-mail or notifications to user if DD more than set; Sending e-mail when max open orders reached; Shows price and remaining pips amount before MarginCall on current chart and Account generally; Display summary trade lot
FREE
RJT Comets
Rafael Jimenez Tocino
1 (1)
Follow the trail of the comet to know the development of the trend. This indicator helps you to determine the evolution of the price depending on how these astronomical objects are shown in the chart. When the comet seems to stop, it opens its tails considerably and warns us of a possible change in trend. On the contrary, when it seems to get speed (looks thin because lines of tail are grouped) demonstrates safety and continuity in trend. The head or comet nucleus will show red or green accordin
FREE
Tmcd
Shaheen Hassanali
The Tmcd is a very smooth oscillator and a good indicator of trend. It has a noise filter built in which shows sideways markets and it can also show the beginning of a trend. It works on any symbol from Forex to commodities as well as crypto currencies. It does not require a change of settings. The default settings are fine. The use of it can be varied and I recommend it is be used in conjunction with other indicators. The indicator is free for use and your review will be appreciated. Join my T
FREE
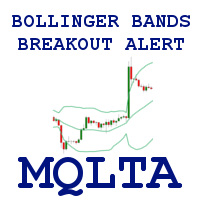
Bollinger Bands Breakout Alert is a simple indicator that can notify you when the price breaks out of the Bollinger Bands. You just need to set the parameters of the Bollinger Bands and how you want to be notified. Parameters: Indicator Name - is used for reference to know where the notifications are from Bands Period - is the period to use to calculate the Bollinger Bands Bands Shift - is the shift to use to calculate the Bollinger Bands Bands Deviation - is the deviation to use to calculate t
FREE
Multi-TF MA Levels plots a single moving average across multiple timeframes directly on your chart, giving you instant context at every level of the market. No switching charts. No mental maths. Just clean, flat lines showing exactly where the MA sits on M15, M30, H1, H4 and D1 — all updated on confirmed bar close so there is no repainting. Features Plots the local timeframe MA plus up to 5 higher timeframe MAs simultaneously HTF lines only update on confirmed bar close — no repainting Higher ti
FREE
This indicator calculates average speed of moving average indicator. Here is parameters: BarsToProcess - indicator calculating period; MaPeriod - period of Moving Average indicator; AveragingPeriod - period (MA values) of the basis of which the average value is calculated; MA_Method, MA_Apply_to - using to set MA indicator parameters; Thats all! Good luck.
FREE
Adaptiv Ma это индикатор средняя линия  значение которой выставляется в меню и применяется на тейфрейме Н4. В последствии она адаптируется к выбранному определенному таймфрейму. В меню индикатора задаются следующие параметры 1. Период индикатора 2.Метод определения Ма. 3. Стиль Ма. 4.Толщина линии Ма. 5.Цвет линии Ма. При переключении между таймфреймами автоматически переключается значение периода Ма для адаптации к новому таймфрейму. Пишите насколько вам была полезен такой индикатор. 
FREE
Stochastic Plus is a visual indicator designed for both beginners and professionals.    Developed using Stochastic and Laguerre and the principle of three screen.     Stochastic Plus helps: correctly evaluate the current market movement; find optimal entry points; do not rush to close profitable orders and increase profit     Stochastic Plus works very well with AmericanDream indicator (see screenshot).    May be used with any currency and timeframe.
FREE
Triple RSI
Pablo Leonardo Spata
1 (1)
LOOK AT THE FOLLOWING STRATEGY   WITH THIS INDICATOR.   Triple RSI   is a tool that uses the classic Relative Strength Indicator, but in several timeframes to find market reversals.    1.  ️ Idea behind the indicator and its strategy: In Trading, be it Forex or any other asset, the ideal is   to keep it simple, the simpler the better . The   triple RSI   strategy is one of the simple strategies that seek market returns. In our experience, where there is more money to always be won, i
FREE
Custom Pattern Detector Indicator This indicator lets you define your own custom pattern instead of the typical candlestick patterns. Everybody already knows about common candlestick patterns like the Doji pattern. This indicator is different though. The pattern you will define is a custom pattern based on CANDLE FORMATIONS . Once the indicator knows the pattern you want it to look for, then it will go through history on the chart and find matching patterns, make them visible to you, and calcula
FREE
AIS MT4 INDICATOR 5 ALL INCLLUSIVE SET !!!!!!!!!!!!!!!!!!!!!!!!!!!!!!!!!!!!!!!!!!!!!!!!!!!!!!!!!!! ! ! ATTENTION ! LIMITATION OF FREE OFFER PERIOD IS IMPLICIT ! !   ! CONFIRMATION 2024-08-20 20:00                           ! ! !!!!!!!!!!!!!!!!!!!!!!!!!!!!!!!!!!!!!!!!!!!!!!!!!!!!!!!!!!! GUIDE CHAPTER 1 IMPORTANT INFORMATION <1> THIS INDICATOR IS ONE OF THE SERIES OF NEW AIS INDICATORS AIS MT4 INDICATOR 1 =ADVANCED CLASSIC= AIS MT4 INDICATOR 2 =MULTIFRAMES= AIS MT4 INDICATOR 3 =LINES= AIS M
FREE
Velvet RVI is intended for use with the Velvet advanced ordering layer.  It is based on the algorithm for the Relative Vigor Index, provided by Investopedia here . All of the data it displays is accurate and verified against the internal API function iRVI, when it is detected by the ordering layer.  In order to place orders with the Velvet RVI indicator, the ordering layer must be installed and running.  Ordering from the Velvet RVI indicator requires that "Velvet Ordering Layer" ( found here ),
FREE
The   Trendlines Oscillator   helps traders identify trends and momentum based on the normalized distances between the current price and the most recently detected bullish and bearish trend lines. The indicator features bullish and bearish momentum, a signal line with crossings, and multiple smoothing options. USAGE The   Trendlines Oscillator   works by systematically: Identifying pivot highs and lows. Connecting pivots to form bullish (support) and bearish (resistance) trendlines. Measuring
The Keltner Channel is a volatility-based technical indicator composed of three separate lines. The middle line is an exponential moving average (EMA) of the price. Additional lines are placed above and below the EMA. The upper band is typically set two times the Average True Range (ATR) above the EMA, and the lower band is typically set two times the ATR below the EMA. The bands expand and contract as volatility (measured by ATR) expands and contracts. Since most price action will be encompasse
FREE
TrendBite v1.5 - プロフェッショナルトレンド追跡インジケーター 開発者: 8aLt4 バージョン: 1.5 プラットフォーム: MetaTrader 4  概要 TrendBite v1.5 は、市場のトレンドの変化を検知し、投資家に明確な売買シグナルを提供するために設計された、高度なテクニカル分析インジケーターです。ボリンジャーバンドのアルゴリズムに基づいて、トレンドの転換を正確に捉えるこのツールは、初心者にも経験豊富なトレーダーにも最適です。  主な機能  トレンドの検知 自動トレンド分析:市場の上昇トレンドと下降トレンドを瞬時に検出 ボリンジャーバンドベース:信頼性の高い数学的モデルに基づく計算システム 視覚的な明瞭さ:緑(上昇)と黄色(下降)のヒストグラムバーでトレンド状況を明確に表示  売買シグナル 緑色の矢印(↑):買い機会を示します 赤色の矢印(↓):売り機会を示します 明確な視覚化:トレンドラインにより、ポジションの方向を簡単に追跡できます ヒストグラム表示:トレンドの強さを視覚的に評価可能  警告システム 音声警告:新しいシグナルが発生すると自動
FREE
Overview BB RSI Mean Reversion Pro is a rule-based Expert Advisor that identifies high-probability mean reversion setups on the H4 timeframe. When price closes outside a 20-period Bollinger Band and then re-enters on the next bar — confirmed by an RSI extreme — the EA enters at market on the bar open. An optional weekly Donchian Channel filter restricts entries to trades near structural range boundaries, significantly improving profit factor and reducing drawdown. How it works The signal require
FREE
このプロダクトを購入した人は以下も購入しています
Trend SniperX MT4
Sarvarbek Abduvoxobov
5 (3)
Trend Sniper X は、トレーダーがトレンドの方向性と潜在的な反転ポイントを明確かつ正確に特定できるように設計された、MetaTrader 5 用のマルチタイムフレーム・トレンドフォロー指標です。 MT5版はこちら: https://www.mql5.com/en/market/product/181101 価格情報: 現在の価格はプロモーション価格であり、今後のアップデートや新機能の追加に伴い変更される場合があります。 Code2Profit チャンネル マルチタイムフレーム分析で市場をマスターしよう! Trend Sniper Xで勝率を最大化する方法:ルールとセッションのコツ 技術仕様 プラットフォーム MetaTrader 5 インジケータータイプ マルチタイムフレーム・トレンドインジケーター 動作タイムフレーム すべてのチャート時間足(上位足M1~MN1を独立して選択可能) 主要対象銘柄 為替(Forex)、ゴールド(XAUUSD)、その他のCFD 推奨口座 すべての口座タイプ ビジュアル表示 トレンドカラーローソク足(買い/売り/弱い/変化)+ 買い/売りシグナル
Miraculous Indicator Binary & Forex v3 StrategySafe Miraculous Indicator Binary & Forex v3 StrategySafe は、明確なシグナル、強力な確認ツール、そして Binary と Forex 市場で使える体系的な取引アプローチを求めるトレーダー向けのプロフェッショナル指標です。 v3 では、MIR Dashboard、Miraculous Confirmation Dashboard、GANN Law、Square of 9 レベル、GANN 角度、そしてより高度な Forex モードが搭載されています。 主な特徴 Binary と Forex の両方に対応。 MIR Dashboard による素早い市場分析。 Miraculous Confirmation Dashboard によるエントリー確認。 Forex 分析用の GANN Law drawing lines。 Square of 9 のライン、レベル、方向表示。 1x1 GANN Angle によるトレンド圧力の確認。 Entry I
割引は 24 時間後に終了します — 次の価格は$ 69 ZORYK — MetaTrader 4専用 XAUUSDシグナル・トレードプランニングシステム このような経験はありませんか。 ゴールドを分析し、エントリーを待ち、ようやくポジションを持った直後に価格が逆方向へ動く。 早すぎる決済をしてしまったり、Stop Lossを動かしたり、数秒迷っている間にチャンスを逃したりする。 その後、相場は自分が最初に予想していた方向へ進み、目標へ到達する。 問題は常に方向判断ではありません。 本当の問題は、明確な計画がなかったことです。 どこでエントリーすべきか。 どこでトレードの前提が無効になるのか。 近い利益を確保すべきか、より大きな値動きを待つべきか。 現在のsetupが本当に強いのか、それとも無理にトレードを探しているだけなのか。 ゴールドは非常に速く動きます。 正しい分析でも、明確なプランがなければ数秒で悪い判断に変わることがあります。 ZORYKは、その問題を解決するために開発されました。 ZORYKとは ZORYKは、MetaTrader 4とXAU
SR Liquidity は、市場の流動性が集中し、価格が最も強く反応する「隠れたゾーン」を可視化するために設計されたトレーディング指標です。こうした流動性の高いエリアは強力なサポート(支持)およびレジスタンス(抵抗)レベルとして機能し、市場が反転する可能性が最も高いポイントを明確に示してくれます。 単なる一般的なサポートラインやレジスタンスラインを描画するのではなく、「SR Liquidity」は実際の価格変動を分析し、売りと買いの圧力が集中するゾーンを特定します。これらは、市場の真の動きを牽引する「流動性のプール(溜まり場)」そのものです。それらをチャート上に直接可視化することで、価格が実際に反応する前に、その動きを予測することが可能になります。つまり、このインジケーターは価格の方向性が変わる可能性を予測するのです。生のプライスアクションを、市場の重要な水準(転換点となり得るポイント)を示す、明確で実用的なロードマップへと変換してくれます。 このインジケーターは、FX、株価指数、貴金属、仮想通貨など、あらゆる銘柄や時間足で使用可能です。 ご購入後、取引手順や無料の優れた追加インジケ
Gann Made Easy は、ミスター・ギャンの理論を使用した取引の最良の原則に基づいた、プロフェッショナルで使いやすい外国為替取引システムです。 W・D・ガン。このインジケーターは、ストップロスとテイクプロフィットレベルを含む正確な買いと売りのシグナルを提供します。 PUSH通知を利用して外出先でも取引可能です。 ご購入後、取引方法の説明と優れた追加インジケーターを無料で入手するには、私にご連絡ください! おそらく、ギャンの取引手法についてはすでに何度も聞いたことがあるでしょう。通常、ギャンの理論は初心者のトレーダーだけでなく、すでにある程度の取引経験がある人にとっても非常に複雑なものです。なぜなら、ギャンの取引手法は理論的にはそれほど簡単に適用できるものではないからです。私はその知識を磨き、最良の原則を私の外国為替インジケーターに組み込むために数年を費やしました。 このインジケーターは非常に簡単に適用できます。必要なのは、それをチャートに添付し、簡単な取引推奨事項に従うだけです。このインジケーターは常に市場分析の仕事を行い、取引の機会を探します。適切なエントリーポイントを検出す
プレシジョン・インデックス・オシレーター(Pi-Osc)は、Precision Trading SystemsのRoger Medcalfによるものです。 バージョン2は、チャートにスーパーファストでロードされるように注意深く再コードされ、その他の技術的な改良も組み込まれて、エクスペリエンスを向上させています。 Pi-Oscは、市場が強制的に行かなければならない、すべての人のストップを取り除くためのポイントである、極限のエクソースト・ポイントを見つけるために設計された正確な取引タイミング信号を提供するために作成されました。 この製品は、極限のポイントがどこにあるかを知るという古代の問題を解決し、トレーダーの生活をはるかにシンプルにします。 これは、業界標準のオシレーターとは異なる強力な要素を持つ高度なコンセンサス・インジケーターです。 使用されている一部の機能には、需要指数、マネーフロー、RSI、スティリング、パターン認識、出来高分析、標準偏差の極値などがあり、異なる長さでこれらのバリエーションが多く含まれています。 初めて見ると、訓練されていない目には、他のオシレーター
Tokyo Indicatorは、トレンドの方向性、潜在的な取引シグナル、および市場状況を視覚的に分かりやすく表示します。 色分けされた階段状のトレンドラインにより、強気局面(青色)と弱気局面(マゼンタ色)が明確に区別されます。トレンドの変化に合わせて表示される方向矢印は、売買の好機を強調します。 統合されたダッシュボードには、現在のシグナル、市場のバイアス(傾向)、モメンタム、ボラティリティ、シグナルの品質がひと目で分かるようにまとめられています。これにより、トレーダーはパネルを切り替えることなく、価格変動(プライスアクション)とインジケーターの数値を照らし合わせて分析を行うことができます。 すっきりとしたチャート表示と簡潔な市場概要により、Tokyo Indicatorはトレンド分析や取引判断における体系的なアプローチをサポートします。 あらゆる時間足や銘柄に対応しており、特に金(ゴールド)の取引に適しています。 トレンド スキャナーの強力なサポートを利用して、無料のインジケーターを入手し、プライバシーを守ります。あーみー!     設定 ShowHUD - チャート上のパネ
DayTrader PRO MT5:  https://www.mql5.com/en/market/product/186222 DayTrader PROは、ジョン・エリュース(John Ehlers)のラグuerreフィルターと強力な自動最適化エンジンを組み合わせた、高度なトレーディング・インジケーターです。固定されたパラメーターを使用するのではなく、直近の市場状況に基づいて最適な設定を自動的に検索するため、手動による絶え間ない調整をすることなく、変化する市場のボラティリティに適応できます。 本インジケーターは、明確な「買い(BUY)」および「売り(SELL)」シグナルを生成し、現在の市場ボラティリティから算出された適応型のストップロス(Stop Loss)およびテイクプロフィット(Take Profit)レベルを表示します。トレンド、効率レシオ(Efficiency Ratio)、ボラティリティ、およびローソク足フィルターが内蔵されており、精度の低いセットアップを排除し、シグナルの精度を向上させます。 リアルタイム・パフォーマンスパネルには、現在最適化されている設定、プロフィッ
通貨強さウィザードは、取引を成功させるためのオールインワン ソリューションを提供する非常に強力な指標です。このインジケーターは、複数の時間枠のすべての通貨のデータを使用して、このまたはその外国為替ペアのパワーを計算します。このデータは、使いやすい通貨インデックスと通貨パワーラインの形式で表され、特定の通貨のパワーを確認するために使用できます。 必要なのは、取引したいチャートにインジケーターを接続することだけです。インジケーターは、取引する通貨の実際の強さを示します。このインジケーターは、トレンドに合わせて取引するときに有利に利用できる売買高の圧力の極値も示します。このインジケーターには、フィボナッチに基づく可能なターゲットも表示されます。 このインジケーターは、PUSH 通知を含むあらゆるタイプのアラートを提供します。 購入後ご連絡下さい。私の取引のヒントをあなたと共有し、素晴らしいボーナスインジケーターを無料で提供します! 幸せで有益な取引をお祈りします。
CRT Candle Range Theory HTF MT4 - Ultimate CRT Indicator: 高度なICTコンセプトとMalaysian SnRトレーディングシステム 最も先進的なCandle Range Theoryインジケーターでマーケットメーカーの足跡をマスターしましょう。Ultimate CRT Indicatorを使用して、Smart Money Concepts (SMC)の真の力を解き放ち、機関投資家のように正確にトレードします。真剣なトレーダー専用に構築されたこのインジケーターは、ICT Concepts (Inner Circle Trader)の核となる柱である、非常に効果的なCandle Range Theory (CRT)を自動化し、Malaysian Support and Resistance (SnR)エントリー手法とFVG (Imbalance)ゾーンの致命的な精度でそれを強化します。 MT4またはMT5でForex、Crypto、Indicesのいずれを取引している場合でも、このアルゴリズムは市場のノイズを取り除き、ダマシ(fak
M1 Sniper
Oleg Rodin
4.97 (30)
M1 SNIPER は使いやすいトレーディングインジケーターシステムです。M1時間足向けに設計された矢印インジケーターです。M1時間足でのスキャルピングのためのスタンドアロンシステムとして、また既存のトレーディングシステムの一部としても使用できます。このトレーディングシステムはM1時間足での取引に特化して設計されていますが、他の時間足でも使用できます。元々、この手法はXAUUSDとBTCUSDの取引用に設計しましたが、他の市場においても役立つと考えています。 インジケーターのシグナルは、トレンドの方向と逆方向に取引できます。インジケーターのシグナルを利用して両方向に取引するのに役立つ特別な取引テクニックをご紹介します。この手法は、特別な動的なサポートとレジスタンスの価格帯を利用することに基づいています。 ご購入後、M1 SNIPER矢印インジケーターをすぐにダウンロードできます。さらに、M1 SNIPERツールのすべてのユーザーに、以下のスクリーンショットに表示されているApollo Dynamic SRインジケーターを無料で提供しています。この2つのインジケーターを組み合わせることで
PRO Renko Systemは、特別にRENKOチャートを取引するために設計された高精度の取引システムです。 これは、様々な取引商品に適用することができる普遍的なシステムです。 システムは効果的に正確な逆転信号へのアクセスを与えるいわゆる市場の騒音を中和する。 表示器は非常に使いやすく、信号の生成に責任がある1つの変数だけがあります。 あなたは簡単にお好みの任意の取引ツールとレンコバーのサイズにツールを適応させることができます。 私はいつもあなたが私のソフトウェアで収益性の高い取引を支援するために余分なサポートを提供する準備ができています! 私はあなたに幸せで収益性の高い取引をしたいです! ご購入後にご連絡ください! 私はあなたに私のレンコチャートジェネレータを送信します。 私はまた、私の個人的な推奨事項やシステムの他のモジュールを無料で共有します!
スイングトレーディング は、トレンドの方向のスイングと可能な反転スイングを検出するように設計された最初のインジケーターです。トレーディングの文献で広く説明されているベースラインスイングトレーディングアプローチを使用します。インディケータは、いくつかの価格と時間のベクトルを調査して、全体的なトレンドの方向を追跡し、市場が売られ過ぎまたは買われ過ぎて修正の準備ができている状況を検出します。 [ インストールガイド | 更新ガイド | トラブルシューティング | よくある質問 | すべての製品 ] むち打ちを起こさずに市場スイングの利益 インジケーターは常にトレンドの方向を表示します 色付きの価格帯は機会のベースラインを表します 色付きのダッシュは、可能な反転スイングを表します この指標は、独自の品質とパフォーマンスを分析します 複数時間枠のダッシュボードを実装します カスタマイズ可能なトレンドおよびスイング期間 電子メール/サウンド/プッシュアラートを実装します インジケータは再描画またはバックペインティングではありません Swing Tradingとは Swing Tradingは
This is a professional chart indicator designed for traders focused on stability and clear price action. It helps filter market noise and provides clear visual entry and exit zones for your trading decisions. Core Features: Strictly Non-Repainting: The system is built with strict non-repaint logic. What you see on the chart is the true historical performance. Confirmed Signals: Signals are triggered and confirmed only after the candle closes . Once a trading arrow appears on a closed candle, it
Trend Catcher ind
Ramil Minniakhmetov
5 (11)
トレンドキャッチャーインジケーター トレンドキャッチャーインジケーターは、開発者独自の適応型トレンド分析指標を組み合わせることで、市場価格の動きを分析します。短期的なノイズを除去し、根底にあるモメンタムの強さ、ボラティリティの拡大、価格構造の挙動に焦点を当てることで、真の市場方向性を特定します。また、移動平均線、RSI、ボラティリティフィルターなどの平滑化およびトレンドフィルタリング機能を備えたカスタマイズ指標も使用します。 実際の運用状況のモニタリングやその他の製品については、こちらをご覧ください: https://www.mql5.com/en/users/mechanic/seller ご注意ください。私はTelegramでEAや設定を販売していません。詐欺です。すべての設定はブログで無料で公開しています。 重要!ご購入後すぐにご連絡ください。手順とボーナスをお送りします!
この製品は 2026 年の市場向けに更新され、最新の MT5 ビルドに最適化されています。 価格更新のお知らせ: Smart Trend Trading System は現在 $99 で提供されています。 次の 30 件の購入 後、価格は $199 に上がります。 特別オファー: Smart Trend Trading System を購入後、私にプライベートメッセージを送ることで、 Smart Universal EA を無料 で受け取り、Smart Trend のシグナルを自動売買に変えることができます。 Smart Trend Trading System は、リペイントなし、再描画なし、遅延なしの完全なトレーディングシステムです。よりクリーンなシグナル、より明確なトレンド方向、そしてより整理された取引方法を求めるトレーダー向けに作られています。 Online course , manual and [download presets] . このシステムは、トレンド検出、反転ゾーン、Smart Cloud、トレーリングストップロジック、サポートとレジスタンス、ローソク足の色分け
Quantum Naked SMC Prime is a streamlined Smart Money Concepts indicator designed for traders who prefer a clean chart, structured market analysis and clear visual trade setups without unnecessary complexity. The indicator combines market structure, liquidity behavior, institutional zones and confirmation logic into a compact analytical framework. Instead of flooding the chart with technical indicators, Quantum Naked SMC Prime focuses on the core elements of price action and Smart Money Concepts.
現在40%オフ! 初心者やエキスパートトレーダーに最適なソリューション! このインジケータは、独自の機能と秘密の数式を組み込んだ、ユニークで高品質かつ手頃な価格のトレーディングツールです。たった1枚のチャートで28の通貨ペアのアラートを表示します。新しいトレンドやスキャルピングチャンスの引き金となるポイントを正確に把握することができるので、あなたのトレードがどのように改善されるか想像してみてください! 新しい基本的なアルゴリズムに基づいて構築されているため、潜在的な取引の特定と確認がより簡単になります。これは、通貨の強さや弱さが加速しているかどうかをグラフィカルに表示し、その加速のスピードを測定するためです。加速すると物事は明らかに速く進みますが、これはFX市場でも同じです。つまり、反対方向に加速している通貨をペアにすれば、利益を生む可能性のある取引を特定することができるのです。 通貨の勢いを示す縦の線と矢印は、あなたの取引の指針となるでしょう。 ダイナミックマーケットフィボナッチ23レベルはアラートトリガーとして使用され、市場の動きに適応します。もしインパルスが黄色のトリガ
KURAMA GOLD SIGNAL PRO MT4版 ゴールドのサインに、目で見えるトレード計画を。 ゴールドのサインが出た。利確はどこか。損切りはどこか。エントリー前に何を確認すべきか。 KURAMA GOLD SIGNAL PROは、その判断材料をチャートに集約します。XAUUSDのM5、M15向けに、売買サイン、自動計算TP/SL、3段階のサイン評価、注意すべき相場条件を知らせるMARKETパネルを搭載。 セットアップ、決済目安、相場の注意点を一か所で確認。情報を集める手間を減らし、トレードの判断に集中できます。 買い切り購入者限定特典 AI Zone Radar MT5版と完全PDFマニュアルを無料プレゼント。 ご購入後にMQL5でメッセージをお送りください。買い切り購入が対象です。レンタルは対象外です。 AI Zone Radarを見る サインから、具体的なトレード計画へ SMA 13、21、75、100へのタッチを使ったセットアップを検出。各サインに売買方向と対象MAを表示するため、浅い押し目、戻りと深い調整を区別して確認できます。 チャートとパネルには、次の情報を表示し
ご紹介     Quantum Breakout PRO は 、ブレイクアウト ゾーンの取引方法を変革する画期的な MQL5 インジケーターです。 13年以上の取引経験を持つ経験豊富なトレーダーのチームによって開発された Quantum Breakout PROは 、革新的でダイナミックなブレイクアウトゾーン戦略により、あなたの取引の旅を新たな高みに押し上げるように設計されています。 クォンタム ブレイクアウト インジケーターは、5 つの利益ターゲット ゾーンを備えたブレイクアウト ゾーン上のシグナル矢印と、ブレイクアウト ボックスに基づいたストップロスの提案を提供します。 初心者トレーダーにもプロのトレーダーにも適しています。 量子EAチャネル:       ここをクリック MT5バージョン:   ここをクリック 重要!購入後、インストールマニュアルを受け取るためにプライベートメッセージを送ってください。 推奨事項: 時間枠: M15 通貨ペア: GBPJPY、EURJPY、USDJPY、NZDUSD、XAUUSD アカウントの種類: ECN、Raw、またはスプレッドが非
ARTEMIS サブウィンドウ・リバーサル・システム は、リペイントなしの強力な外国為替インジケーターであり、Smart Money Concepts(スマートマネー概念)とストキャスティクスのモメンタム分析を組み合わせて、高確率の反転トレードを特定するために設計されています。 精度の高いエントリーを求めるトレーダー向けに開発されており、流動性スイープの検出、マーケット構造の変化、モメンタム確認を一つのシンプルでプロフェッショナルなツールに統合しています。 このインジケーターが優れている理由 多くのインジケーターはランダムなシグナルを出しますが、 ARTEMISは実際の市場の動きに注目します: 流動性スイープ(ストップ狩り)の検出 チャージ・オブ・キャラクター(ChoCH)の確認 KとDのクロスによるタイミング判断 明確なBuy/Sell矢印 リペイントなしのロジック設計 これにより、無駄なシグナルが減り、高品質なトレードセットアップが増えます。 完璧なBUYシグナルシステム(最大の強み) このインジケーターは特に買いエントリーで強力です: ステップ1:弱気モメンタムの減少 ストキャス
Introducing the POWER TRADE Indicator Created by a small group of experienced traders with years of profitable experience in the financial markets, the Power Trade Indicator is a plug-and-play trading tool designed to help traders spot high-quality setups with ease and confidence. What It Does: It provides powerful entry signals, profit-taking zones, and rebound areas — giving you a complete view of where price action is most likely to move next. The indicator reacts in real time, al
ボリューム ブレイク オシレーターは、オシレーターの形で価格変動とボリューム トレンドを一致させるインジケーターです。 私はボリューム分析を戦略に統合したいと思っていましたが、OBV、マネー フロー インデックス、A/D、ボリューム加重 Macd など、ほとんどのボリューム インジケーターにいつもがっかりしていました。 そのため、このインジケーターを自分で作成し、その有用性に満足したので、市場に公開することにしました。 主な機能: ボリュームの増加 (ブレイク) によってサポートされる方向に価格が動くフェーズを強調します。 ボリュームの増加が止まり、市場が縮小するフェーズを強調します。 特に時間枠 (<=15 分) のデイトレードでは、価格もボリュームも動かないため、市場が将来の動きに備えられるフェーズを強調します。 ボリュームの増加によってサポートされていない場合、他のエキスパート アドバイザーからの誤ったシグナルをフィルターします。 トレンドとレンジ フェーズを非常に簡単に視覚化できます 入力パラメーター: 計算設定: 計算タイプ: FAST、NORMAL、SLOW。同じ
Scalper Inside PRO は日中トレンドの分析を助け、エントリー前にトレードを組み立てられるインジケーターです。中核となるのは、相場をより正確に読むための3つの専用ストラテジー。シグナルが出た瞬間に方向を自動で判断し、主要な価格帯を計算するので、想定エントリーポイント、予想ストップロス、複数の利確レベルを前もって確認できます。詳細なパフォーマンス統計が、各銘柄とストラテジーが過去にどう機能したかを示し、今の相場に合った資産選びを助けます。単体のスキャルピングツールとしても、あなたのシステムの一部としても、自作 EA のベースとしても使えます。MetaTrader 4 プラットフォームで動作します。 インジケーターはエントリー、3つの利確レベル - TP1、TP2、TP3、そして任意のストップロスをチャート上に直接表示します。自作の矢印インジケーターを接続し、その統計と収益性を検証することも可能です。 ご購入後は直接ご連絡ください。専用のボーナス add-ons、実トレードでの活用に関する追加情報、そしてご自身のトレードシステムや EA への正しい接続のサポートをお渡しします
UPD1 Volume BOX
Vitaliy Kuznetsov
4.94 (16)
インジケーターは、指定された領域(BOX)の水平ボリュームプロファイルと最大ボリューム(POC)を表示します。 製品の特徴 。 1. ダニまたは価格だけを使用できます。 2. アダプティブグリッド間隔(M1-MN)。 3. ボックスサイズに応じた適応型大容量(中央値)検索ステップ。 4. ボックスラインとボタンの自動カメレオンカラー。 5. 複数のボックス、作成と削除が簡単 。 6. 70%のボリュームエリア(設定で有効) 。 7. 最大水平ボリュームライン(POC)に触れるとアラートが表示されます 。 8. VWAP 。 9. コントロールパネル 。 ボリュームプロファイルインジケーターで市場を探索します。 私は自分でやったのですが、今ではあなたも利用できます。 主な設定 。 Calc Histo Mode – ヒストグラムの計算方法 (Market Profile – 価格による計算, Tick Volume Profile – ダニによる計算) 。 Mode Step In Pips – ピップによる中央線の計算 。 Vertical Step – ヒストグラムの垂直ステッ
トレンドトレーディング は、タイミングのプルバックとブレイクアウトにより、市場で起こっているトレンドから可能な限り利益を得るように設計された指標です。確立されたトレンドの中で価格が何をしているかを分析することにより、取引の機会を見つけます。 [ インストールガイド | 更新ガイド | トラブルシューティング | よくある質問 | すべての製品 ] 自信を持って効率的に金融市場を取引する むち打ちにならずに確立されたトレンドから利益を得る 収益性の高いプルバック、ブレイクアウト、早期の逆転を認識する この指標は、独自の品質とパフォーマンスを分析します 複数時間枠のダッシュボードを実装します インジケーターは再描画されていません 電子メール/音声/視覚アラートを実装します 確立されたトレンドは多くの取引機会を提供しますが、ほとんどのトレンド指標はそれらを完全に無視しています。インジケーターの解釈はかなり簡単です: (1) トレンドの変化 (2) トレンドの方向への後退 (3) トレンドの方向へのブレイクアウト 赤いダッシュ は下降トレンド中の修正です 青いダッシュ は上昇トレンド中
対称三角形パターンダッシュボードを使用すると、ここで利用可能な対称三角形パターンインジケーターによって描画される対称三角形パターンについて、複数の市場と時間枠を一度に監視できます。 https://www.mql5.com/en/market/product/68709/ 上記のインジケーターにアクセスして、対称的な三角形のパターンがどのように形成され、それらを取引するための戦略に従うのが簡単かについて詳しく学んでください。 ダッシュボードはスタンドアロン製品であり、インジケーターが機能する必要はありません。パターンを監視し、形成されたときにアラートを発行するだけなので、チャートでパターンを実際に確認したい場合は、対称的な三角形のパターンインジケーターも必要になります。 対称的な三角形のチャートパターンは、価格が上昇または崩壊することを余儀なくされる前の収縮と統合の期間を表しています。下のトレンドラインからのブレークアウトは新しい弱気トレンドの始まりを示し、上のトレンドラインからのブレークアウトは新しい強気のトレンドの始まりを示します。 このダッシュボードはこれらのパターンを識
これは、キャンドルの終値を予測する指標です。 このインジケータは、主にD1チャートでの使用を目的としていますが. この指標は、従来の外国為替取引とバイナリオプション取引の両方に適しています。 インジケーターは、スタンドアロンのトレーディングシステムとして使用することも、既存のトレーディングシステムへの追加として機能させることもできます。 このインジケーターは、現在のキャンドルを分析し、キャンドル自体の内部の特定の強度係数と、前のキャンドルのパラメーターを計算します。 したがって、この指標は、市場の動きのさらなる方向性と現在のキャンドルの終値を予測します。 この方法のおかげで、この指標は、短期の日中取引だけでなく、中期および長期の取引にも適しています。 インジケーターを使用すると、市場の状況の分析中にインジケーターが生成する潜在的な信号の数を設定できます。 インジケーターの設定には、このための特別なパラメーターがあります。 また、インジケーターは、チャート上のメッセージの形式で、電子メールで、およびPUSH通知の形式で、新しい信号について通知することができます。 購入後は必ず私に書いて
Prop Firm Sniper MT4  is a professional market structure indicator that automatically identifies high-probability BUY and SELL opportunities using BOS and CHoCH analysis. Recommended Timeframes: For backtesting, use the indicator on   M5 or M15   for Gold (XAUUSD), and   M15 or H1   for more volatile Forex pairs such as   GBPUSD, USDJPY, EURGBP , and similar markets. CONTACT ME AFTER PURCHASE TO CLAIM YOUR FREE BONUSES! Prop Firm Sniper  is a professional market structure indicator designed t
PREMIUM SUPPLY AND DEMAND ZONES WITH ALERTS Premium Supply and Demand Zones with Alerts は、プロ仕様の スマートマネー(Smart Money)トレーディング指標 で、 機関投資家レベルの需給ゾーン と マルチタイムフレームのトレンドヒストグラム を組み合わせ、高精度の リジェクションエントリー を提供します。 本指標は、メインチャート上で プレミアムな需給ゾーン を自動検出し、 強力なヒゲ反発ロジック によってエントリーを確認します。シグナルは 支配的なトレンド方向にのみ発生 し、そのトレンドは 需給ヒストグラム によって明確に判定されます。 主な強み ヒストグラムはトレンドのフィルターです。 高時間足で 需要が優勢か供給が優勢か を視覚的に示し、 市場の力に沿った取引 を可能にします。 ゾーン品質のコントロール(あなたの優位性) SwingDepth パラメータ を調整することで、トレーダーは プレミアムゾーン を正確に設定可能です: SwingDepth が大きい → 強力で機関レベルのゾー
作者のその他のプロダクト
QCL Dynamic RSI Zones — MetaTrader 5 QCL Dynamic RSI Zones combines a smoothed RSI signal with adaptive boundaries to help you assess momentum in the context of recent market conditions. Instead of relying on fixed overbought and oversold levels, the indicator adjusts its zones using recent RSI behavior. A dynamic balance line, a color-changing signal, and excursion columns provide a clear view of momentum shifts in a separate chart window. Key Features Adaptive zones: Upper and lower boundaries
FREE
QCL Market Structure Zones is a chart-based analytical indicator for identifying confirmed swing points, supply and demand zones, and breaks of market structure. The indicator uses confirmed swing highs and swing lows to create volatility-adjusted zones. Zone height and overlap filtering are calculated using the Average True Range, allowing the indicator to adapt to different symbols and timeframes. Main features Confirmed swing high and swing low detection Automatic supply and demand zones Aver
FREE
QCL Bollinger Trend Trail Follow trend direction with a clear, adaptive line directly on your price chart. QCL Bollinger Trend Trail combines trend detection with integrated volatility filtering to display a trailing reference line. Its two-color presentation helps you identify rising, falling, and unchanged trend conditions without adding a separate indicator window. The line advances as the trend develops and holds its position when conditions do not support further movement. Key Features Adap
FREE
QCL Market Structure Zones is a free market structure indicator for MetaTrader 4. It identifies confirmed swing points, creates volatility-adjusted supply and demand zones, and marks Break of Structure events directly on the price chart. The indicator can also display Higher High, Lower High, Higher Low, and Lower Low labels together with an optional pivot-based ZigZag. It is designed for visual market analysis and does not open, modify, or close trades. Main Features Confirmed swing high and sw
FREE
QCL Dynamic RSI Zones — MetaTrader 4 QCL Dynamic RSI Zones combines a smoothed RSI signal with adaptive boundaries to help you assess momentum relative to recent market conditions. Instead of relying on fixed overbought and oversold levels, the indicator adjusts its zones using recent RSI behavior. A dynamic balance line, a color-changing signal, and excursion columns display momentum conditions in a separate chart window. Key Features Adaptive boundaries: Upper and lower zones respond to recent
FREE
QCL Bollinger Trend Trail — MT4 Track trend direction with an adaptive trailing line directly on your MetaTrader 4 chart. QCL Bollinger Trend Trail combines trend detection with integrated volatility filtering to provide a clear visual reference alongside price action. Its two-color line advances as a trend develops and holds its position when conditions do not support further movement. Key Features Adaptive trailing line: Follows developing price movements. Directional colors: Distinguishes upw
FREE
QCL Adaptive Band Oscillator — MetaTrader 5 A smooth 0–100 oscillator with adaptive reference bands for a clearer view of price momentum. QCL Adaptive Band Oscillator combines smoothed price calculations with dynamic upper and lower reference bands. Displayed in a separate indicator window, it helps you examine momentum swings, potential turning points, and divergences between price and the oscillator. A smooth transformation keeps the oscillator and both reference bands within the 0–100 range ,
FREE
QCL Clouds for MetaTrader 4 is an adaptive market-regime indicator designed to display trend direction, momentum transitions, and dynamic price zones in a clean and practical format. The indicator combines its internal calculations into color-changing signal-line segments, crossover dots, and a projected market cloud. The simplified presentation helps traders identify directional changes without placing multiple overlapping lines on the chart. HOW TO READ QCL CLOUDS • Blue Signal Line Indicates
QCL Clouds is an adaptive market-regime indicator designed to present trend direction, momentum transitions, and dynamic price zones in a clean and easy-to-read format. Instead of displaying multiple overlapping lines, the indicator combines its calculations into one color-changing signal line, crossover dots, and a projected market cloud. HOW TO READ QCL CLOUDS • Blue Signal Line Indicates that bullish conditions are currently dominant. • Orange Signal Line Indicates that bearish conditions are
フィルタ:
レビューなし
レビューに返信