 MetaTrader 5
 エキスパート
 インディケータ
 ライブラリ
 ユーティリティ
 ウィジェット
 ルール
YouTubeにあるマーケットチュートリアルビデオをご覧ください
ロボットや指標を購入する
仮想ホスティングで
EAを実行
EAを実行
ロボットや指標を購入前にテストする
マーケットで収入を得る
販売のためにプロダクトをプレゼンテーションする方法
MetaTrader 4のための新しいエキスパートアドバイザーとインディケータ - 199
 自動売買ロボットは市場取引を自動的に実行しますが、インジケータを使用すると、相場をより適切に分析し、価格行動を予測できます。
これらのアプリケーションを使用すると、より多くの機会を獲得しながら、より多くの情報に基づいた方法でMetaTrader4で取引を実行できるようになります。
MACD Pro - Features a built-from-scratch overhauled MACD indicator - Signals Buy and Sell Zones - Uses an exceptional noise cancelling filter - Signals up trends and down trends - Precise and accurate signals
MACD Pro is an indicator built from the ground up and is designed to signal optimal buy and sell zones. Take buy trades in the buy zones and sell trades in the sell zones. It includes a noise cancelation feature which rivals the best products on the market.

Rainbow Ribbon - Rainbow MA bands - Useful for spotting trend changes - Useful for spotting trend slopes - Useful for spotting trend acceleration - Ability to choose ribbon colors, moving averages, and distances - Provides colorful rainbow ribbons to show an array of moving averages
Rainbow Ribbon is an extremely useful indicator, it has been designed to make it easy to spot the trend and also changes within the trend before they occur. It can be used many different ways and provides the abili
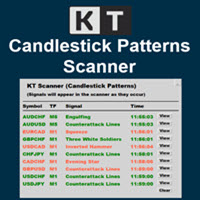
KT Candlestick Patterns Scanner is a Multi-Symbol and Multi-Timeframe scanner that fetches and shows various candlestick patterns on 28 currency pairs and 9 time-frames concurrently . The scanner finds the candlestick patterns by loading the KT Candlestick Patterns indicator as a resource in the background.
Features
The scanner can find the candlestick patterns on 252* combinations of symbols and time-frames from a single chart. Open the signal's chart loaded with a predefined template with a s
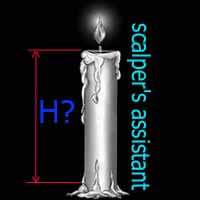
Индикатор "TakeOver" простой в использовании, создавался он для удобства определения разницы между открытием и закрытием текущей свечи. "TakeOver" рекомендуется применять в скальпинге с различными стандартными индикаторами МТ4, к примеру Envelopes, ZigZag, RSI и т.д. В настройках по умолчанию установлены уровни 200 и -200, но вы можете самостоятельно изменить. Один из примеров обнаружения входа в открытие сделки изображено на скриншоте, SELL если свеча закрылась выше уровня Envelopes и гистогра

Time frame: M1
Leverage : Higher the better
Spread: Lower the better
Account type : All types
(EA may enter hedge positions, if you want to disable this feature deactivate either Buy, or Sell from the setting)
Please please do not take unnecessary risks. (Trading is risky, and there are no guarantees for winning)
We wish you successful trading. (Trading is risky, and there are no guarantees for winning
Starkiller Grid Trader Starkiller Grid Trader is a MT4 trading robot which specializes in the management of grid trading systems. A very large variety of customizable settings are included to make sure that you are able to place grid trades on any currency pair, stock, index or commodity automatically according to your own liking. Starkiller is accurate, versatile and robust. - Includes numerous grid trading settings - Includes the ability to select open/close indicators - Includes color coded

Time frame: M1
Leverage : Higher the better
Spread: Lower the better
Account type : All types
(EA may enter hedge positions, if you want to disable this feature deactivate either Buy, or Sell from the setting)
Please please do not take unnecessary risks. (Trading is risky, and there are no guarantees for winning)
We wish you successful trading. (Trading is risky, and there are no guarantees for winning

Time frame: M1
Leverage : Higher the better
Spread: Lower the better
Account type : All types
(EA may enter hedge positions, if you want to disable this feature deactivate either Buy, or Sell from the setting)
Please please do not take unnecessary risks. (Trading is risky, and there are no guarantees for winning)
We wish you successful trading. (Trading is risky, and there are no guarantees for winning

Sistema de trading automático adaptado a la volatilidad de la sesión de New York. Se basa en la ruptura de un rango de baja volatilidad con el objetivo de aprovechar diariamente el movimiento fuerte de la sesión americana. El sistema cuenta con parámetros de manejo de riesgo por porcentaje, parámetros de Stop Loss, Take Profit, Break Even, Tambien cuenta con parametro para cantidad de operaciones diarias y validación de entrada por cierre de vela o ruptura de precio.

Simple Order Panel for calculating actual lot size with fixed risk amount. Working on both Market orders and pending orders. Notify Line Application when an order is opened or closed. Automatic set up Stoploss and Takeprofit with Risk Reward Ratio. Open one order with the risk(amount) per trade or separate the bet into three orders in one click. Involuntary modification Stopsloss to Breakeven when the Market takes the first or second-order profit. Filter button Buy or Sell when Moving Averate C

デイトレーダーマスターは、デイトレーダーのための完全なトレーディングシステムです。システムは2つのインジケーターで構成されています。 1つの指標は売買する矢印信号です。それはあなたが得る矢印インジケーターです。 2つ目のインジケーターを無料で提供します。 2番目のインジケーターは、これらの矢印と組み合わせて使用するために特別に設計されたトレンドインジケーターです。 インジケーターは繰り返さず、遅れないでください! このシステムの使用は非常に簡単です。 2色の線で表示されている現在のトレンドの方向に矢印信号をたどる必要があります。青は買いの傾向です。赤い色は売りの傾向です。青い矢印は買いシグナルです。赤い矢印は売りの合図です。トレンドラインの色と一致するように、矢印の色と信号の方向が必要です。 矢印インジケーターは、主に時間間隔M5とM15での日中取引のために作成されました。ただし、技術的には、システムは他の時間間隔で使用できます。 インジケータには、PUSHメッセージ機能を備えたポップアップアラートが装備されています。 購入後、必ず私に書いてください!私はあなたにシステムとの取引の

KT Auto SL TP EAは、すべての手動取引にストップロスとテイクプロフィットを追加し、その後ストップロスを建値(ブレークイーブン)に移動してトレーリングします。 パソコンでもスマートフォンでも、取引を開いてください。すぐにストップロスとテイクプロフィットが設定され、チャート上のラベルに使用中の設定がそのまま表示されます。このEAが自分で取引を開いたり決済したりすることはありません。 主な機能 成行の取引と待機注文に、あなたのストップロスとテイクプロフィットを追加します。対象はチャートの銘柄だけ、または1つのチャートからすべての銘柄を選べます。 管理するのはあなたの手動取引だけで、他のEAの取引には触れません。 新しいティックを待たず、1秒間に約7回取引をチェックします。 待機注文のレベルは注文価格から設定されるため、注文が約定した時点で保護が整っています。 ブローカーの最小ストップレベルより小さい距離は、その最小値まで広げます。 ブレークイーブンとトレーリングストップ 取引が設定した利益に達すると、EAはストップロスをエントリー価格に移動します。オプションのオフセットで数ポイ

KT Coppock Curve は、平滑化したモメンタムを市場の方向性として分かりやすく表示します。価格チャートの下にある別ウィンドウで動作し、ゼロラインが主な基準になります。曲線の細かな変化に毎回反応するのではなく、モメンタムが強気側と弱気側のどちらにあるかをすぐに確認できます。 この曲線は、長期と短期の変化率を組み合わせ、その結果を平滑化します。そのため、速いオシレーターに出やすいノイズを抑えながら、より大きなモメンタムの変化を追うのに適しています。 最初に位置を確認し、次にクロスを見る 曲線がゼロより上にあるときは、プラスのモメンタムが優勢です。ゼロより下にあるときは、マイナスのモメンタムが優勢です。曲線がゼロラインの片側にとどまっている間は、ローソク足が増えるたびに見方を変えず、現在の方向圧力に合わせやすくなります。 ゼロラインを上抜けると上向き矢印が表示され、下抜けると下向き矢印が表示されます。クロスの正確な位置を目で判断しなくても、新しいモメンタムの変化を簡単に見つけられます。 実際の取引手順への取り入れ方 方向フィルターとして使う場合は、曲線がゼロより上にある間は買いセ

Expert Advisorは、複数の商品を取引することでトレンドの反転を検出するように設計されています
ここで使用されるアルゴリズムは、市場のすべての主要なシンボルのニューラルネットワークに基づいてトレンドを正確に検出し、入口と出口の信号を生成します。
Expert Advisorは積極的な管理と取引方法を備えており、短時間で大きな利益を得ることができます。
設定は$1000の最小預金のために設計されています..$優先額2500
取引時間枠はM15/H1 / H4/D1です。
•最低保証金1000ドル(トレーディングペアあたり)
•滑りを最小限に抑えたブローカー。
•あらゆるタイプのアカウント
•レバレッジ1:100以上
•セットアップと使用が非常に簡単
FREE
デュアルライン信号、ゼロレベルシステム、マルチタイムフレーム対応、カスタマイズ可能なビジュアル信号、高度に設定可能なアラートシステムを備えた高度な相対活力指数(RVI)インジケーター。
フリーランスプログラミングサービス、アップデート、その他のTrueTL製品は私の MQL5プロフィール からご利用いただけます。
フィードバックとレビューを心よりお待ちしております!
相対活力指数(RVI)とは? 相対活力指数(RVI)は、John Ehlersが開発したモメンタム・オシレーターで、トレーディングレンジで正規化しながら、終値と始値の相対的な関係を比較することで、直近の価格変動の確信度を測定します。基本原理は、強気市場では終値が始値より高くなる傾向があり、弱気市場ではその逆が成り立つというものです。 RVIはゼロラインの周りを振動します——正の値は強気のモメンタムを示し、負の値は弱気のモメンタムを示します。インジケーターは2本のラインで構成されています:メインライン(RVI値)とシグナルライン(メインラインの4本バー対称加重移動平均)。これら2本のライン間のクロスオーバーはエントリー
FREE

私たちのインジケーターは、複数のペアのスプレッドを同時に監視するスプレッドスクリーナーを提供します。また、キャンドルタイマーのカウントダウンは、現在のバーが閉じて新しいバーが形成されるまでの残り時間を表示します。
期間限定オファー:すべてのプレミアムインジケーターはわずか50ドルでご利用いただけます。MQL5ブログにアクセスすると、プレミアムインジケーターのすべての詳細を確認できます。 ここをクリック。
主な機能 同時に広がるマルチペアを監視します。 現地時間ではなく、サーバー時間を追跡します。 構成可能なテキストの色とフォントサイズ CPU使用率を削減するために最適化 ペアのパーソナライズされたリスト。 コンタクト ご不明な点がある場合やサポートが必要な場合は、プライベートメッセージでご連絡ください。
警告 警告すべてのインジケーターとツールは、公式のMetatrader Store(MQL5 Market)からのみ入手できます。
著者 SAYADI ACHREF、フィンテックソフトウェアエンジニアおよびFinansyaの創設者
FREE
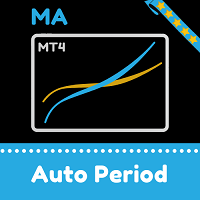
移動平均は移動中に変化します。 インジケータは、移動平均を計算する期間を自動的に選択します。 動きの方向性が高いほど、平均化期間は長くなります。 トレンドが遅くなると、移動平均の期間が減少し、より速くなります。 これは傾向の変更により速く反応することを可能にする。
この指標は、トレンドまたはトレンド反転ポイントでうまく機能します。 横方向では、速い動きのあるものが遅いものを上に横切るときなど、インジケータは逆の方法で使用することができます-これは売りシグナルです。 または、チャネルを使用しておおよその購入ゾーンまたは販売ゾーンを決定することもできます。 チャンネル表示は、設定で有効にすることができます。
パラメータ:
自動計算のためのバー-このバー数について、インジケータは極端を検出し、最後の極端な時間に応じて移動平均の期間を計算します。
乗数-移動平均の差を設定します。
速度-ある期間から別の期間への移動平均の移行率を変更します。
channel-チャンネル表示を有効または無効にします。
インターフェイスの利便性のために他の設定もあります。
移動平均の期間を変更
FREE

Adviser-1つのMT5アカウントまたはMT4アカウントから別のMT4アカウントにトランザクションをコピーするためのユーティリティ。 Demo-version can be downloaded here .
ネッティング勘定とヘッジ勘定の間でポジションを任意の組み合わせでコピーできます。 あなたは、楽器の名前とコピーされる位置のマジックナンバーでフィルタを設定することができます。 これまでのところ、ソースは市場の位置に関する情報のみを送信します。 保留中の注文は、公開市場のポジションに変わると処理されます。
一方の端末では、アドバイザーは送信者モード(送信者)で起動され、他方では受信者モード(受信者)で起動されます。
端末は、データを交換するのと同じ共有データフォルダを持つように、同じサーバー上で動作する必要があります。
インストール手順
送信者アカウントの端末では、送信者モードで顧問を起動し、一般的なパラメータを設定します。 受信機アカウントの端末では、受信機モードでアドバイザーを起動し、受信機の一般的なパラメータとパラメータを設定します。
MT4->MT
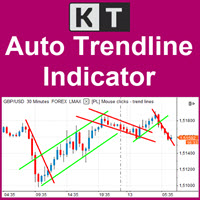
重要なトレンドラインをチャート上で自動更新 KT Auto Trendline は、最近の ZigZag スイングポイントから上側と下側のトレンドラインを自動で作成し、現在のチャート上で両方を将来方向へ延長します。同じラインを何度も手動で引き直すことなく、形成中のブレイクアウト、反発、価格方向の変化を明確な構造として確認できます。 近い値動きと広いスイング構造を同時に確認 最初のトレンドラインセットは初期設定で有効になっており、反応性の高い ZigZag 設定を使用します。より広い視点が必要な場合は、2番目のセットを有効にすると、独自の感度を持つ別の上側と下側のラインが追加されます。1つのチャートで、直近の価格構造とより大きな市場スイングを比較できます。 各トレンドラインセットの反応を調整 Show First Trendline: メインの上側と下側の延長ラインを表示または非表示にします。 Depth、Deviation、Back Step: 最初の ZigZag セットがスイングポイントを検出する感度を調整します。 Show Second Trendline: オプションの2番目の

ROC は、現在の価格が以前の期間と比べてどれだけ速く変化したかを測ります。そのため、価格が新しいスイング高値や安値を付けても、その動きを支えるモメンタムが追随していない場面で特に役立ちます。KT ROC Divergence はこの食い違いを自動で見つけ、価格チャートと ROC ウィンドウの両方に対応するラインを描きます。 一定の範囲内で動くオシレーターとは異なり、ROC の値幅は市場の速度に応じて広がったり縮んだりします。異なる銘柄どうしで数値そのものを比較する必要はありません。重要なのは、価格のスイングとオシレーターのスイングの関係です。 四つのパターンをトレーダーの言葉で理解する 通常の強気ダイバージェンス: 価格が安値を切り下げる一方で、ROC は安値を切り上げます。価格が下落を続けていても、売りのモメンタムが弱まっている可能性があります。 通常の弱気ダイバージェンス: 価格が高値を切り上げる一方で、ROC は高値を切り下げます。価格がまだ上昇していても、買いのモメンタムが衰えている可能性があります。 隠れた強気ダイバージェンス: 価格が安値を切り上げる一方で、ROC は安値

A unique Expert Advisor for processing reverse price divergence. The EA determines both trend direction and reversal patterns using reverse divergence. Divergence is the strongest signal of indicator analysis. Its essence lies in the formation of a new extremum in the price in the direction of the dominant trend if this extremum is not updated in the indicator. The price continues to move along the trend, while the indicator says that the trend has weakened and continues to move only by inertia,
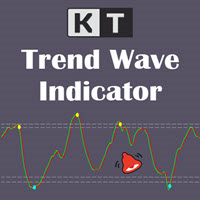
市場の状況とともに Trend Wave の交差を確認 KT Trend Wave は価格の動きを、メインのウェーブと平滑化されたシグナルラインを持つ見やすいオシレーターに変換します。価格チャートの下にある独立したウィンドウに表示されるため、ローソク足を隠さずにウェーブ、基準領域、交差マーカーを確認できます。 ライン、領域、マーカーを組み合わせて読む 黄緑色のメインライン: より速く反応するトレンドウェーブを表示します。 赤色のシグナルライン: ウェーブを平滑化し、方向の変化を比較しやすくします。 水色の上向きマーカー: 下側の基準領域でメインラインがシグナルラインを上抜けた強気の交差を示します。 黄色の下向きマーカー: 上側の基準領域でメインラインがシグナルラインを下抜けた弱気の交差を示します。 チャートを複雑にせず反応を調整 Wave Period はメインウェーブの価格への反応を調整し、Avg. Period はウェーブに適用する平滑化を調整します。History Bars は処理する過去のバー数を制限します。長い技術設定の一覧を使わずに、反応性、滑らかさ、履歴の深さのバランスを
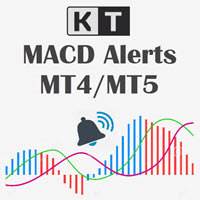
明確な MACD モメンタムシグナル KT MACD Alerts は、見やすく色分けされた MACD 表示により、市場の方向性とモメンタムの変化を把握しやすくします。強気と弱気のクロスを簡単に確認でき、チャート上の垂直線と柔軟なアラート機能が新しいシグナルへの注目をサポートします。 シグナルはローソク足の確定後に確認されるため、チャート全体の MACD モメンタム変化を明確かつ一貫して把握できます。 強気と弱気を色分けした MACD 表示。 クロスシグナルを素早く見つけるための明確な垂直線。 調整可能な MACD 期間と適用価格。 ラインの色、太さ、スタイル、チャートへの延長をカスタマイズ可能。 9つの時間足に対応する MACD スキャナー 内蔵ダッシュボードは、現在のチャート銘柄について M1、M5、M15、M30、H1、H4、D1、W1、MN1 の9つの時間足における MACD の方向を表示します。各行は最新の確定データに基づいて Bullish、Bearish、Neutral を表示し、短期的なモメンタムと大きな市場方向をひと目で比較できます。 スキャナーは各時間足から MAC

KT Heiken Ashi Alert は、標準的な平均足(Heiken Ashi)ローソク足に基づいて、買い・売りの矢印を表示し、アラートを生成するインジケーターです。Heiken Ashi をトレード戦略に取り入れたいトレーダーにとって、必須のツールです。 平均足が弱気から強気に変わったときに買い矢印が表示されます。 平均足が強気から弱気に変わったときに売り矢印が表示されます。 モバイル通知、メール通知、サウンド、ポップアップアラートを搭載。
Heiken Ashiとは? 日本語で「Heiken Ashi(平均足)」は「平均バー」を意味し、ローソク足チャートをより見やすくし、トレンドの把握をしやすくします。トレーダーは Heiken Ashi をエントリー・エグジットの両方に活用できます。色の変化は、相場の方向転換を示すことがよくあります。
覚えておきたいポイント
Heiken Ashi Alert を単体で使うのではなく、他のインジケーターと組み合わせて使用することで精度が向上します。 トレンド転換は、上下ヒゲのある小さなローソク足から始まることが多いです。 上ヒゲのない赤

KT Pip Counter は、リアルタイムで重要な数値を表示するシンプルかつ実用的なインジケーターです。現在の損益やスプレッド、残り時間などを素早く把握できるため、緊張感の高いトレード中でも客観的な判断を下しやすくなり、無駄なストレスを軽減しながら取引戦略を最適化できます。
特徴
現在の損益を通貨・pips・パーセンテージで同時表示。 最新スプレッドを即時に表示。 現在のバーがクローズするまでの残り時間をカウントダウン。 損益状況に応じた色分けで視認性を向上。 テキストの位置とレイアウトは完全にカスタマイズ可能。 CPU 使用率は極めて低く、プラットフォームの動作を妨げません。
入力パラメータ Account P&L: true にすると口座全体の損益を表示し、false なら現在のシンボルのみ表示。 カラーおよびフォントサイズの設定。 Show After Current Bar: true の場合、情報はバー確定後に表示し、false の場合はチャート四隅に固定。 その他の入力項目は直感的で分かりやすい設定です。

KT Pivot Points は、最新の市場データに基づいて、日足・週足・月足のピボットレベルをチャート上に自動で表示します。ピボットポイントは、特にFX市場において、テクニカル分析で広く利用されている指標の一つです。
特徴
価格がピボットレベルに到達した際にアラートを送信します。 各種類のピボットレベルに対して完全なカスタマイズが可能です。 シンプルな表示で、日足・週足・月足のピボットレベルを一目で確認できます。 最小限のCPUリソースを使用し、高速な計算を実現します。 チャート上の他のインジケーターとも互換性があります。
ピボットポイントとは ピボットポイントは、前の取引日の高値、安値、終値の平均から算出されます。 この計算により、将来のサポートおよびレジスタンスレベルを予測でき、価格がこれらのレベル付近でどのように動くかを判断する手助けとなります。 また、価格がピボットポイントの上にあるときは強気傾向、下にあるときは弱気傾向とされるのが一般的です。
ピボットの計算式
ピボットレベルの計算には、前日、週、または月の高値、安値、終値が使用されます。 P = (H +
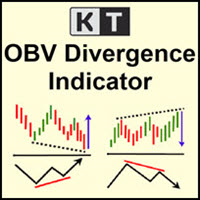
KT OBV Divergence は、価格と OBV(オンバランスボリューム)オシレーターとの間に形成される通常および隠れたダイバージェンスを表示します。
機能
非対称なダイバージェンスは除外され、精度が向上し、チャートの見やすさも保たれます。 トレンドの反転とトレンド継続の両戦略に対応。 エキスパートアドバイザーへの組み込みに完全対応。 エントリーにもエグジットにも使用可能。 すべての MetaTrader アラートに対応。
ダイバージェンスとは何か?
テクニカル分析において、価格が高値を更新している場合、オシレーターも同様に高値を更新すべきです。価格が安値を更新している場合も、オシレーターはそれに追随すべきです。このような通常の関係が崩れたとき、価格とオシレーターが乖離(ダイバージェンス)していると判断されます。 ダイバージェンスには、以下の2つの主要な種類があります: 通常の強気ダイバージェンス: 価格がより低い安値をつけるが、オシレーターはより高い安値をつける場合。 通常の弱気ダイバージェンス: 価格がより高い高値をつけるが、オシレーターはより低い高値をつける場合

KT Currency Strength Meter は、主要なFX通貨ペアに集約された数学的計算式を適用することで、各通貨の強さと弱さを測定します。 固定された期間内の強気および弱気のローソク足に基づいて通貨の強さが計算されます。その後、アルゴリズムが最も強い通貨と最も弱い通貨をリアルタイムのデータで並べ替え、継続的に順位を更新します。
利点
強い通貨に対して弱い通貨を買うような誤った取引シグナルを除外することで、トレーディング戦略を即座に改善できます。 意図しないヘッジ取引や過剰取引を回避します。 最強通貨に対して最弱通貨を買うといった、リスクの高い逆張り取引を避けられます。 互いに打ち消し合うようなポジションをフィルタリングします。 最新データを用いてリアルタイムで更新されます。 軽量設計でPCのリソースを最小限に抑え、他のインジケーターやEAに影響を与えません。 各通貨に専用カラーが割り当てられており、識別が簡単です。 複雑な設定は不要で、シンプルで直感的な入力パラメータ。
プロのヒント データは現在の時間足から取得されるため、低い時間足での使用は避けてください。データの変
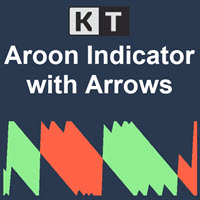
KT Aroonオシレーターは、Tushar Chande氏が1995年に開発した元のAroonオシレーターを改良したバージョンです。現在の高値および安値間の時間間隔を測定し、その情報をもとに市場トレンドの方向と強さを計算します。 このインジケーターは、上昇トレンド中には連続して新高値が形成され、下降トレンド中には新安値が形成されるという概念に基づいています。 買いシグナル: Aroon UpラインがAroon Downラインを上抜けたとき。
売りシグナル: Aroon DownラインがAroon Upラインを上抜けたとき。
特徴
チャート上にAroonシグナルを示す上下の矢印を表示。 市場のトレンドを効率的に表示。 シンプルで視認性が高く、チャートが煩雑になりません。 すべてのMetaTraderアラートに対応。
入力項目 期間: Aroon UpおよびDownラインの計算に使用される期間。 上下矢印の表示: Trueに設定すると、各新しいシグナルでチャートに矢印を表示します。 アラート設定: ポップアップ、サウンド、モバイル通知、メールなどの各種アラートを設定可能。
Ar
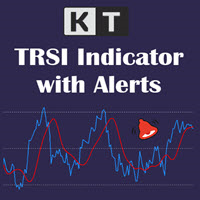
KT TRSI は、RSI(相対力指数)、EMA(指数移動平均)、SMA(単純移動平均)を組み合わせて作られたオシレーターです。従来のRSIと比較して、TRSIはSMAのスムージング効果により、偽のシグナルに対する感度が低くなります。また、MetaTraderのすべてのアラート機能にも対応しています。
シンプルなエントリールール
買い:青いライン(RSI)が赤いライン(TRSI)を上抜けたとき。 売り:青いライン(RSI)が赤いライン(TRSI)を下抜けたとき。
高度なエントリールール 買い:青いライン(RSI)が売られすぎレベルを下回り、その後再び上回り、赤いライン(TRSI)と強気のクロスオーバーが発生したとき。 売り:青いライン(RSI)が買われすぎレベルを上回り、その後再び下回り、赤いライン(TRSI)と弱気のクロスオーバーが発生したとき。
より正確な判断を行うには、TRSIに加えて他のインジケーターや確認シグナルを併用することが重要です。
TRSIの計算式
トリプルEMA = RSIのEMAのEMAのEMA。 TRSI = トリプルEMAのSMAを3バー右にシフトしたも

Magic Night is an automated trading system that uses a channel indicator and candlestick patterns to open and close trades.
Trades every day at a specific time.
Doesn't use grid, martingale or other dangerous money management methods.
Timeframe М5, currency pairs EURAUD, EURCAD, GBPCAD, GBPUSD Minimum deposit 70 usd.
Live signal https://www.mql5.com
Instructions for installing https://Blogs Magic Night
Download set files https://Sets Magic Night
Settings EA Order_Comment - Order com

Bitsgap scalping bot is a fully automatic scalping trading system. This robot automatically analyzes the market using the ATR indicator. Then the robot automatically opens and closes orders. The robot automatically calculates the lot of opened trades to achieve maximum efficiency with minimal drawdown.
Recommendations: run the robot on an ECN account. minimum deposit 200$ currency pair GBPUSD timeframe H1
Robot Advantages: does not use martingale. does not use a grid. does not use hedging. do

時間と価格のグリッドラインを見やすい、キリの良い時間で表示します。
設定した時差と間隔で時間ラインを表示します。(30分単位の時差には対応していません。) また、100.000、100.010、100.020のようにキリの良い価格で設定した間隔で価格ラインを表示します。 標準ではMT4による時間と価格でグリッドラインが表示されていますが、ブローカーの時間となり価格とともに中途半端な位置で表示されるので、非常に分かりにくいものとなっています。 本インジケーターは ユーザーが設定した時差と価格の分かりやすい位置でグリッドラインを表示します 。他のEAや裁量取引に負荷をかけないよう、軽快に動作するよう実装しております。
MT5版: https://www.mql5.com/ja/market/product/107069
・設定した間隔で時間と価格を表示可能 ・2段表示で見やすい 西暦、日付、時刻を2段で分けて表示。 ・未来の時間も表示 ・3大市場の時間を色分け表示 ・月日、時間の表示形式を設定可能 ・毎日の特別な時間にラインを表示可能 毎日の注目したい時刻にラインを表示することができま
MACD Divergence Scanner is a multi-timeframe and multi-symbol dashboard and alert that checks all timeframes and symbols to find regular and hidden divergences between price chart and MACD indicator. This divergence scanner is integrated with support and resistance zones so you can check the MACD divergences in the most important areas of the chart to find trend reversals in the price chart. Download demo version (works on M 1,M5,M30,W1 timeframes) Full description of scanner parameters ->

Place Forex trades in different Metatrader accounts at the same time with Local Trade Copier software.
Become a private and independent account manager!
CopyTrade System will allowed you to managment account as Profissional...
Open two separate metatrader accounts, place same EA in experts folder... Reboot MT4 platforms, place EA Master on one Platform, and EA Slave on another platform.
How to use: - Place manual trades on Master account, they will be copied on Slave account. If deal w

This Expert Advisor is used in tandem with the FiboMagic Pro indicator https://www.mql5.com/ru/market/product/64978?source=Site +Profile
The FiboMagic Pro indicator shows you:
1) Which way to trade 2) Clear entry point criteria for breaking the counter-trend line in the Fibonacci structure 3) Clear exit criteria based on levels
The FiboMagic Auto Expert Advisor provides you with automatic trading based on the signals of the FiboMagic Pro indicator, namely:
- analyzes the breakout of the cou
A really simple strategy for be trading using M15 for EURUSD. Really impressive results... you just need to care your risk managment according to your account balance. Just one order at once... We suggest London and US opening hours. As you will see we are using GMT-3 for our operations... and a little volume and price action with Average True Range indicator in order to make decisions. Any additional question, just let me know.
Simple indicator that supports decision makers. You will have the candles directions for different timeframes on your screen. That will allowed you to be one more scenario to analyze before you open your orders. In case you would like to have more details, just let me know.. so we can add it to the chart. Multicurrency that in inform you the directions for multi-timeframes!

It is a new indicator that frames the price movement and tracks it. It consists of oscillation channel and its center line CL . For its calculation it is only necessary to introduce the amplitude of the channel. Because of this, it is a non-lagging indicator as it is not calculated based on a number of previous candlesticks. It removes any level of noise , showing the underlying price movement cleanly via the center line . It allows you to easily identify the beginnings and ends of the trend ,

EA SCALPER GHOST PRO
This is single Entry type EA. It use smart alghoritme to detect market movement. It also use Stop loss and take profit . EA will not use any dangerous system like martingale, grid, averaging etc which can cause account blown in a second Tis EA use More than one pair to reduce risk. Right now im using 13 pair at the same time
Settings Options: TF M5 Pair : Please use all pairs together (7 PAIRS) USDCHF, EURUSD, , AUDUSD, EURGBP, EURAUD, AUDCAD, EURCAD
USE SETFILE ON EACH

The programmable signal panel analyzes the charts of all available symbols and timeframes and sends a notification about the appearance of a trading signal. You can program all the necessary signals using the free binding indicator "Signal Collection". The binding indicator is provided with open source code. Thus, it is possible to program all the necessary signals for subsequent use in conjunction with the signal panel. The signal panel can not only analyze charts, but also manage these chart
FREE
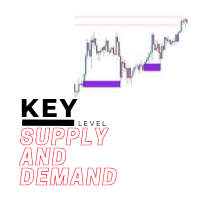
The key level supply and demand indicator is the first supply and demand indicator with options to change settings to show different zones, giving you the choice to pick the zones you see are being respected the most and saving the settings.
Advantages
The key level supply and demand DOES NOT REPAINT unlike other supply and demand currently in the market. This gives you a massive advantage to scroll back and see how price reacted on previous levels. The key level supply and demand has the opt
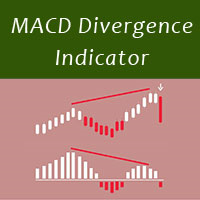
MACD divergence indicator finds divergences between price chart and MACD indicator and informs you with alerts (popup, mobile notification or email). Its main use is to find trend reversals in the chart. Always use the divergence indicators with other technical assets like support resistance zones, candlestick patterns and price action to have a higher possibility to find trend reversals. Three confirmation type for MACD divergences: MACD line cross zero level Price returns to previous H/L Creat
FREE

Run the robot on GBPUSD, H1 timeframe, minimum balance of $500 or more, ECN account type, leverage 1:100. The larger the balance, the smaller the drawdown will be. This robot analyzes the market using two indicators: ATR and Momentum. With the help of these two indicators, the robot finds points for opening trades. After the robot has opened trades, it starts to analyze them constantly. When the trade reaches the desired profit or loss, the robot closes it.
Recommendations for trading: ECN acc

Renko HMA Channel is a professional EA the uses Renko charts in combination with the Hull Moving Average.
Time Frame : This expert advisor works on all timeframes;
Account balance: it doesn't matter, but I recommend at least 1000 EUR or 1500 USD; Currency pair : Doesn't matter ; Warning! Do not use the default settings, always use optimization option in strategy tester to find the best settings for your broker, preferred chart and timeframe!
- Multiple user options, for finetuning

Currency Pair Information
Useful indicator to have the following information on the chart: 1. Asset Name 2. Current Spread 3. Current ATR of the actual time frame 4. Time to close of the candle
It is located at the top right of the chart. If you request it, I can add the parameterization of the location of the information.
Other tools:
AMS Forex System
hockfx Price Alert Pro
hockfx
FREE

About the Lyne indicator
Lyne is a Metatrader 4 (MT4) indicator, the essence of which is to transform the accumulated historical data.
The Lyne indicator makes it possible to detect various features and patterns in price dynamics that are invisible to the naked eye.
Based on this information, traders can anticipate further price movement and adjust their strategy accordingly.
This indicator has proven itself in the scalping strategy. The indicator works without repainting.

The Week7D indicator helps traders identify the day of the week on a price chart. It simply marks each period or each candle as the day of the week at the start of a new trading day. This allows traders to watch how prices move on any given day.
The Week7D indicator has several customization options that traders can use to change the visual representation of the indicator.
The variable "BarCount" changes the number of days during which the indicator will indicate the day of the week in each d
FREE

KT Average Daily Range(ADR) shows the upper and lower levels using the average daily range covered by the currency pair or the instrument. The average daily range is calculated using the chosen period in the input settings. ADR High: ADR upper level is found by adding the average daily range value to the current day's low.
ADR Low: ADR lower level is found by subtracting the ADR value from the current day's high.
Features
It shows the ADR levels with several other helpful information benefici
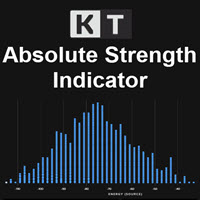
KT Absolute Strength measures and plots the absolute strength of the instrument's price action in a histogram form. It combines the moving average and histogram for a meaningful illustration. It supports two modes for the histogram calculation, i.e., it can be calculated using RSI and Stochastic both. However, for more dynamic analysis, RSI mode is always preferred.
Buy Entry
When the Absolute Strength histogram turns green and also it's higher than the previous red column.
Sell Entry
When th
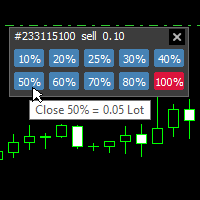
With this tool, you can easily and quickly close part of the trade . Click near the trade to display the closing panel. There are ten preset values for partial closing, but you can set your own values. You can also resize the panel according to Windows settings (125%, 150% ...) See the animation below for how it works. **********************************************************
Note: This tool does not work in the tester.
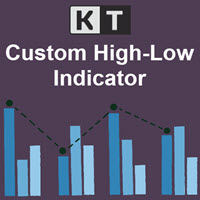
KT Custom High Low shows the most recent highs/lows by fetching the data points from multi-timeframes and then projecting them on a single chart. If two or more highs/lows are found at the same price, they are merged into a single level to declutter the charts.
Features
It is built with a sorting algorithm that declutters the charts by merging the duplicate values into a single value. Get Highs/Lows from multiple timeframes on a single chart without any fuss. Provide alerts when the current pri
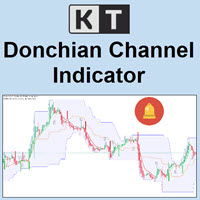
KT Donchian Channel is an advanced version of the famous Donchian channel first developed by Richard Donchian. It consists of three bands based on the moving average of last high and low prices. Upper Band: Highest price over last n period. Lower Band: Lowest price over last n period. Middle Band: The average of upper and lower band (Upper Band + Lower Band) / 2. Where n is 20 or a custom period value is chosen by the trader.
Features
A straightforward implementation of the Donchian channel ble
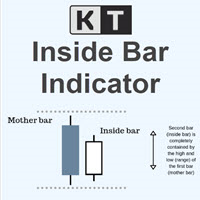
KT Inside Bar plots the famous inside bar pattern in which the bar carries a lower high and higher low compared to the previous bar. The last bar is also known as the mother bar. On smaller time-frames, the inside bar sometimes appears similar to a triangle pattern.
Features
Also plots entry, stop-loss, and take-profit levels with the inside bar pattern. No complex inputs and settings. Erase unwanted levels when the price reaches the entry line in either direction. All Metatrader alerts include
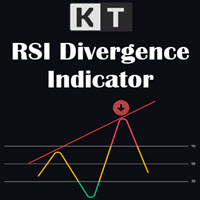
KT RSI Divergence shows the regular and hidden divergences built between the price and Relative Strength Index (RSI) oscillator. Divergence can depict the upcoming price reversal, but manually spotting the divergence between price and oscillator is not an easy task.
Features
Ability to choose the alerts only for the divergences that occur within an overbought/oversold level. Unsymmetrical divergences are discarded for better accuracy and lesser clutter. Support trading strategies for trend reve

Minimum deposit is 1000$ , or 1000 Cent = 10$. (Recommended 1500$) Every 1000$ = 0.01 Lot. Please stick to the rules, as we want you to win, win and win! (Trading is risky, and there are no guarantees for winning)
Time frame: M1
Leverage : Higher the better
Spread: Lower the better
Account type : All types
(EA may enter hedge positions, if you want to disable this feature deactivate either Buy, or Sell

This indicator detects trade direction and sends notification to your mobile phone so that you can enter/exit a trade without having to be seated in front of desktop computer all day and night. Although you have to execute/send an order yourself, you can setup rules through the setting made available for proper lots size base on the available balance/fund you are trading with. The opportunity to take a profit at the right time and set reasonable stop loss that will not be overwhelming and gett

Minimum deposit is 1000$ , or 1000 Cent = 10$. (Recommended 1500$) Every 1000$ = 0.01 Lot. Please stick to the rules, as we want you to win, win and win! (Trading is risky, and there are no guarantees for winning)
Time frame: M1
Leverage : Higher the better
Spread: Lower the better
Account type : All types
(EA may enter hedge positions, if you want to disable this feature deactivate either Buy, or Sell f

Time frame: M1
Leverage : Higher the better
Spread: Lower the better
Account type : All types
(EA may enter hedge positions, if you want to disable this feature deactivate either Buy, or Sell from the setting)
Please please do not take unnecessary risks. (Trading is risky, and there are no guarantees for winning)
We wish you successful trading. (Trading is risky, and there are no guarantees for winning

KT Fisher Transform is an advanced version of the original Fisher Transform oscillator equipped with divergence detection, crossover alerts, and many more features. Originally it was developed by John F. Ehlers. It converts the asset's price into a Gaussian normal distribution to find the local extremes in a price wave.
Features
A light-weighted oscillator that efficiently identifies the upward and downward crossovers and marks them using vertical lines. It also finds regular and hidden diverg

Time frame: M1
Leverage : Higher the better
Spread: Lower the better
Account type : All types
(EA may enter hedge positions, if you want to disable this feature deactivate either Buy, or Sell from the setting)
Please please do not take unnecessary risks. (Trading is risky, and there are no guarantees for winning)
We wish you successful trading. (Trading is risky, and there are no guarantees for winning)
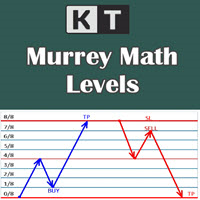
It shows the Murrey Math levels on chart and also provides an alert when price touch a particular level. T. Henning Murrey, in 1995, presented a trading system called Murrey Math Trading System, which is based on the observations made by W.D Gann.
Applications
For Murrey Math lovers, this is a must-have indicator in their arsenal. There is no need to be present on the screen all the time. Whenever the price touches a level, it will send an alert. Spot upcoming reversals in advance by speculatin

Only 1 copies left at a price of $99. Next price $199!
actual .set files (click me)
interactive panel manual (click me)
Version for MT5: Smart Start Smart Start is a smart trading system, the indicators of which allow it to be used both for trading with small deposits (fast acceleration) and for conservative trading. is a modernized trading indicator system that uses the MACD indicator to analyze the market. To analyze entry points, smart start takes into account the historical indica
KT Candle Timer shows the remaining time in the closing of the current bar. You can use the bar closing time for multiple purposes, including time and trade management during the trading hours.
Features
It also shows the Symbol spreads along with the remaining time. It offers two convenient timer display positions, i.e., chart corner or next to the current bar. From colors to text size, it offers full customization according to user preferences. It is optimized to work without using extensive c

KT Bullish Bearish shows the bullish/bearish regime of the market in the form of a colored histogram representing both of the market states alternately. Bull Market (Blue Histogram): A bull market indicates an uptrend when an instrument price rises over a continued period like days, months, or years. Bear Market (Red Histogram): A bear market indicates a downtrend when an instrument price rises over a continued period like days, months, or years.
Applications
It prevents trading against the big

Some disadvantages of Rollover Scalper: Currently the markets aren't that favorable for night scalping because of the fundamentals, so the next few months the EA might show 0% or even negative return. However, it happened in the past too and it was still profitable over all ~20 years. It's a scalper, so you'll need a broker with low spread and good execution time, preferably an ECN broker. ICMarkets would be a good choice. It's susceptible to slippage (which can't be backtested or limited on ECN

Make your Passive Income DREAM a Reality !! Let our intelligent EA(Expert Advisor) take care of your portfolio 24/7. You no longer need to watch your portfolio all day waiting to the trading moment the EA will do it for you. Let CODENoah Earth be your ANSWER to every life-style you desire. Designed for Technical and Algorithmic Trading The HIGH intelligent EA: CODENoah Earth , that will only trade when there a chance of profit and cut loss immediately when you balance is lost to a certain point

我很高兴欢迎您来到我的产品页面 面板初次加载会服从后台设置,面板控制交易管理凌驾于后台之上。请注意交易方向的管理,正确的交易方向是交易市场生存的根本,这点很重要。 Ea交易有2种策略Sto,MA和用户在面板打开的执行订单,同时也支持移动端下单(下单基础请服从后台自行设置手数)、移动端预下单功能。 Sto策略单量密度大,是激进策略;MA策略较缓和。
此EA可全自动化交易,设置偏向于辅助手控交易。 ============Basic settings============= Magic EA 交易品种(trading variety) 点差(Spreads) 点差系数(Spread coefficient) =============conditions for execution==== 交易模式(Choosing strategy) 打开新系列订单(Open new series) //是否允许,否的话会停止打开新阶段订单。关闭状态适合运行预交易功能,也就是控制运行,一阶段一结。。 开多(Trade Sell) //处于关闭状态会停止一切开Sell方向单子。 开
FREE

1. Стрелочный индикатор. 2. Для анализа использует несколько скользящих средних на разных таймфреймах и соотносит их с важными уровнями цены. 3. Не перерисовывает стрелку, т.к. использует для расчета фиксированное количество исторических данных. 4. Пример работы индикатора приведен на скриншотах. 5. Показывает отличные результаты на всех валютных парах на таймфрейме от H 1 и выше. 6. Не требует оптимизации.

TopBottom Checker は、価格のボトムとトップを決定するインジケーターです。インジケーターは、任意の通貨ペアで使用できます。インジケーターは、M1からD1までの任意の時間枠で機能します。 このインジケーターは、あらゆる戦略にとって非常に重要な市場の側面で機能するため、スタンドアロンのトレーディングシステムとして、または使用するトレーディングシステムの一部として使用できます。インジケーターシグナルは、トレンドに立ち入るため、反転としてのトレンドに逆らうため、およびオープンポジションの閉鎖の可能性を示すため、つまり市場から出るための両方に使用できます。インジケーターは非常に使いやすいです。チャートにインジケーターを追加し、必要に応じてそのシグナルに従う必要があります。このツールは、外国為替取引とバイナリーオプション取引に使用できます。 デフォルトでは、分析は価格の反転を予測するために実行され、そのような条件の形成の最も早い兆候を見つけようとするため、インジケーターはそのシグナルをわずかに再描画する場合があります。再描画はマイナーですが、可能です。しかし、私はそれをゼロに減らす
MetaTraderプラットフォームのためのアプリのストアであるMetaTraderアプリストアで自動売買ロボットを購入する方法をご覧ください。
MQL5.community支払いシステムでは、PayPalや銀行カードおよび人気の支払いシステムを通してトランザクションをすることができます。ご満足いただけるように購入前に自動売買ロボットをテストすることを強くお勧めします。

取引の機会を逃しています。
- 無料取引アプリ
- 8千を超えるシグナルをコピー
- 金融ニュースで金融マーケットを探索