Sc MTF Volume MT4
- インディケータ
- バージョン: 5.15
- アップデート済み: 24 2月 2026

マルチタイムフレーム対応、カスタマイズ可能なビジュアルシグナル、設定可能なアラートシステムを備えたボリューム(Volume)インジケーター。
フリーランスプログラミングサービス、アップデート、その他のTrueTL製品は私のMQL5プロフィールでご覧いただけます。
フィードバックとレビューを大変お待ちしております!
ボリュームとは?
ボリュームはテクニカル分析において最も基本的な指標の一つです。特定のバーまたは期間中に取引されたコントラクト、株式、またはロットの総数を表します。MetaTraderではデフォルトでティックボリュームが使用されます — 各バー内の価格ティックの数をカウントするもので、ほとんどの市場において実際の取引量と密接に相関しています。
ボリュームは価格方向を示しません — 市場の活動と参加度を測定します。ボリュームの増加は価格動向の強さを確認し、低ボリュームは弱いまたは持続不可能なトレンドを示す可能性があります。トレーダーはボリュームを使用してブレイクアウトを検証し(高ボリュームのブレイクアウトはより信頼性が高い)、トレンドの枯渇を識別し(価格とボリュームの乖離)、蓄積または分配フェーズを検出します。ボリュームのスパイクは重要な価格動向に先行したり、それとともに発生することが多いです。
機能:
- 矢印と垂直線によるビジュアルシグナルマーカー
- 設定可能なトリガーを持つ3つの独立したシグナルバッファ
- シグナル検出オプション:方向転換、ピーク/バレー
- 各シグナルに対して設定可能なアラート機能(メール、プッシュ、サウンド、ポップアップ)
- 補間メソッドを使用したマルチタイムフレーム(MTF)機能
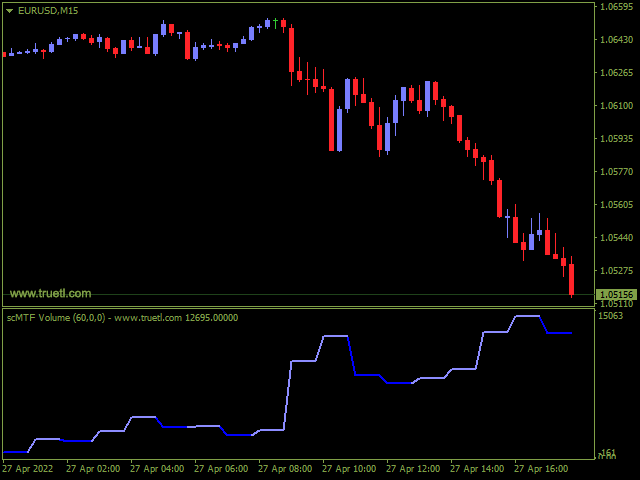
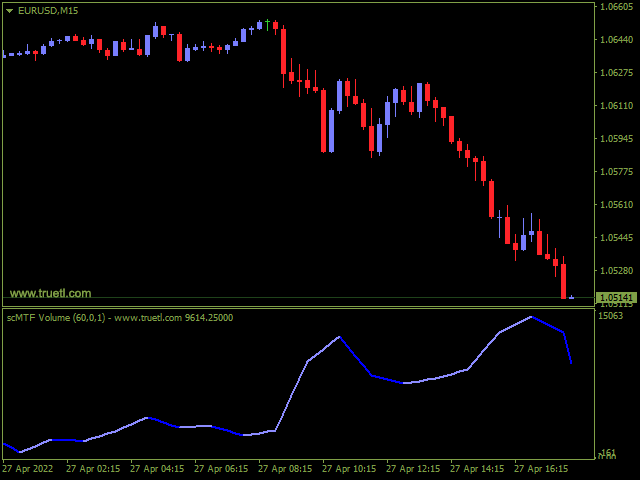
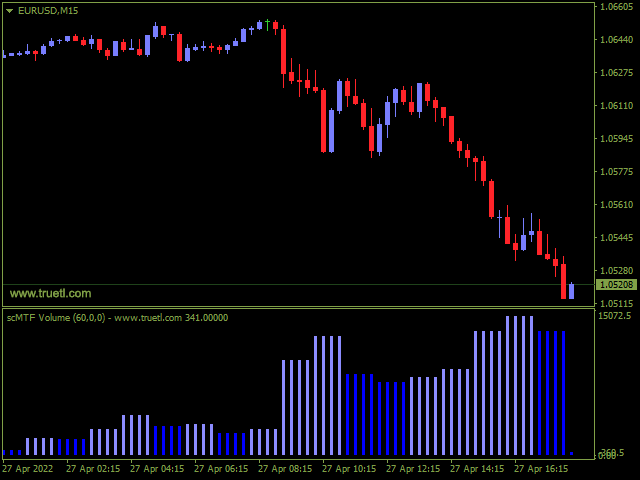
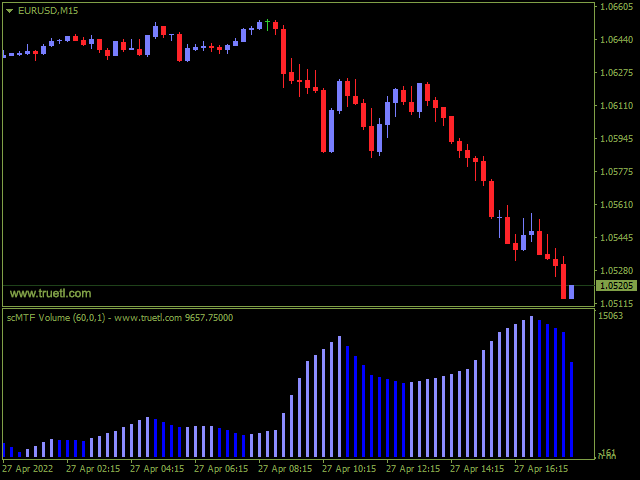
- ヒストグラムまたはライン描画モード
- 複数のカラーモード(シンプル、方向ベース)
- Expert Advisor(EA)統合のためのカスタムインジケーター呼び出し(iCustom)バッファアクセス
入力パラメーター:
- 基本設定:
- ボリュームバーシフト:指定したバー数だけ描画をオフセットします。
- ボリュームタイムフレーム:MTF表示のタイムフレームを選択します。
- MTF補間モード:平滑化メソッドを選択します(オフ、線形、スムーズ、加重、単純移動平均)。
- シグナル設定:
- シグナル1/2/3トリガー:検出タイプを設定します(方向転換、ピーク/バレー)。
- ビジュアルマーカー:カスタマイズ可能なサイズ、スタイル、位置で矢印と垂直線を有効にします。
- 矢印のカスタマイズ:上昇/下降シグナルのWingdingsコードと色を設定します。
- アラート設定:
- アラートタイミング:アラートのトリガー時期を選択します(オフ、終値後、終値前、両方)。
- アラート間隔制限:繰り返しアラート間の最小分数を設定します。
- 時間範囲フィルター:アラートを特定の時間帯に制限します。
- 通知方法:メール、プッシュ、ポップアップ、サウンド通知を有効にします。
- カラーとスタイル設定:
- カラーモード:複数のモードから選択します(シンプル、方向ベース)。
- ヒストグラムモード:ラインとヒストグラム表示を切り替えます。
- ラインの外観:色(ラインあたり4色)、スタイル、幅をカスタマイズします。