Ratio widget
- インディケータ
- バージョン: 1.0

The indicator helps to determine the potential for price movement within the day and on a trend. For calculations, the average price movement on the instrument is used. If you have a problem setting TP, the indicator allows you not to overestimate your expectations. For volatile instruments, the SL position can also be taken into account. If the entry was in the right place, the risk / reward ratio will prompt a profitable level for profit taking.
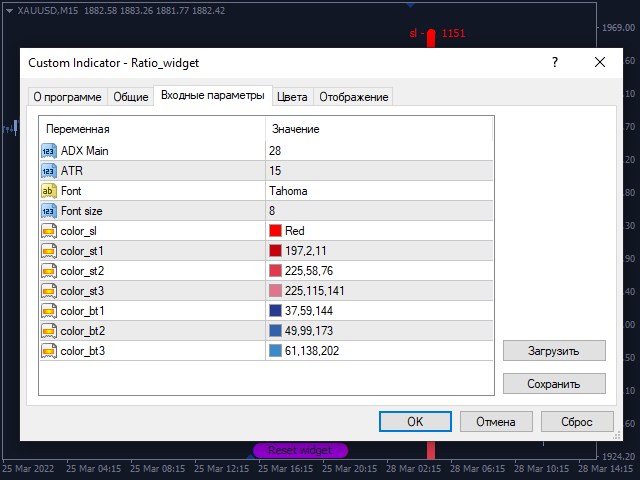
There is a reset button at the bottom of the screen. If the indicator is lost on the chart when changing instruments, you can easily call it again.
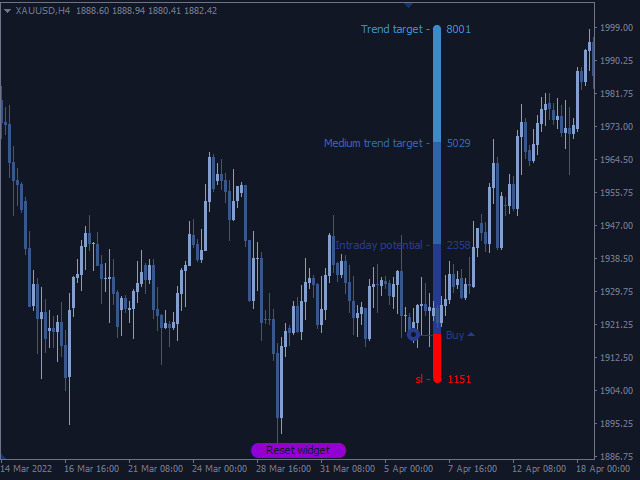
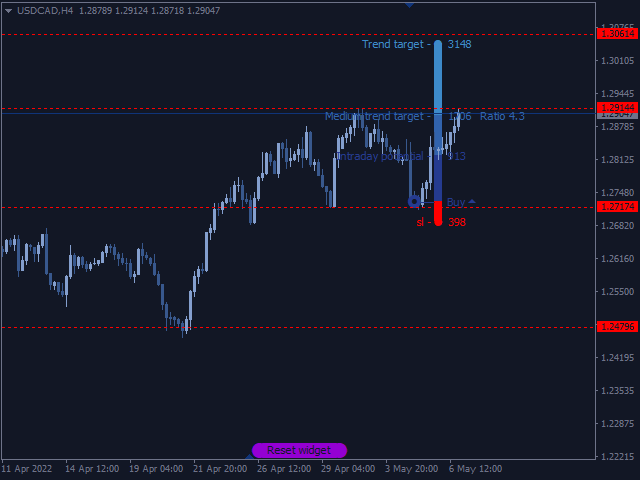
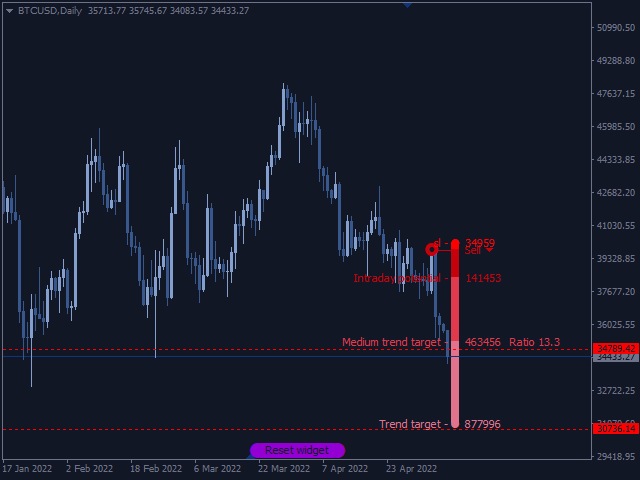
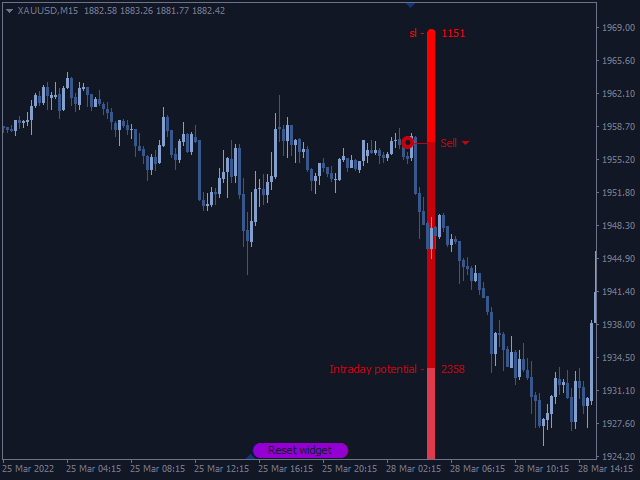

A masterpiece, it is of great use to measure the potential gains (TP) and minimize the risks (SL) on a trade. Thanks to the developer