Mechanical SR
- インディケータ
-
Part-time Day Trader
 I build practical MT4 and MT5 tools designed to reduce screen time, remove doubt, and make consistent trade execution easier.
Because consistency is what allows a strategy’s edge to play out—and without consistent execution, no strategy works. Period. - バージョン: 1.1
- アクティベーション: 8
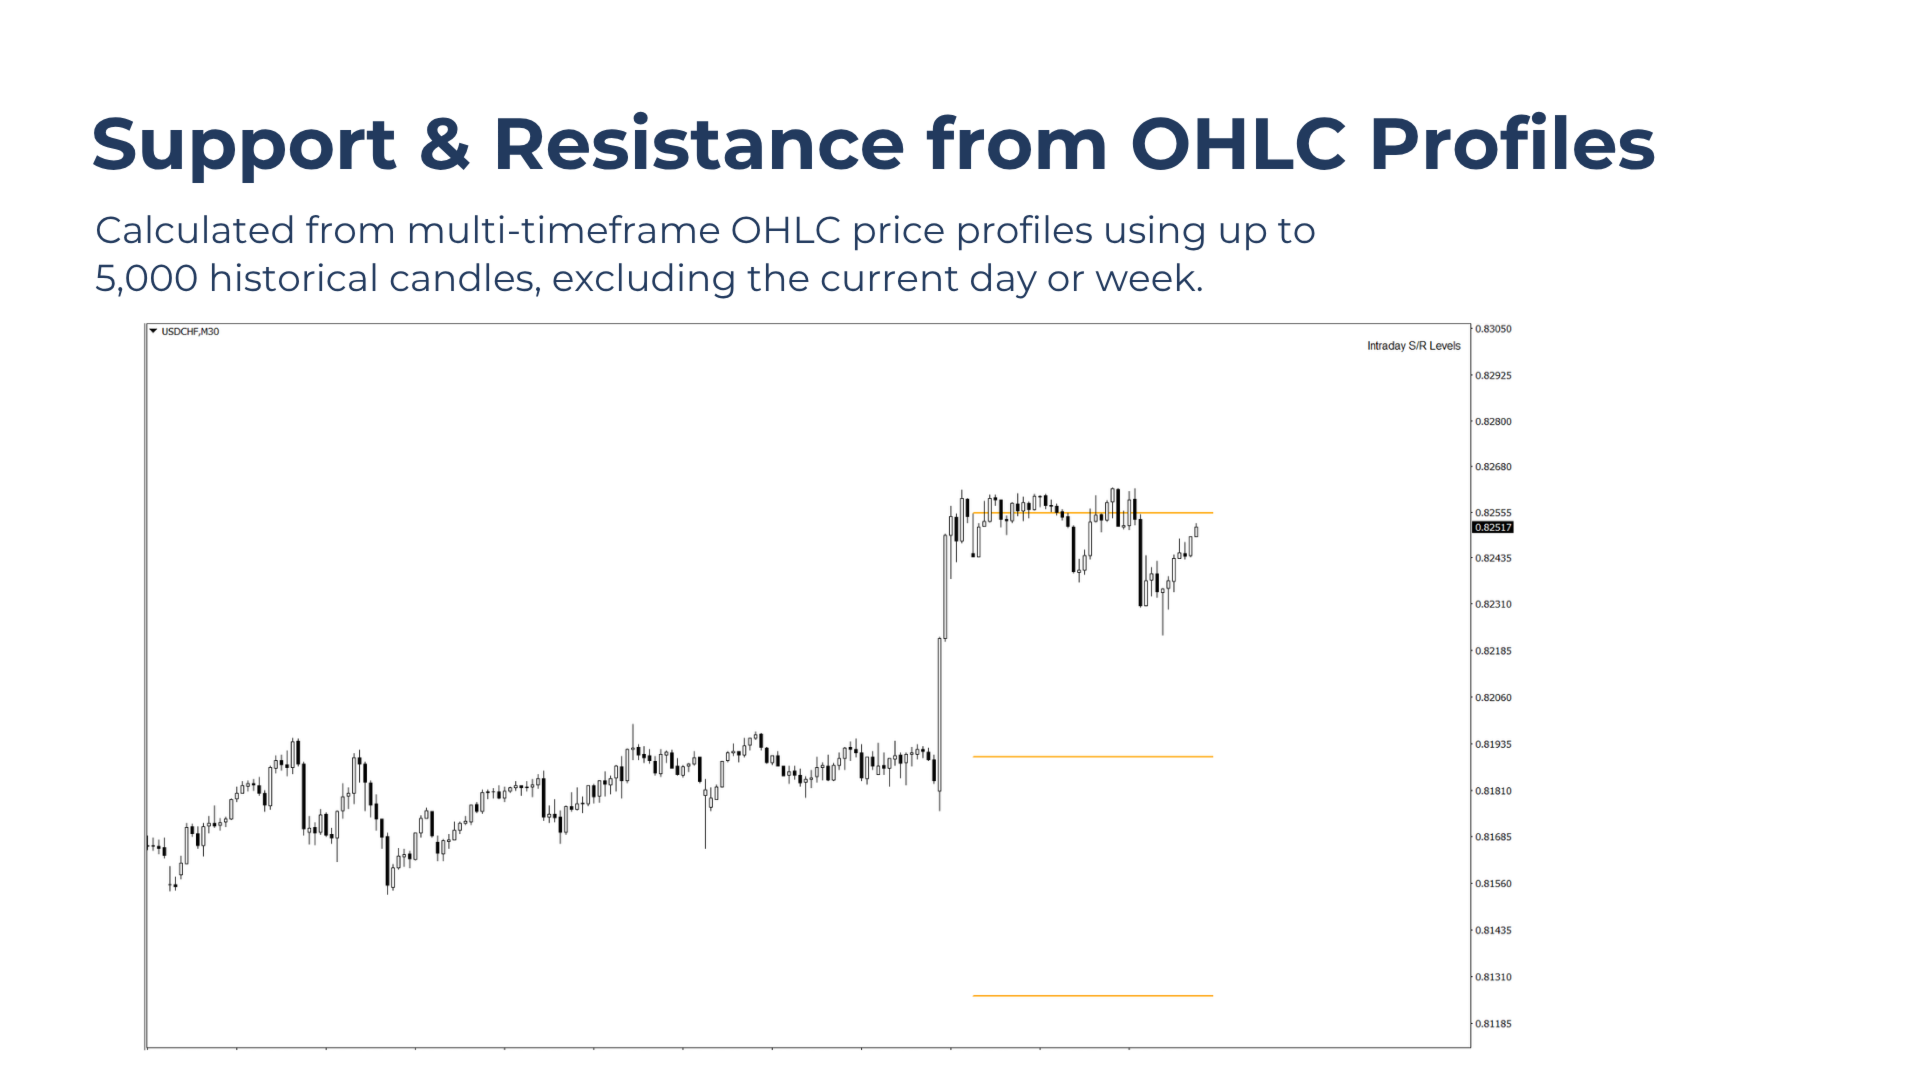
Mechanical Support Resistance automatically identifies potential support and resistance levels using vertical price profiles built from historical Open, High, Low, and Close (OHLC) prices.
Most mechanical support and resistance indicators identify levels based on obvious price swings on the chart. Mechanical Support Resistance takes a different approach by analyzing the vertical distribution of OHLC prices to reveal support and resistance levels that are difficult to identify manually through visual chart analysis alone.
Why OHLC for Support and Resistance?
Highs and lows represent price extremes where price has encountered rejection. When many of these price points cluster around the same level, it suggests that price has repeatedly reacted in that area in both directions. Levels that have attracted price reactions from both above and below making them potentially stronger support and resistance for future price movements.
Open and close prices provide additional reference points, helping identify areas where historical trading activity has been concentrated.
How Does It Work?
The indicator:
-
Builds a vertical OHLC price profile using up to 5,000 historical candles from various timeframes, excluding the current day or week from the calculation.
-
Identifies key price concentrations within the profile and selects the most significant levels.
-
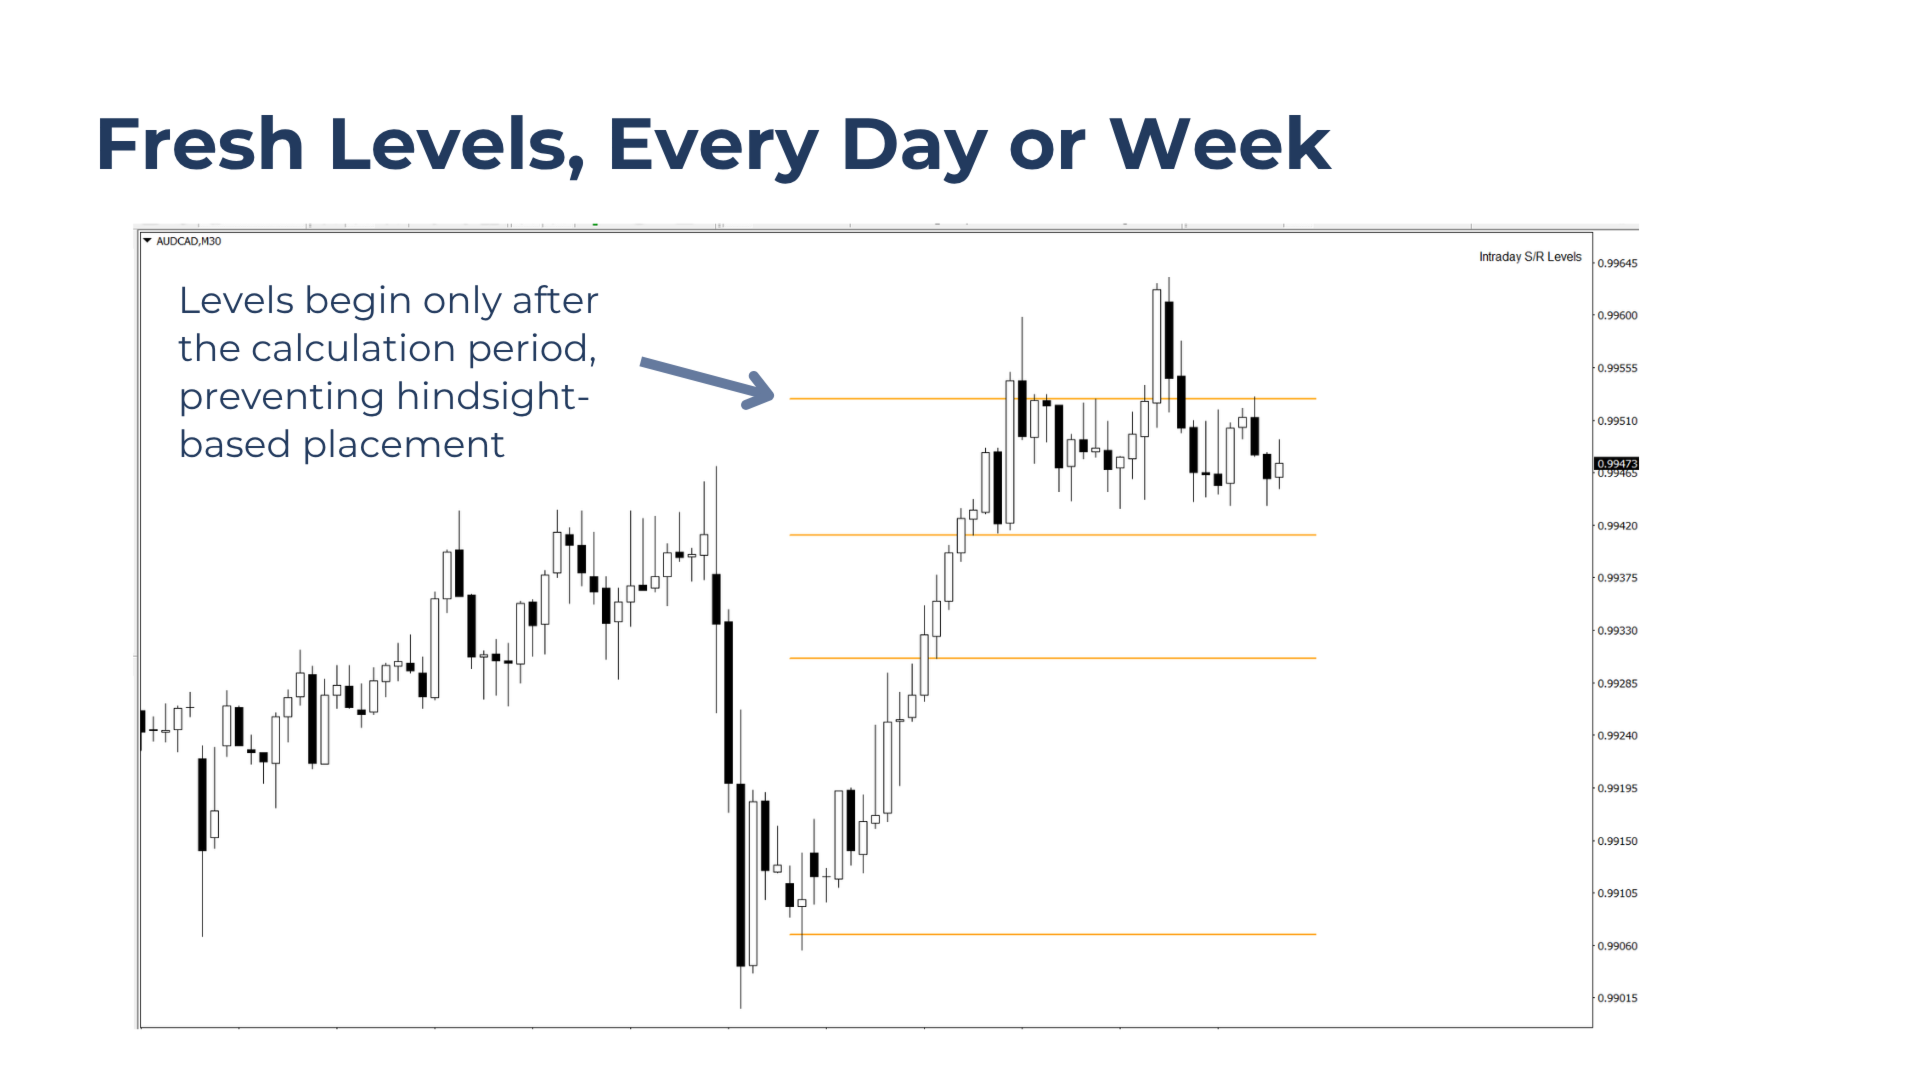
Plots horizontal support and resistance levels directly on the chart. Levels begin at the first day or week following the calculation period, keeping the chart clean and avoiding hindsight-based placement.
-
Refreshes the levels at the start of each new trading day or week, similar to a traditional pivot indicator.
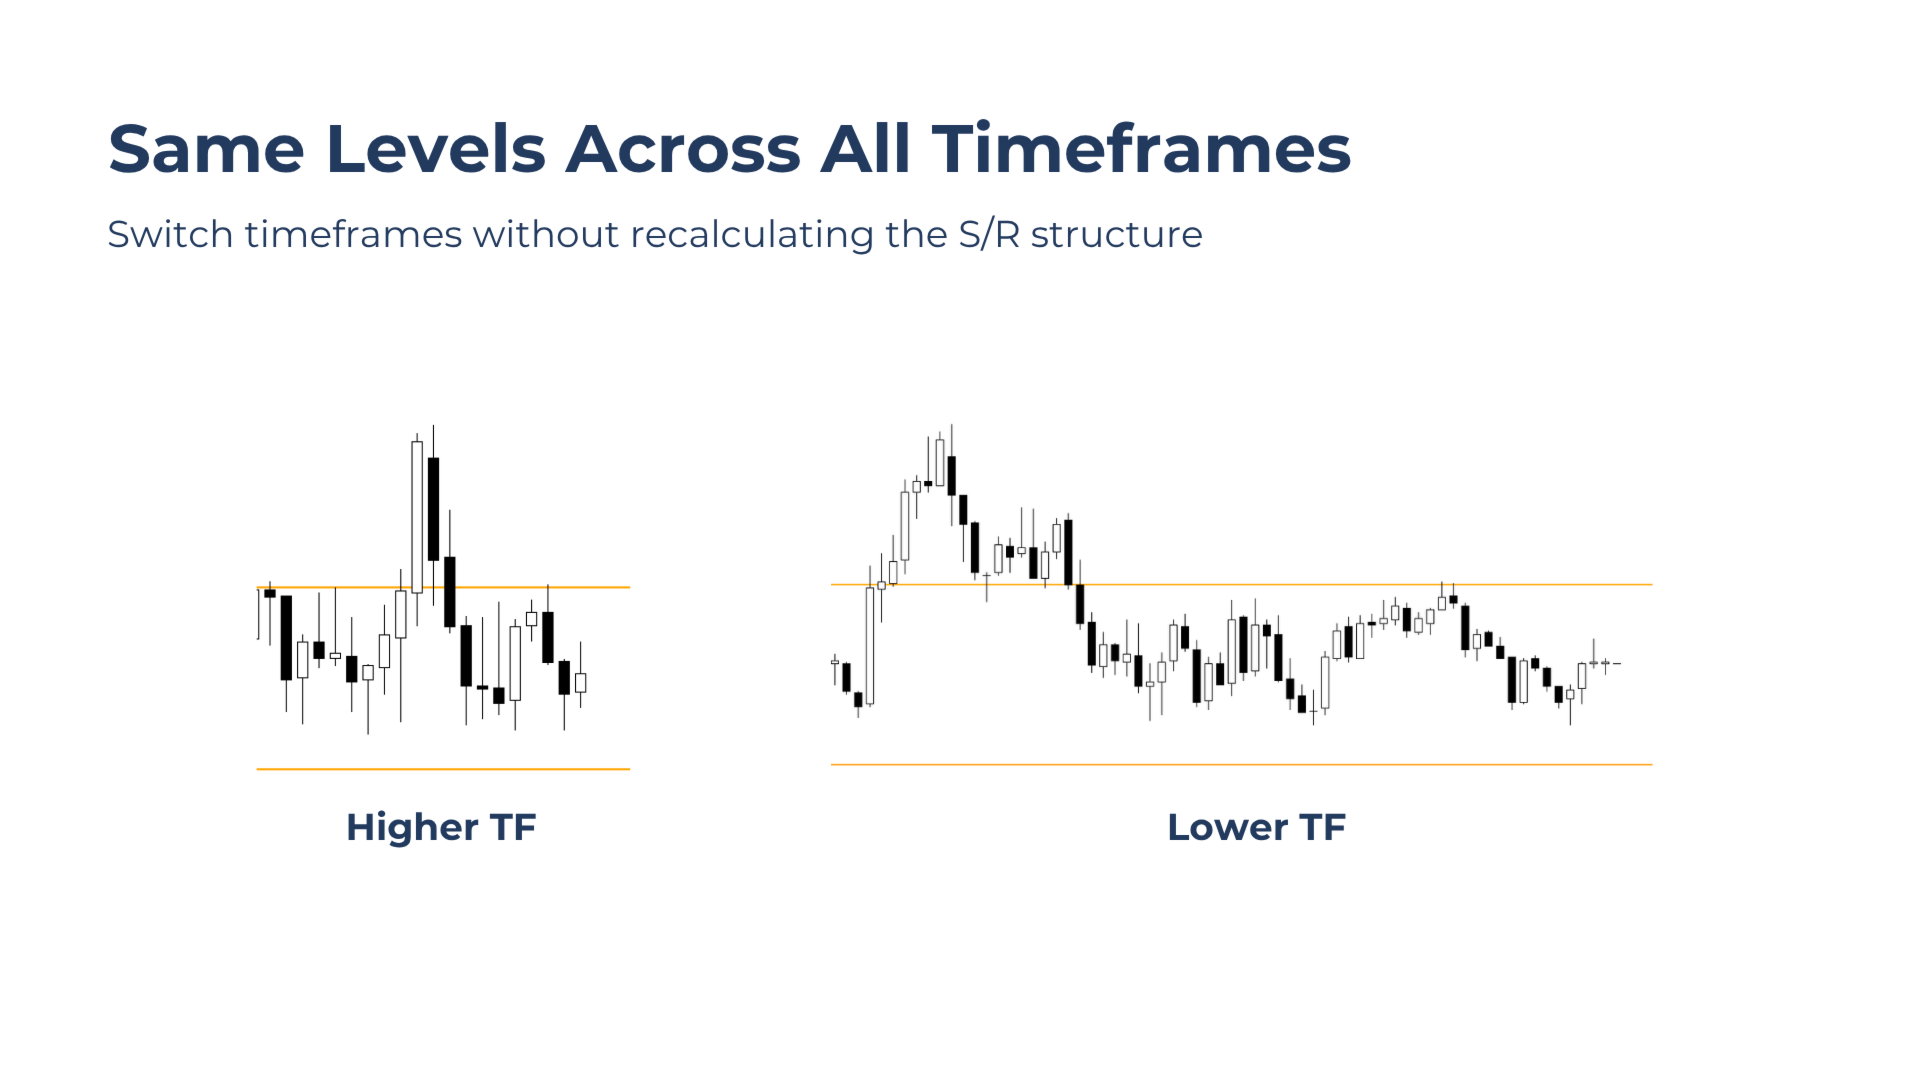
Once calculated, the levels remain fixed throughout their respective trading period and are consistent across chart timeframes.
How to Use
Mechanical Support Resistance accommodates different trading styles, from scalping and intraday trading to swing trading.
Choose between daily and weekly profiles and adjust the level density to match your trading style.
The levels can help traders identify potential entry and exit points, plan profit targets, and recognize areas where price may react, reverse, or consolidate.
Built for Traders Who Want To
- Work with automatically calculated support and resistance levels.
- Use stable levels that do not shift when changing chart timeframes.
- Have non-repainting S/R levels.
- Match level calculation to scalping, day trading, or swing trading.
- Keep charts clean with a selected set of mechanically derived key levels.
Trading Presets
Scalping – Higher level density with daily updates.
Intraday – Balanced level selection with daily updates.
Intraweek Swing – More selective levels with weekly updates.
Higher-Timeframe Swing – Broader historical analysis with monthly updates.
Each preset automatically adjusts the profile history, resolution, level sensitivity, and update cycle for its intended trading style.
Stable Across Timeframes
Mechanical SR uses a fixed multi-timeframe calculation process. Switching between M1, M15, H1, H4, or other chart timeframes does not produce a different set of levels.
This makes it possible to identify the larger structure on one timeframe and use the same levels for entries or trade management on another.
Customizable Appearance
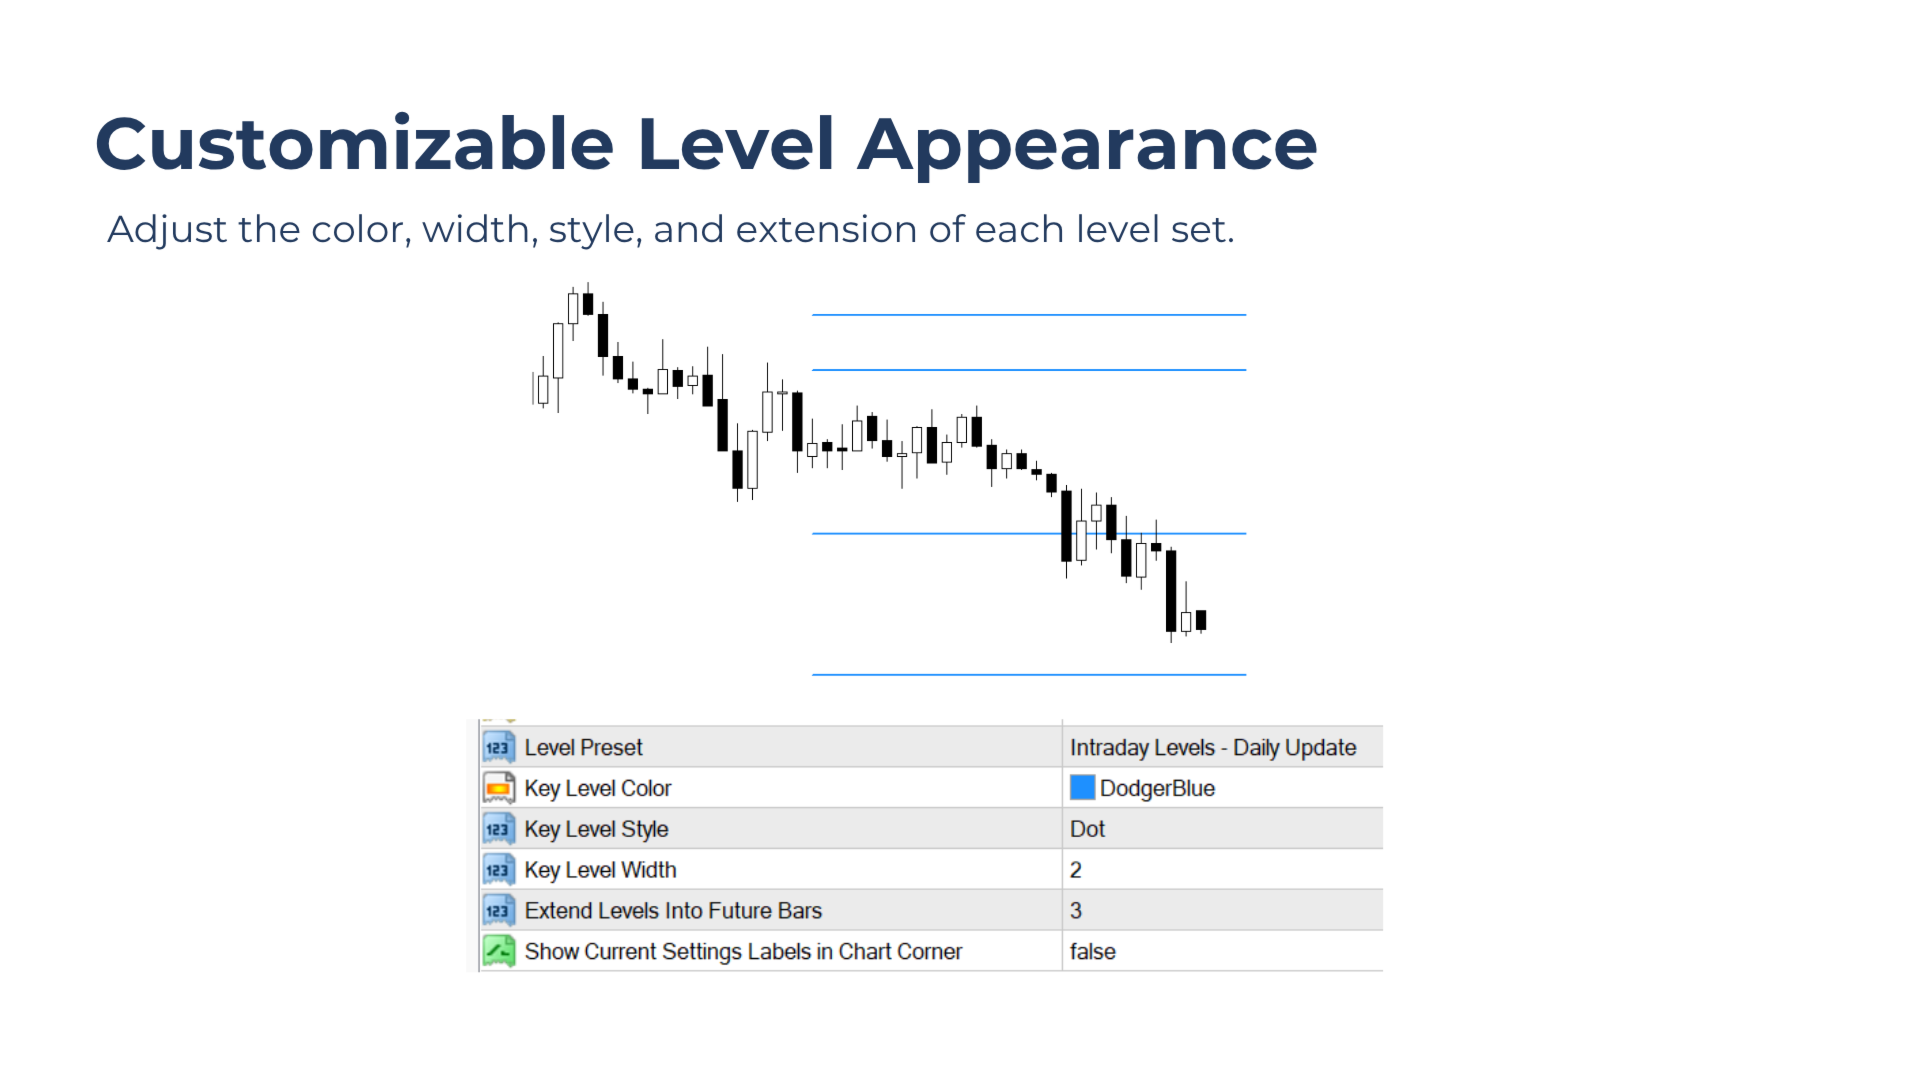
Adjust the level color, style, width, and future-bar extension directly from the indicator settings.
The current trading preset and update cycle can also be displayed in the chart corner for quick reference.
Thanks for the Feedback
Suggestions, comments, and bug reports are always welcome. Feedback helps improve existing tools and guide future development.