 MetaTrader 5
 Experts
 Indicators
 Libraries
 Utilities
 Widgets
 Rules
Watch the Market tutorial videos on YouTube
How to buy а trading robot or an indicator
Run your EA on
virtual hosting
virtual hosting
Test аn indicator/trading robot before buying
Want to earn in the Market?
How to present a product for a sell-through
Technical Indicators for MetaTrader 4 - 176
 Signals from technical indicators listed below play a crucial role in opening and closing deals in MetaTrader 4 platform.
The essence of indicators is a mathematical transformation of a financial symbol price aimed at forecasting price changes.

QCL RSI Flow Candles — MetaTrader 4 QCL RSI Flow Candles transforms RSI momentum into smoothed Heikin Ashi-style candles in a separate indicator window. Candle bodies, wicks, a directional trend line and reference zones provide a visual framework for assessing momentum, pullbacks and changing conditions. Key Features RSI-based candles: View momentum through candle structure instead of a conventional RSI line. Directional colors: Green candles indicate that the oscillator close is at or above its

this indicator Draws Two Trend Lines automatically. my intend of use is :- 1 . For Buy Entry Make sure The Blue trend line is in Upward and Trending and also the Redline is in Horizontal.
2 . For Sell Entry Make sure the Red Line is in Downward and its Trending and also the Blueline is in Horizontal.
3. use caution, Technical confirmations is needed always. any info please submit a message.

This is MT4 indicator that automatically finds Edge of Trend where it makes Draw Down.
Examples
1 . Buy if The Two trend lines align up
2. Sell if the two trend lines align down
you can also make likes these
1. Buy if drawdown line is (yellow line) that upwards and Trend (Blue line) is Down 2. Sell if drawdown line is (yellow line) that downwards and the Trend (Blue line) is up
for any comments and contats submit message.

SMC Super position - Smart Money Structure & Liquidity Intelligence Professional multi-module market structure, liquidity and trade-planning indicator for MetaTrader 5, designed to combine structural analysis, liquidity behavior, trend context and confirmed signal logic in one compact workspace. The system includes Smart Money structure tools, an independent Master Signal engine, Confluence setups, Scalping analysis, Queen Trend context, multi-timeframe routing and an integrated Signal History d

Volatility Dots puts a trailing line of dots on your chart. In an uptrend the dots sit under the price, in a downtrend above it, and they flip when price closes through the opposite band. It works on any symbol and any timeframe. It reads only the prices your terminal already has, does not use any server, does not send anything out, and does not open or change orders. What It Shows One dot per bar. White dots under the candles mark a rising trend, red dots above the candles mark a falling trend.

CrowdTrap MultiAsset Liquidity MT4 CrowdTrap MultiAsset Liquidity is a technical analysis indicator for MetaTrader 4 designed to identify market structure, liquidity levels, liquidity sweeps, price retests, and potential trading scenarios. The indicator combines multi-timeframe market structure analysis with price action and liquidity-based analysis. Main Features Market Structure Analysis Uses H1, H4, and D1 market data to assess directional bias and identify Break of Structure (BOS) and Change

Nexus Trend Pulse – Trend & Signal Indicator for MT4/5 Nexus Trend Pulse is a visual trend analysis and trading signal indicator developed for MetaTrader 4/5. It combines dynamic trend zones, directional signals, stop reference lines, and entry level visualization in one chart interface. Designed for traders who prefer a clear and organized trading environment, Nexus Trend Pulse helps identify market direction, observe price reactions, and recognize potential trading opportunities without overcr

Daily Range Ladder draws six horizontal levels across the current trading day. The distances come from how far the symbol usually travels in a day, so the levels adapt to every symbol without any setting. It works on any symbol and any chart timeframe. It reads only the daily bars your terminal already has, does not use any server, does not send anything out, and does not open or change orders. What It Shows Three resistance levels above the day's low and three support levels below the day's hig

Crypto_Forex Indicator Moving Average Acceleration for MT4, No Repaint. MA Acceleration - is scalping indicator, designed as auxiliary tool for "MA Speed" indicator. The calculation of this indicator is based on equations from physics. It will show you the acceleration of moving average line. There are plenty of opportunities to upgrade even standard strategies with MA Acceleration. It is possible to use for SMA, EMA and LWMA. MA Acceleration is a 2nd derivative of corresponding Moving Avera
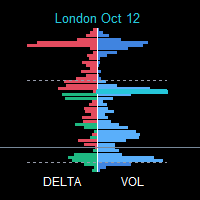
SessionFlowMap — Multi-Session Volume & Delta Profile with POC Levels SessionFlowMap builds a volume profile and a delta profile (buy/sell imbalance) for the sessions of the forex day: Asia, London, New York, plus an optional Sydney and a custom session. For every session it finds the POC (Point of Control — the price with the highest traded volume) and the Value Area (VAH and VAL — the range that holds most of the volume) and projects these levels forward as horizontal lines. You can see at a g

Know the direction. Know the plan. Know when to stand aside. CS Trend Pro turns a busy chart into a clear decision. It shows which way the market is moving and marks the moment that changes. With every signal it gives you a complete plan: where to enter, where the idea is wrong, and where to take profit. It is built for swing traders and scalpers who move with the swing: take a part of the profit at each target, and stay in for as long as the move lasts. Built on volatility and on support and re

Quantum Enigma Quantum Enigma is a technical analysis indicator based on market structure and price action. It is designed to identify potential Bullish and Bearish setups around established price ranges. The indicator analyses market conditions and can apply several configurable confirmation and filtering conditions before displaying a signal. This allows traders to adjust the balance between signal frequency and selectivity according to their preferred trading approach. How It Works Quantum En

AlphaTrend Pullback Pro MT4 Trend-following pullback signals, economic news filter, and professional dashboard — all in one indicator. AlphaTrend Pullback Pro transforms trend and correction analysis into clear, actionable visual signals. It identifies the macro market direction on a higher timeframe, waits for a pullback to the moving average, confirms rejection with a trend-aligned close, and triggers the entry point. No repainting on closed bars, no noise, no complexity. Why AlphaTrend Pullba

Correlation Radar PRO — Multi-Asset Correlation Dashboard for MetaTrader 4 Short Description: Eliminate market noise and spot price divergences in seconds. Correlation Radar PRO calculates historical, monthly, weekly, and real-time correlations across multiple assets and lets you overlay candles directly on your chart without switching your main symbol. Full Description: Manually switching charts to understand inter-market relationships wastes precious time and leads to missed setups. Correlatio

Mechanical Support Resistance automatically identifies potential support and resistance levels using vertical price profiles built from historical Open, High, Low, and Close (OHLC) prices. Most mechanical support and resistance indicators identify levels based on obvious price swings on the chart. Mechanical Support Resistance takes a different approach by analyzing the vertical distribution of OHLC prices to reveal support and resistance levels that are difficult to identify manually through vi

Enigma Cipher Enigma Cipher is a technical analysis indicator designed to help traders identify potential bullish and bearish market reversals through price pressure, momentum and multiple confirmation conditions. The indicator evaluates the relationship between recent price behaviour and the current signal candle. Additional filters can be enabled to refine the analysis and reduce signals that do not meet the selected conditions. How It Works Enigma Cipher first evaluates market pressure and pr

Renko Chart Pro MT4 is a practical Overlay/Panel Renko indicator designed to give traders a cleaner way to read price action without leaving the standard chart environment. Unlike many Renko tools that require separate offline charts or complicated setups, this indicator displays a fully configurable Renko panel directly inside your active MT4 chart .
You no longer need to have endless offline charts which makes shifting through instruments cleaner and more efficient. This is not an indicator I

MQLTeam Currency Power puts two currencies on one chart and shows which one leads. The histogram is the basket gap. The board shows the pair that is pulling that gap. The ready example is EUR against USD. Change the two names and the pair lists, and the same reading works for any two currencies. Also available: MQLTeam Currency Power for MetaTrader 5 The value is in pips. The default measure is the distance between a fast moving average and a slow one. Two shorter candle reads are there when yo

ValueOrbit shows where the "fair" price of the current period sits and how far the market has moved away from it. It is a context tool: it draws a central Value Core line with three pairs of orbit shells (±1σ, ±2σ, ±3σ) around it, and the dashboard reports how stretched price is. It does not generate entry signals. MT5-version: https://www.mql5.com/en/market/product/201292
How it works The Value Core is a reference level that builds up from the start of each period (session, week or month) and

AI ZONE RADAR — Support and resistance in context Choose the version for your platform This is the MT4 edition. A MT5 edition is also available. View the MT5 version MT4 and MT5 are separate Market products; this purchase covers the selected platform only. A clearer starting point for chart analysis You have a signal, but is price already close to resistance? You see a pullback, but where is nearby support? Drawing more lines does not always make these decisions easier. AI ZONE RADAR brings near

Crypto_Forex Indicator HTF DeMarker for MT4. - This indicator is a useful tool used by technical traders to find entry and exit points. H TF means - H igher Time Frame. - DeMarker oscillator line indicates the current price position relative to previous highs and lows.
- DeMarker provides the most efficient regular divergence signals among other oscillators.
- OverBought zone is when the D eMarker is above 0.7 and OverSold one - when it is below 0.3.
- Indicator has built-in M

TraderDesk is an institutional-grade financial spreadsheet and account metrics dashboard meticulously engineered for professional portfolio managers, proprietary firm traders, and systemic asset growth monitors. By integrating a state-of-the-art Time-Weighted Split-Period Capital Engine , TraderDesk transforms your chaotic chart canvas into a beautifully structured, clean financial workspace. It automatically filters out standard candlestick noise, grid line clutter, and price scale bars, allow

Crypto_Forex Indicator "Hanging Man pattern" for MT4, No repaint, No delay. - Indicator "Hanging Man pattern" is very powerful indicator for Price Action trading. - Indicator detects bearish Hanging Man patterns on chart: Red arrow signal on chart (see pictures). - With PC, Mobile & Email alerts. - Indicator "Hanging Man pattern" is excellent to combine with Support/Resistance Levels. Click here to see high quality Trading Robots and Indicators! This is original product which is offered only on

Forex Indicator "INFO Spread Swap Display" for MT4, Trading Auxiliary tool. - INFO Spread Swap Display indicator shows current S pread and Swaps of forex pair where it is attached. - It also indicates account Balance, Equity and Margins. - It is possible to locate indicator values in any corner of the chart. - It is possible to set up color and font size as well. Click here to see high quality Trading Robots and Indicators! It is original product which is offered

*Strong Hosoda Pro - Edizione COMPLETA - Premium*
Strong Hosoda Pro è un indicatore professionale di trend e livelli basato sul metodo originale Ichimoku Hosoda, sviluppato per trader esperti.
Questa è la versione Premium COMPLETA, valida per tutti i tempi, da M1 a D1. Nessuna restrizione.
*Perché Premium?* A differenza degli indicatori standard, combinazione direzione del trend, tempistica di ingresso e livello di take profit in un unico sistema chiaro, basato sulla logica completa dell'Ich

ZZ Impulse PRO is an authoring toolkit for reading market structure: two independent fractal ZigZags, Classic and Impulse/Correction modes, non-standard period candles, and full panel control — on a single chart. Concept The market speaks on both lower and higher scales at once. A typical ZigZag often keeps only one of those voices. ZZ Impulse PRO delivers controlled structure : two markups with separate settings, two ways to read waves, a flexible multiplier, and HTF/synthetic candles overlaid

GT Direction Dashboard — Comprehensive User Manual & Technical Guide 1. Executive Summary & Core Purpose The GT Direction Dashboard is a multi-timeframe, multi-metric currency alignment dashboard built for MetaTrader 4. It is designed to solve one of the greatest challenges manual currency traders face: Analysis Paralysis and Information Overload . Rather than manually switching across 6 or 8 timeframe charts ( MN1 down to M5 ) and adding 4 or 5 separate indicators (RSI, ADX, PBR, Volatility, RO

NOTE: Only 10 copies left at current price! Final price: 990$
Trade the Breakout. Catch the Move.
Take your technical analysis to the next level with TrendLine Support Resistance with Alerts , a MetaTrader 4 indicator designed for traders who focus on trendline breakouts. Identify potential trading opportunities with trendlines drawn directly on your chart and clear BUY and SELL arrows that help you spot possible breakout signals. KEY FEATURES Trendline Breakout Signals — Identify potenti

Fulcrum Value Profile is a MetaTrader 4 indicator that builds a tick-volume profile for every session, marks its Point of Control (POC) and value area, draws the developing POC/VAH/VAL as lines, tracks naked POCs and flags two value-area setups on closed bars: re-entry into the prior value area (80% rule) and acceptance outside it (breakout). It never opens, modifies or closes trades. Quick Start Attach the indicator to an M5, M15 or M30 chart. Keep Profile Period = Daily session, or choose Cust

Every ICT idea in one indicator - market structure, order blocks, fair value gaps, premium / discount and OTE, liquidity sweeps, killzones and SMT - added up into one confluence score, with alerts and a multi-symbol scanner. Try it free first: press Free Demo and run it in the Strategy Tester (visual mode) - the panel, zones, signals and scanner all work there. ICT Pro Honest Stats draws all of it on your chart, checks every closed candle against nine ICT factors, shows the bullish and bearish s

Apex Patterns PRO Buy Indicator - Get Expert Advisor Based on it for FREE. Self-Optimizing Chart Pattern & Breakout Intelligence Traditional pattern scanners rely on fixed inputs, often underperforming when market volatility and structures shift. Apex Patterns PRO is designed to adapt to changing market conditions by combining structural chart pattern recognition, momentum filtering, and statistical self-optimization into one analytical framework. Adaptive Scanning Engine Self-Optimizing Patter

SMC Market Structure Toolkit is a Smart Money (ICT / SMC) toolkit for MetaTrader 4 in ONE indicator. It reads the market the way a discretionary Smart Money trader does: structure first, then liquidity, then the areas where price may react - and it draws all of it directly on your chart, with short labels, optional arrows and optional alerts. Key features Structure is built TWO ways at once - Internal and Swing BOS / CHoCH, each with its own timeframe, swing strength and colors. Every module has

Ribbon Pilot — Trend Ribbon with Trade Zones, Signal History and Watchlist What it is for Ribbon Pilot is a MetaTrader 4 chart indicator that shows the trend direction at a glance, marks entry signals with arrows and draws a ready trade plan at once: entry, stop and up to four profit targets. It also keeps statistics on recent signals and lets you scan other instruments without leaving the chart. MT5-version: https://www.mql5.com/en/market/product/201869 How it works A ribbon of eight smooth li

TCM ORB Indicator for MetaTrader 4 draws the opening range of the Asia, London and New York sessions and marks breakouts from each range on closed candles. What it shows - A box for each session's opening range (the first 30 minutes by default, adjustable) - Session times adjusted to your broker's clock and daylight saving automatically, or set manually - A breakout arrow when a candle closes outside the range - Optional entry, stop-loss and take-profit lines for each breakout, with an adjustabl

Crypto_Forex Indicator "Correction Breakout Pro pattern" for MT4, No repaint, No delay. - Indicator "Correction Breakout Pro pattern" is very powerful indicator for Price Action trading with high profit potential. - Indicator detects bullish and bearish Breakout bars after the price correction: - Bullish Correction Breakout pattern - Blue arrow signal on chart (see pictures). - Bearish Correction Breakout pattern - Red arrow signal on chart (see pictures). - With PC and Mobile alerts. - Indicat

TCM SMC Indicator for MetaTrader 4 marks market structure on your chart: supply and demand zones, breaks of structure, liquidity grabs and fair value gaps. Everything is calculated from closed candles. What it shows - Fresh supply and demand zones, extended to the right until price returns to them, with the option to also show zones that have been revisited - Breaks of structure (BOS), labelled on the chart - Liquidity grabs (LQG), where price runs a recent high or low and turns back - Fair valu

BTCUSD SSL Channel Pro Multi-timeframe trend analysis and filtered BUY/SELL signals for MetaTrader 4. Overview BTCUSD SSL Channel Pro is a technical analysis indicator designed to help traders identify market direction, potential trend reversals, and filtered trading opportunities. The indicator combines an SSL channel with momentum analysis, trend-strength measurements, volatility conditions, tick-volume participation, and optional higher-timeframe confirmation. Its chart interface displays tre

TCM Trend Indicator for MetaTrader 4 highlights trend-following setups on closed candles and shows a suggested entry, stop-loss and take-profit for the latest one. What it shows - An arrow under or over the candle when a bullish or bearish trend setup appears, on closed candles only, so arrows do not repaint - Entry, stop-loss and take-profit lines for the latest setup, with the stop based on market volatility - A title and status line showing the current state Risk : reward Choose 1:1, 1:1.5, 1

Liquidity Sweep and Market Structure Indicator is a chart-based tool for MetaTrader 4 that highlights potential liquidity grabs around recent swing highs and lows. The indicator can optionally wait for a market structure break, known as a Change of Character, before displaying a directional signal. Its scoring system can include a volume filter and higher timeframe trend bias. Features Identifies potential bullish and bearish liquidity sweeps. Optional market structure confirmation. Configurabl

Crypto_Forex MT4 Indicator "Price Action Filter Histogram" - is an efficient auxiliary trading tool for Price Action trading! No repaint. - This indicator suggests to trader the direction of entries. Then trader just need to search for Price Action signals in that direction. - Price Action Filter Histogram should be combined with Price Action patterns and support/resistance levels. - Green color histogram - Look for Buy entries. - Red color histogram - Look for Sell entries. - Ther

Box Volume Profile Box Volume Profile draws a volume histogram inside any rectangle you place on the chart. Choose a time window and a price range, and the indicator shows how much volume was traded at each price level inside that zone. It also plots the Point of Control (POC) and the Value Area boundaries (VAH and VAL). How to use Press the draw hotkey (the letter V by default) and drag a rectangle anywhere on the chart. The volume profile appears immediately inside the box. Move or resize the

G2 SCANNER — 6-Setup Confluence & Trade Zone Suite by Ida Bagus Putu Mahardika Product Description G2 Scanner is a professional multi-setup indicator for MetaTrader 4/5 that combines 6 proven trading strategies into one elegant neon dashboard. Built for discretionary and systematic traders who want to see signal confluence, trade zones, and performance statistics in real time — without opening multiple charts or separate indicators. Six Core Setups VWAP Reclaim — mean-reversion entries aft

NexusFlow MTF Pro MT4 — The Ultimate Multi-Timeframe Power for MetaTrader 4 Tired of trading on the M5 or M15 timeframe only to realize too late that the H1 or H4 trend was completely against your entry? Lost count of how many times you had to open multiple windows, constantly switch charts, or clutter your screen with confusing indicators just to align the market direction? NexusFlow MTF Pro MT4 was engineered specifically to eliminate this operational friction and elevate your flow and trend a

FORBEX Murrey Math SRW Scanner PRO Find your zones. Check the confluence. Focus your analysis. FORBEX Murrey Math SRW Scanner PRO brings Murrey Math levels, SRW support and resistance, and Market Watch scanning into one interactive workspace for MetaTrader 4. Move from a broad market overview to a selected chart, with the tools to examine where price stands and which areas deserve closer attention. Key features Murrey Math chart levels: switch between Daily, Weekly and Monthly modes. Daily and W

UT Bot Scanner Pro MT4 is a scanner indicator for MetaTrader 4 that shows the UT Bot buy or sell side of many symbols and timeframes in one panel. It sends an alert when a new signal appears. The calculation is the same as in the free UT Bot Signal Alerts MT4 indicator, which covers one chart. The scanner runs it for a whole list, so you need not flip through charts. It places no orders. Cells use closed bars only, so a cell does not change after its bar has closed. Standalone: everything is bui

Confluence Dashboard MT4 is a dashboard indicator for MetaTrader 4. One row per symbol shows six checks (EMA, ADX, MACD, RSI, SuperTrend, UT Bot) and a BUY, SELL or WAIT verdict, with alerts. You choose how many checks must agree before the verdict turns BUY or SELL, so you see at a glance which symbols line up on one timeframe. It places no orders and does not repaint. Rows use closed bars only, and one copy shows one timeframe. Standalone: everything is built in. You do not need to buy or inst

Half Trend ADX MT4 is a trend indicator for MetaTrader 4. It draws a trend line with buy and sell arrows where the trend turns, sends alerts, and can skip weak turns with an ADX filter. It is an indicator, not a trading system: it places no orders and manages no trades. Arrows and alerts come from closed bars and do not repaint. Standalone: everything is built in. You do not need to buy or install any other product named on this page. MetaTrader 4 edition: the same calculation, line, arrows, cha
Range Filter Scanner MT4 is a scanner indicator for MetaTrader 4. One panel shows the latest range-filter signal on many symbols and timeframes, how many bars ago it came, and whether the next timeframe to the right agrees. It sends an alert when a new signal appears. It places no orders. It runs the same range-filter engine as the free Range Filter Signals MT4 indicator, for a whole list of charts at once, on closed bars only. Standalone: everything is built in. You do not need to buy or instal

Divergence Scanner MT4 is a scanner indicator for MetaTrader 4. One panel shows the latest RSI, MACD, Stochastic, CCI and OBV divergence on many symbols and timeframes. It shows how long ago each was confirmed and how many oscillators agree, and it sends an alert when a new one appears. It runs the same divergence engine as the free Divergence Signal Alerts MT4 indicator, for a whole list of charts at once. It adds three more oscillators and a count of how many agree. It places no orders. Cells

Candlestick Scanner MT4 is a scanner indicator for MetaTrader 4 that watches many symbols and timeframes for 21 candlestick patterns. Each cell of its panel shows the latest pattern. A context filter can keep only patterns at a recent low (bullish) or high (bearish). A statistics table shows what price did after each pattern in your own history, next to the same measure for any bar. It is for traders who want to check a whole watchlist in one place. It works on closed bars only. A cell never cha

Harmonic Scanner Pro MT4 watches many symbols and timeframes at once for eight harmonic patterns: ABCD, Gartley, Bat, Alternate Bat, Butterfly, Crab, Deep Crab and Cypher. One panel shows where a pattern has just reached its potential reversal zone. It also shows where one is forming close to its zone, and how long ago the last one completed. It uses only confirmed swings and closed bars. A completed pattern in a cell never changes afterwards. MetaTrader 4 edition: the same calculation, panel, o
Sequential Scanner MT4 is a panel indicator for MetaTrader 4 that runs the 9-13 sequential count on many symbols and timeframes at once. Each cell shows a fresh 9 or 13, a count one bar from completing, or a countdown in progress. Otherwise it shows the latest 9 or 13 and how many bars ago it came. It counts closed bars only. A cell never changes after its bar has closed. It places no trades. Standalone: Everything is built in. You do not need to buy or install any other product named on this pa

Gann Toolkit MT4 is an indicator for MetaTrader 4 that draws W.D. Gann's price and time tools from the swings it confirms: Square of 9 levels, Gann fan angles and the Gann box. It also draws the HiLo Activator and swing line of the free Gann HiLo Swing MT4 . A multi-symbol HiLo trend table and alerts are included. The levels, angles and box use confirmed swing pivots on closed bars. They change only when a new swing is confirmed. MetaTrader 4 edition: the same engine, levels, fan, box, table, in

SMC Session Scanner MT4 is a panel indicator for MetaTrader 4 that watches many symbols and timeframes for smart-money structure and session levels. For each symbol and timeframe it shows one of these: a fresh break of structure (BOS), a change of character (CHoCH), or a fresh liquidity sweep. It also shows price inside a live order block or fair value gap. Otherwise it shows the latest break and how long ago it was. A Session column shows the session now. It also shows today's first close beyon

GP Confluence Scanner MT4 Advanced Multi-Timeframe Market Structure & Confluence Analysis Don't get stopped out easily again! GP Confluence Scanner MT4 is an advanced technical analysis indicator developed for MetaTrader 4, designed to reveal important market levels, hidden support and resistance, and multiple technical confluences before entering a setup. Rather than relying on a single indicator, GP Confluence Scanner combines multiple analytical techniques to identify areas where significant

The Béway BIG 3 is a chart-analysis indicator, not a trading robot. It never places, modifies or closes an order. It draws levels and labels on your chart so you can plan your own trades. What you get The Béway BIG 3 is best paired with The Béway Panel which has Kngbé's Special Strategy checklist built in. It is truly a proprietary experience! 1. Smoothed VWAP VWAP is calculated from a timeframe you choose (default M15) and looks the same on every chart from M1 to H1. You can watch price

The Béway Sync is a chart-workflow utility indicator, not a trading robot. It never places, modifies or closes an order. It saves you the time of lining up charts and redrawing the same levels on every timeframe. What you get 1. Scroll Sync (same real time on every chart) Charts in the same sync group and symbol stay locked to the same calendar moment at the chart-shift marker. An H1 chart and an M1 chart land on the same instant, each snapped to its own nearest bar. Every chart jumps straight t

Push Scalping - Indicator for MetaTrader 4 Push is an indicator that helps identify BUY/SELL signals on MetaTrader 4, combining reversal conditions with the Push signal set. The signal only appears when the system confirms a closed candle and is displayed directly on the price chart. Use the One Click Trading MT4 to trade more effectively. The panel is draggable and automatically switches between light and dark modes based on the chart background. It features auto-scaling text within buttons,

A Chart-style Long/Short Position tool for MT4. Drag entry, take profit and stop loss directly on the chart, see the risk/reward ratio and the lot size calculated from your risk % instantly. Green TP zone, red SL zone, clean English labels, and a round on-chart button to show or hide the tool. Purely visual - it never opens, modifies or closes orders. Plan trades on MetaTrader 4 visually, directly on the chart. Place the box, drag the levels, and read the price, RR and position size at a glance.

Mega MNFM Mega MNFM is a MetaTrader 4 dashboard that brings completed-bar technical readings, a seven-timeframe trend map, market-session clocks and loaded account-history statistics into one panel. Technical dashboard Ten readings: RSI, MACD histogram, Stochastic, EMA trend, ADX, Bollinger Bands, a local technical Fear & Greed proxy, an indicative synthetic dollar basket, ATR rank and OBV flow. Multi-timeframe map covering M1, M5, M15, M30, H1, H4 and D1. Directional summary, trend strength, li

Crypto_Forex Indicator CCI HTF Oscillator for MT4. - Upgrade your trading methods with the professional CCI HTF Oscillator for MT4. HTF means - Higher Time Frame. - Commodity Channel Index (CCI) measures the difference between the current price and the historical average price. - Important levels: +/-100. - It is great to take Sell entries from above +100 zone and Buy entries from below -100 zone. - This indicator is excellent for Multi-Time Frame trading systems with Price Action entries or i

QUANTUM BINARY SNIPER MT4 AI Special Engine | Three-Candle Price Action | Multi-Timeframe CCI Momentum | Quantum Binary Sniper MT4 brings several layers of chart analysis into one coordinated MetaTrader 4 workspace. It combines the AI Special Engine / Prediction Engine component, a defined three-candle algorithm real-time directional arrows, multi-timeframe CCI momentum rectangles, historical pattern backfill and a distinctive dark interface. Every major visual element has a clear purpose: ident

Pattern Oracle is an all-in-one chart pattern engine for MetaTrader. It scans three zigzag levels at once, finds more than 30 harmonic, chart, continuation and reversal patterns, scores every setup and draws a complete trade plan with entry, stop-loss and two take-profit levels. A built-in teaching mode explains every pattern right on the chart. Pivots are only used once they are confirmed and every decision is made on a closed bar, so signals do not repaint . Patterns detected Reversal : Double

Quantum Edge is a machine-learning trend and signal indicator for MetaTrader. It combines a Lorentzian-distance k-nearest-neighbours classifier, a rational-quadratic kernel regression cloud and a multi-timeframe trend filter into one clean chart tool, then turns the result into clear, tiered BUY and SELL setups with ready-made stop-loss and three take-profit levels. Every signal is calculated on closed bars only . Once a label appears on the chart it stays exactly where it is: no repainting, no

Inversion FVG finds Fair Value Gaps (3-candle imbalances) and trades the moment they fail. When a candle body closes through a gap, the gap is "inverted" and turns into support or resistance. When price retests it and is rejected, the indicator prints an arrow with ready-made Entry, Stop Loss, TP1 and TP2 levels.
How it works 1. A bullish or bearish FVG is detected and drawn as a raw zone. 2. A candle body close through the zone inverts it. 3. First retest + rejection close = signal arrow (blu

Elliott Wave Auto Count labels Elliott waves automatically on four degrees at the same time: the base degree and the three degrees above it. It follows the rules and guidelines of "Elliott Wave Principle" (Frost & Prechter). For the current wave it also shows a price x time target zone and an invalidation level. This is the MetaTrader 4 version; the counting logic is the same as in the MetaTrader 5 version (sold separately).
HOW IT WORKS 1. Swings: five ATR(100)-based zigzags. Each higher degr

Dow Structure MTF shows the Dow theory trend structure of five timeframes at the same time, using the pullback low / rally high approach that is common among Japanese traders. For each timeframe you see whether the trend is up, down or range, which price would change it, and how far the current price is from that level. Only closed bars are used, so a confirmed result never changes afterwards (no repaint). This is the MetaTrader 4 version; the logic, inputs, display and alerts are the same as i

Fibo Price Time Zones combines Fibonacci price levels with Fibonacci time targets and draws them on the chart as boxes (price x time zones). It helps you organize which price areas to watch and roughly when. Where boxes from several waves and from higher timeframes overlap, the area is emphasized in three levels. Base waves are built only from confirmed swings, so a confirmed box does not move afterwards (see the conditions below). This is the MetaTrader 4 version; the calculation, inputs, defa

LIGHTHOUSE — see the market structure at a glance. Non-repainting. LIGHTHOUSE reads price structure from confirmed swing points and shows it on the chart in a clean, simple way. It answers three questions every discretionary trader asks before entering: Which way is the higher timeframe going? Which way is the current chart going? Where are the important price levels?
It is a decision-support tool. It does not place trades and does not predict prices. Why "LIGHTHOUSE"?
A lighthouse shows ships t

Crypto_Forex Indicator "Relative Drawdown Display" for MT4 This is a MUST-HAVE tool for traders who use grid trading systems! Real-Time Tracking: Shows current Relative DD or Floating Profit in % directly on your account. Smart Notifications: Built-in PC and Mobile Alerts with an adjustable trigger level. Account Overview: Displays your current account Balance and Equity. Fully Customizable: Easily change the font size, colors, and locate indicator values in any corner of the chart. Traders don
The MetaTrader Market is the only store where you can download a free demo trading robot for testing and optimization using historical data.
Read the application overview and reviews from other customers, download it right to your terminal and test a trading robot before you buy. Only on the MetaTrader Market you can test an application absolutely free of charge.

You are missing trading opportunities:
- Free trading apps
- Over 8,000 signals for copying
- Economic news for exploring financial markets
Registration
Log in
You agree to website policy and terms of use
If you do not have an account, please register