ValueOrbit MT4

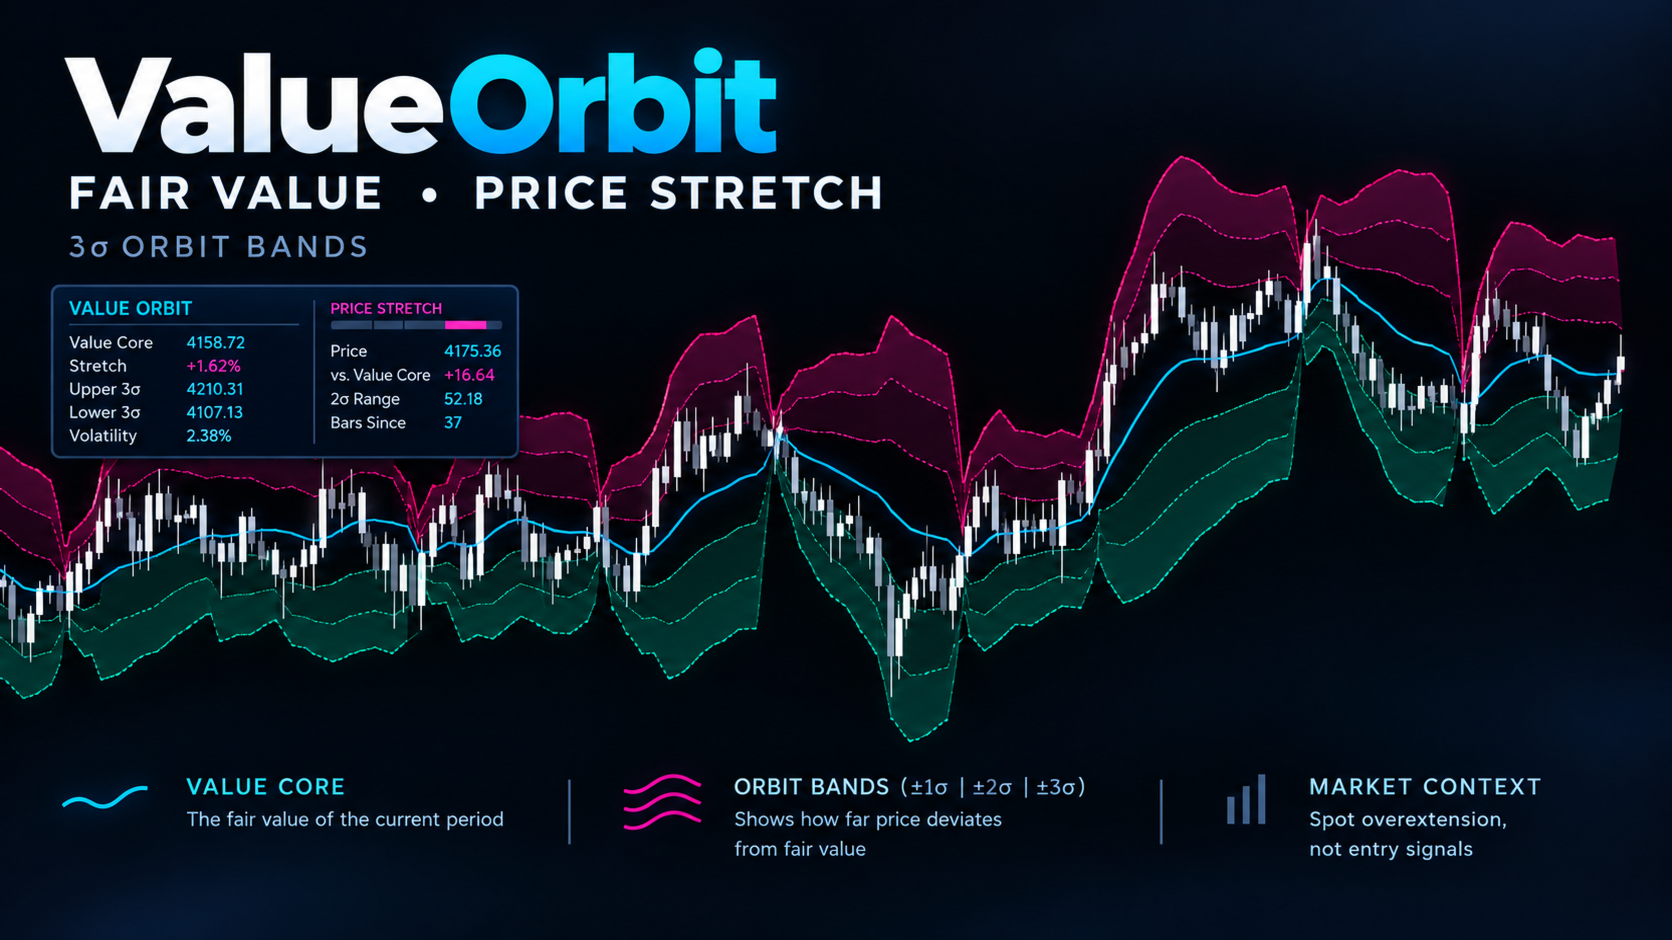
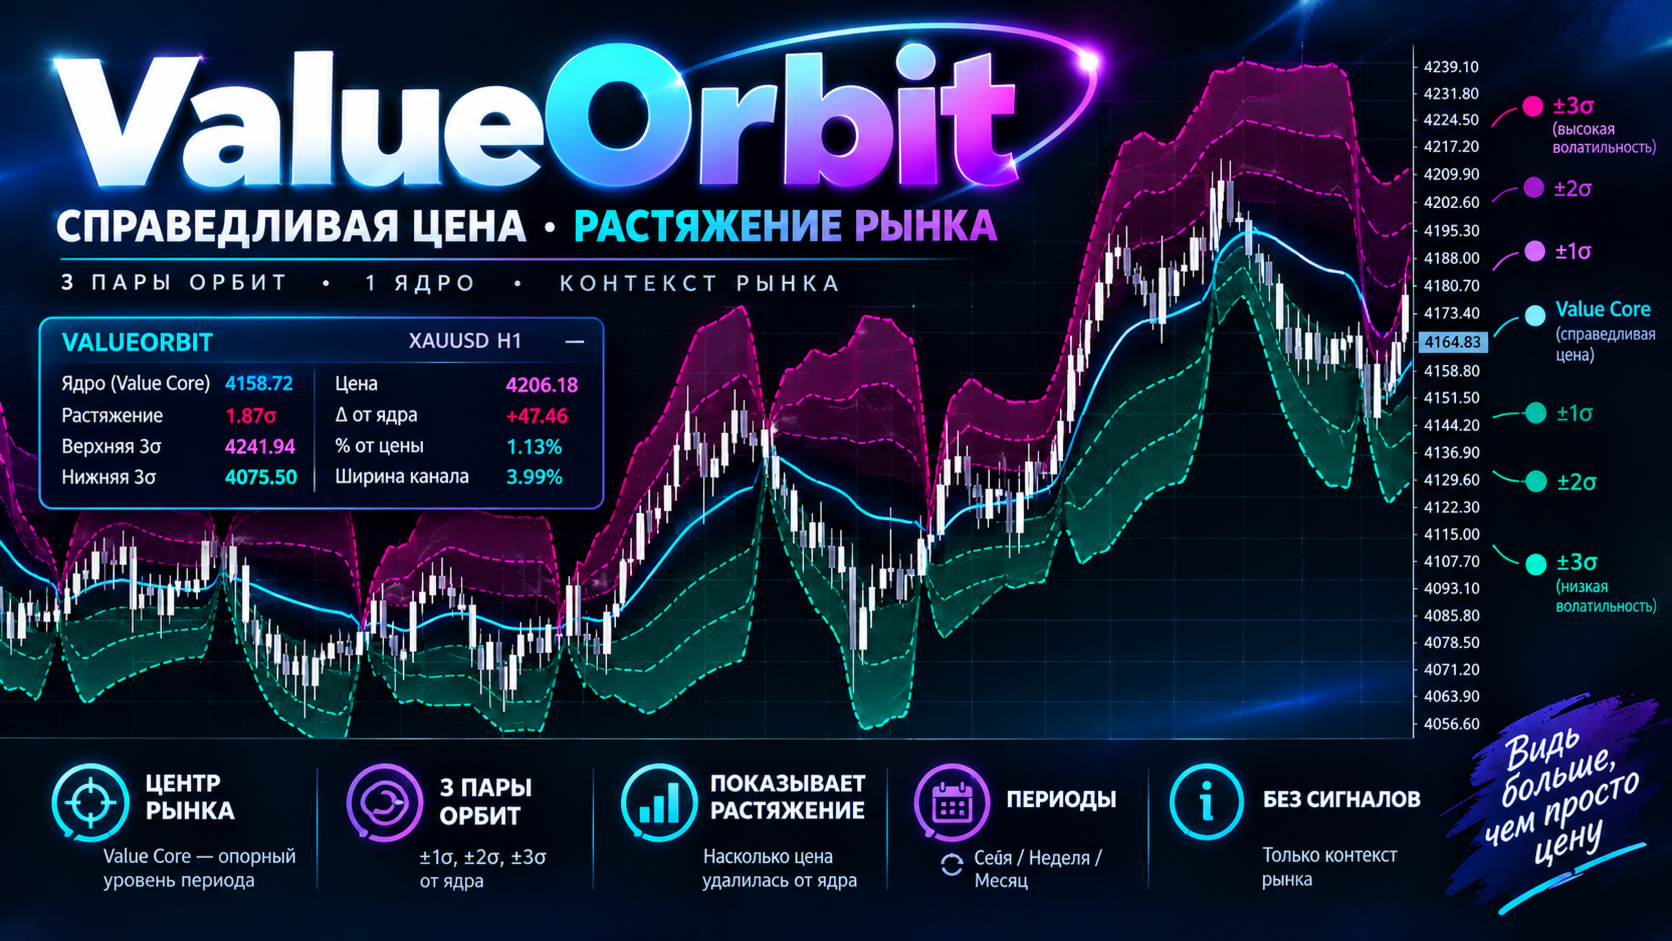
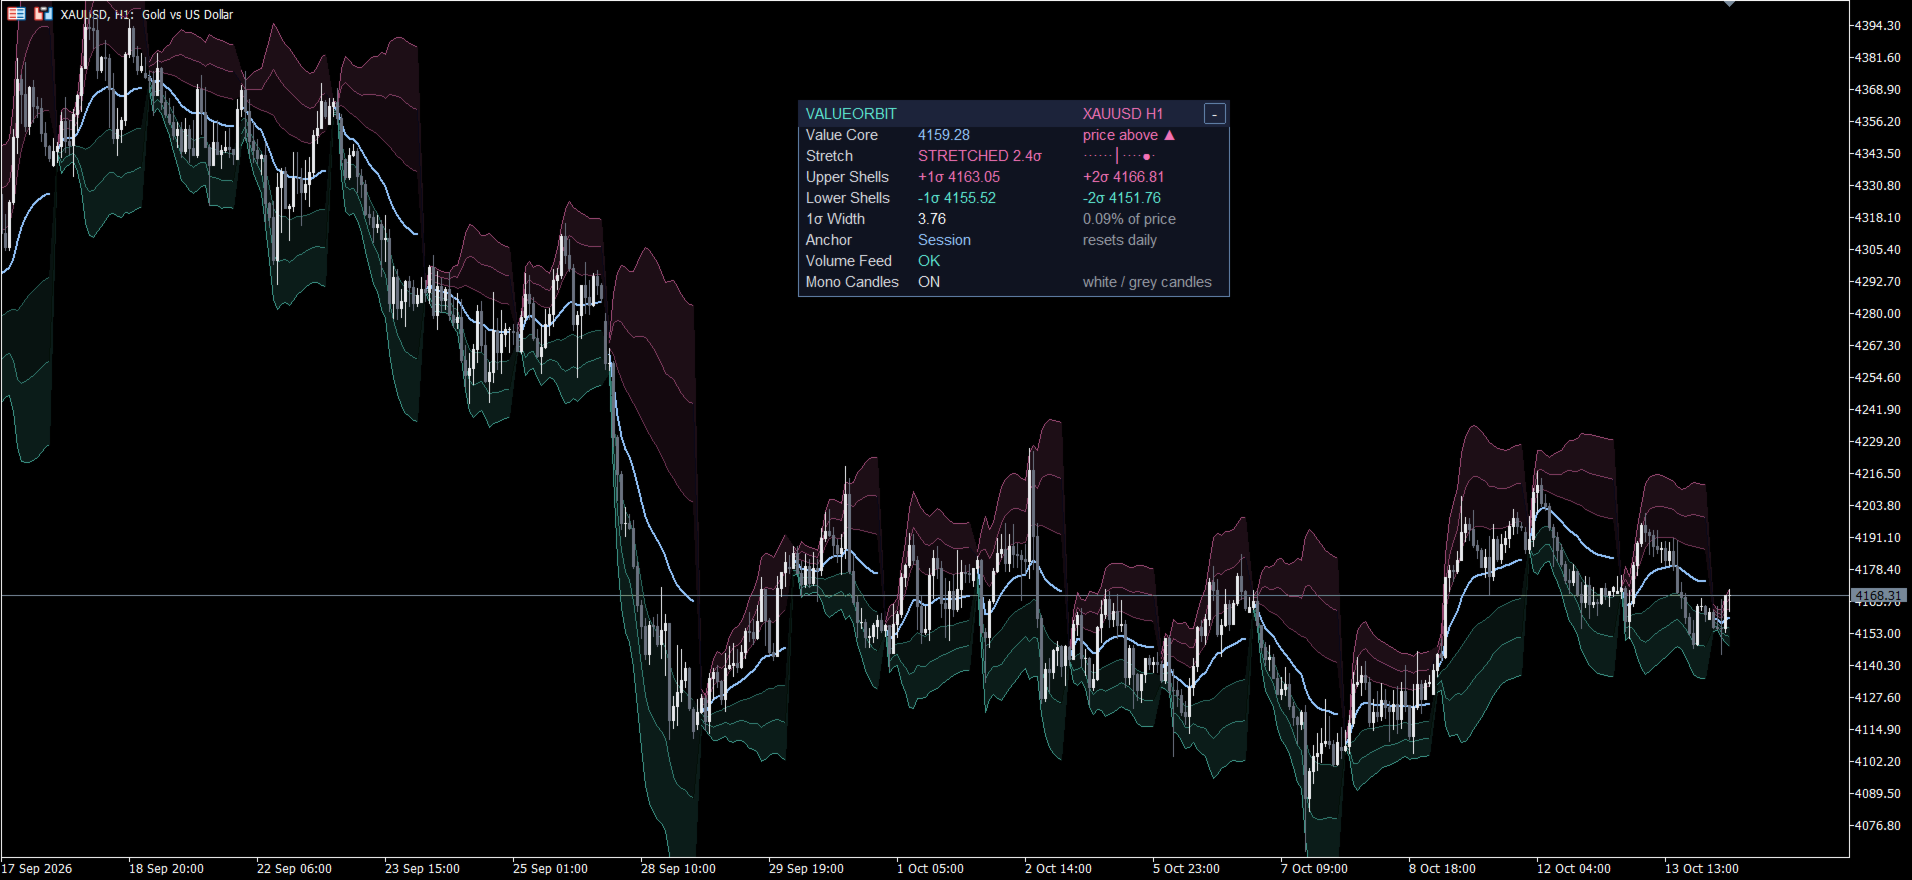
ValueOrbit は、現在の期間における「適正価格」の位置と、相場がそこからどれだけ離れているかを示します。コンテキスト用のツールで、中央ラインの Value Core とその周囲の3組のオービット(±1σ、±2σ、±3σ)を描画し、パネルで価格の伸び具合を表示します。エントリーシグナルは出しません。

MT5-version: https://www.mql5.com/en/market/product/201292

仕組み

Value Core は、各期間(セッション・週・月)の開始から形成され、新しい期間が始まると最初からやり直す基準レベルです。オービットはこのレベルからの標準的な距離を σ 単位で示します。価格がコアに近いほど相場は均衡しており、離れるほど伸びきった状態です。期間の切り替わりでは垂直なジャンプを避けるため、ラインが途切れます。

使い方

  1. チャートに適用し、スタイルに合わせて Value Anchor を選びます。デイトレードは Session(M1〜H1)、スイングは Week(H1〜H4)、H4〜D1 は Month が目安です。
  2. 環境認識:価格が Value Core より上なら買い優勢、下なら売り優勢です。
  3. 価値への回帰:レンジ相場では、±2σ 以上への動きがコアへの戻りで終わることがよくあります。ご自身のエントリー手法で確認してください。
  4. トレンド順張り:トレンド中は価格がコアの片側に留まり、コアや ±1σ までの押し・戻りがトレンド方向のエントリーを探すゾーンになります。
  5. 利確・損切り:コアとオービットは、現在のボラティリティに合わせて動く TP/SL の目安になります。
  6. ±3σ ゾーン(EXTREME)は異常な伸びです。反転の場合も継続の場合もあるため、確認を待ってください。

設定

Value Core

  • MQL5.com account — 情報欄です。動作には影響しません。
  • Value Anchor — コアがやり直されるタイミング:Session(毎日)、Week(毎週)、Month(毎月)。D1 以上では Session は自動的に週単位になります。
  • Core Source — 計算に使う価格。
  • Volume Type — Tick volume(ティックボリューム)または Real volume(ブローカーが提供する場合の実ボリューム)。
  • Show Value Core — 中央ラインを表示します。

Orbit Shells

  • Show +-1 sigma Shell / Show +-2 sigma Shell / Show +-3 sigma Shell — 対応するオービットの組を表示します。
  • Fill Orbit Field — オービット間の塗りつぶし。
  • Shell Line Transparency (0-100) — オービットラインの透明度。
  • Field Fill Transparency (70-100) — 塗りつぶしの透明度。

Orbit Palette

  • Core Color、Upper Field Color、Lower Field Color — コア、上側ゾーン、下側ゾーンの色。
  • Mono Candles (white / grey) — ローソク足を白/グレーにし、色をインジケーターのゾーンだけに残します。
  • Mono Up Candle / Mono Down Candle — 陽線・陰線の色。

Value Dashboard

  • Show Value Dashboard — パネルを表示します。
  • Dashboard Position — 初期位置(Top Left、Top Right、Bottom Left、Bottom Right)。
  • Dashboard Text Size — パネルの文字サイズ。

Alerts

  • Popup Alerts — ターミナルのポップアップ通知。
  • Push Notifications — スマートフォンへのプッシュ通知。 アラートは足の確定時に作動します:コアの上抜け・下抜け、+2σ または −2σ の突破、±3σ の突破。

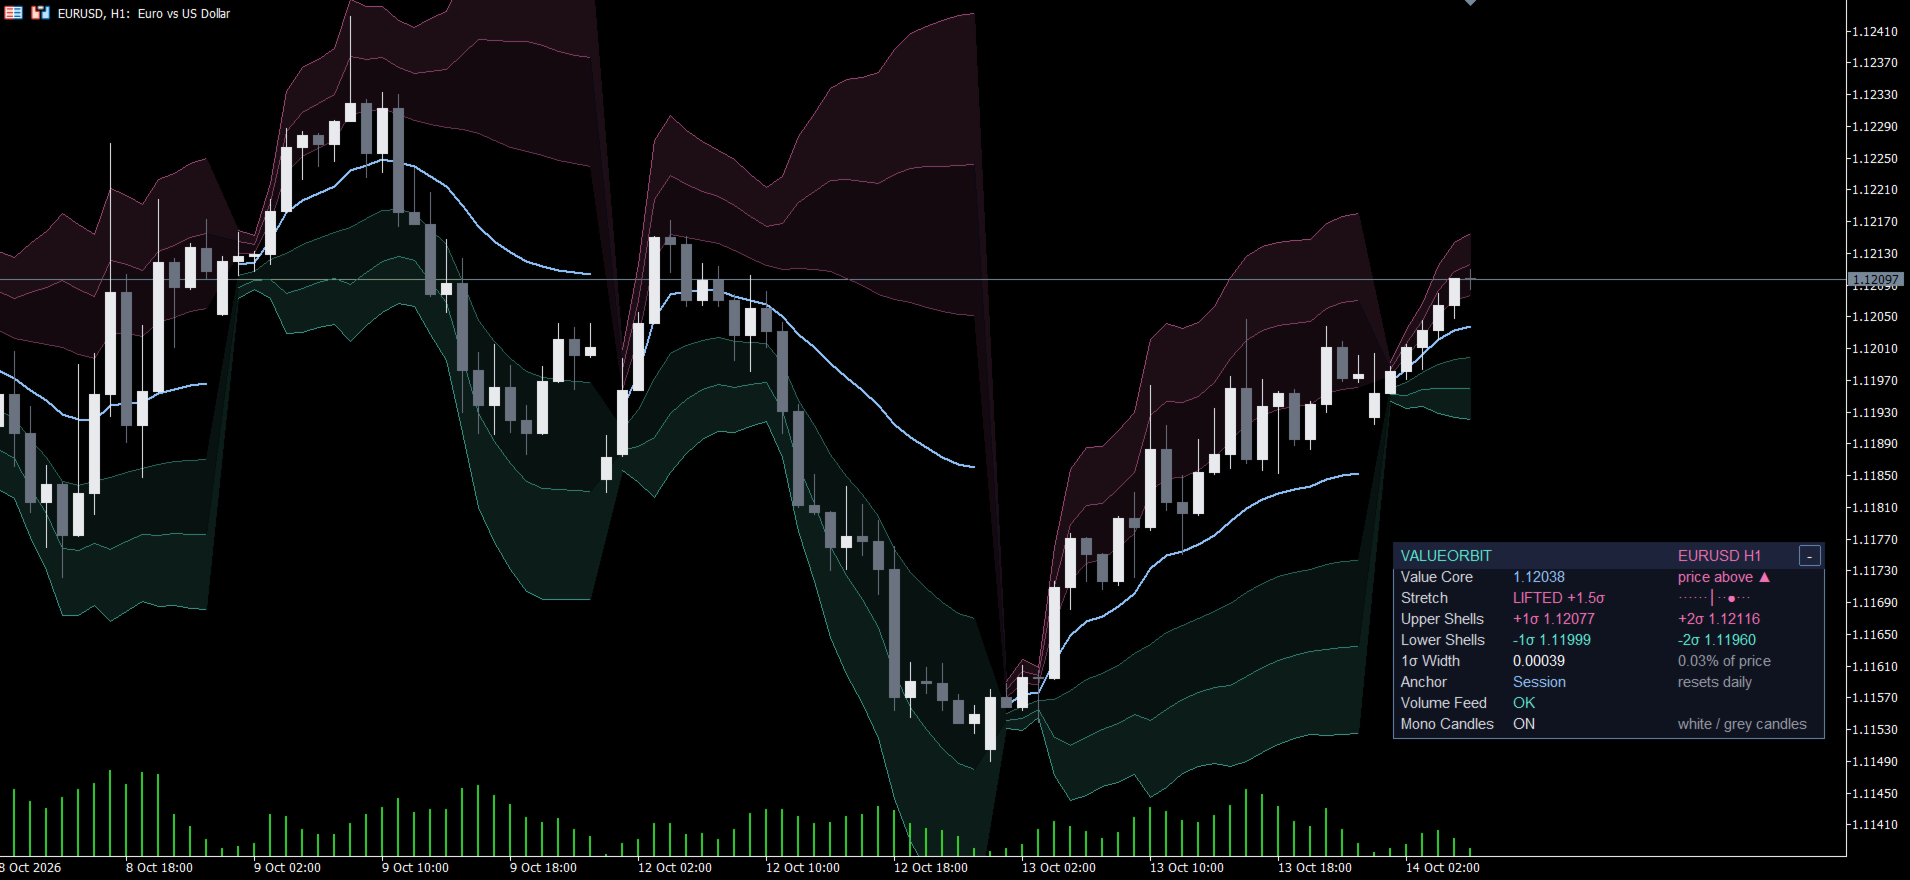
パネルの見方

ヘッダーをドラッグしてパネルを移動でき、「−」/「+」ボタンで折りたたみ・展開ができます。折りたたみ時もヘッダーに Stretch の簡易表示が残ります。

  • ヘッダー — 銘柄と時間足。
  • Value Core — 現在のコアの水準と価格の位置:price above ▲(上)または price below ▼(下)。
  • Stretch — コアからの価格の乖離を σ で表示します。ORBIT — fair value:1σ 未満、均衡状態。LIFTED + / SINKING −:上方向/下方向に 1σ〜2σ。STRETCHED:2σ〜3σ。EXTREME:3σ 以上。右側のゲージは −3σ〜+3σ を表し、● が現在位置です。
  • Upper Shells / Lower Shells — ±1σ と ±2σ の価格水準。
  • 1σ Width — オービット1本分の幅(価格および価格に対する %)。相場の現在の「幅」を示します。
  • Anchor — 選択中のモードとリセット周期(daily / weekly / monthly)。
  • Volume Feed — ボリュームデータがあれば OK、なければ NO VOLUME で、その場合コアは価格に追従するだけになります。
  • Mono Candles — ON/off、モノクロローソク足の状態。
おすすめのプロダクト
Pivot Points Classic and Camarilla は、クラシックピボットレベル(P、R1-R3、S1-S3)とCamarillaレベル(H1-H4、L1-L4)をチャート上に直接描画します。レベルは選択した時間足(デフォルトはD1)の前の期間の高値・安値・終値から計算され、各期間はそれが適用される期間にわたって水平線で描画されるため、過去の日・週・月に価格がレベルにどう反応したかを確認できます。 機能 クラシックピボット - 中心のピボットPと、3本のレジスタンス(R1-R3)、3本のサポート(S1-S3) Camarillaピボット - H1-H4とL1-L4の8レベル。Camarillaトレーダーが最も注目するレベルであるため、H3/L3とH4/L4は太く描画されます。クラシックではピボットPと外側のR3/S3が太くなります Classic、Camarilla、または両方 を同じチャートに表示可能。Classicの線は実線、Camarillaの線はデフォルトで破線スタイルです(線のスタイルは入力パラメータで変更できます) 任意のソース時間足 - 日中足チャートで

FREE
We Trade Live Trend Levels  This indicator is a fantastic addition to the We Trade Live Trend Max this helps filter out noise and helps with better entries into a trade this add on is a must have and we use it all the time along side We Trade Live Trend Max this is a fantastic tool to help with entering a trade and exiting a trade,  This indicator Calculates  Volume strength  indicating levels of support and resistance for a trade, measures momentum in a market making buying or selling into the
FREE
インディケータを使用すると、現在の価格の方向性と市場のボラティリティを判断できます。このバージョンのTradersDynamic Indexでは、履歴データの再描画が排除され、アルゴリズムの計算速度が最適化され、より正確な調整のための外部パラメーターが増え、その機能が拡張されました。初期オシレーターの選択と平均の平滑化方法が追加されました。 。 パラメーター: Mode Osc - 推定発振器の選択 Period Osc - 使用する発振器の計算期間 Price Osc - 振動計算の適用価格 Osc volatility bands period - オシレーターのボラティリティ期間 Osc volatility bands multiplier - オシレーターのボラティリティ乗数 Smoothing Osc price line period - 本線の平滑化期間 Smoothing Osc price line method - 本線の平滑化方法 Smoothing Osc signal line period - 信号線の平滑化周期 Smoothing Osc signal
Remaining Time MT4
Dhokiyas Money Map Investment Consultants - FZCO
Candle Remaining Time MetaTrader 4 用 ローソク足のクローズを逃さない 完璧なタイミングで取引 MT4 精密タイマー Candle Remaining Time Candle Remaining Time は MetaTrader 4 用に設計された軽量で高精度なタイミングツールです。現在のローソク足の残り時間をリアルタイムでチャート上に表示します。 ローソク足の確定を重視するトレーダー向けに開発されています。スキャルピング デイトレード ブレイクアウト プライスアクション戦略など 正確な時間管理によりエントリー精度が向上します。 ローソク足確定に依存する戦略なら このツールは必須です。 なぜタイミングが重要か 多くの取引システムでは ローソク足が完全に確定してからエントリーします。カウントダウンが見えない場合 残り時間を推測して早すぎるエントリーをしてしまうことがあります。 Candle Remaining Time は チャート上に明確なリアルタイムカウントダウンを表示し 不確実性を排除します。 主な機能 リアルタイムカウントダウン表示 M1
FREE
Malik Naveed Volume — Better Volume Multi Timeframe Malik Naveed Volume shows you what the volume is really doing. It reads each candle's volume and price range, splits it into buying vs selling pressure, and colours the bars so you can instantly see climax moves, absorption (churn), and low-volume exhaustion. It then draws support/resistance levels from those key bars and alerts you when price breaks and retests them — across six timeframes at once, on any symbol. Works on ANY symbol and ANY
FREE
Pivot Points MT4
KEENBASE SOFTWARE SOLUTIONS
KT Pivot Points は、最新の市場データに基づいて、日足・週足・月足のピボットレベルをチャート上に自動で表示します。ピボットポイントは、特にFX市場において、テクニカル分析で広く利用されている指標の一つです。 特徴 価格がピボットレベルに到達した際にアラートを送信します。  各種類のピボットレベルに対して完全なカスタマイズが可能です。   シンプルな表示で、日足・週足・月足のピボットレベルを一目で確認できます。 最小限のCPUリソースを使用し、高速な計算を実現します。 チャート上の他のインジケーターとも互換性があります。 ピボットポイントとは ピボットポイントは、前の取引日の高値、安値、終値の平均から算出されます。  この計算により、将来のサポートおよびレジスタンスレベルを予測でき、価格がこれらのレベル付近でどのように動くかを判断する手助けとなります。 また、価格がピボットポイントの上にあるときは強気傾向、下にあるときは弱気傾向とされるのが一般的です。 ピボットの計算式 ピボットレベルの計算には、前日、週、または月の高値、安値、終値が使用されます。 P = (H +
Raymond Cloudy Day Indicator for MT4 – Pivot-Based Reversal and Trend Levels Raymond Cloudy Day Indicator is a pivot-based level indicator for MetaTrader 4 (MT4). It was developed by Ngo The Hung based on Raymond’s original idea and is designed to give a structured view of potential reversal zones, trend extensions and support/resistance levels directly on the chart. The default settings are optimised for XAUUSD on the H1 timeframe, but the indicator can be tested and adjusted for other symbols
Индикатор реализован для определения классического канала движения цены, который используется на крупных биржевых площадках. Не перерисовывается Синий уровень - это уровень поддержки  Красный уровень - это уровень сопротивления  Белый уровень - является Pivot-уровнем  Настройки Period_SEC  - ввод  значения периода . Примечание:  Индикатор определяет уровни только на пятизначных котировках! Метод торговли:  Открытие позиций осуществляется от уровней , именно на их значениях происходит отскок цены
FREE
Description: This indicator draw ZigZag Line in multiple time frame also search for Harmonic patterns before completion of the pattern. Features: Five instances of ZigZag indicators can be configured to any desired timeframe and inputs. Draw Harmonic pattern before pattern completion. Display Fibonacci retracement ratios. Configurable Fibonacci retracement ratios. Draw AB=CD based on Fibonacci retracement you define. You can define margin of error allowed in Harmonic or Fibonacci calculations
FREE
VR Pivot - これは、主要なピボットポイント(pivot)の指標です。 ピボットポイントは、最強の価格帯を識別するために使用される特別なタイプのサポートレベル(support)と抵抗(resistance)です。プロのトレーダーは、価格の反転の高い確率がある価格を決定するために逆転のポイントを使用します.レベルは、特別な数式に従って計算され、終了、開口部、最大、前の期間の最小値の価格が考慮されます。最も効果的なのは、毎日の期間です。一見すると、これらのレベルに特別なものは何もないと思われるかもしれませんが、ピボットポイントのレベルの助けを借りて価格の動きを分析すると、ほとんどの場合、これらのレベルが良好で正確な結果を示していることがわかります。 テクニカルサポート、設定およびソフトウェアの体験版は、作者のプロファイルによりリクエスト できます。 逆転ポイントは、ピボットポイントとしてだけでなく、最大利益のために可能な限り効率的に使用できるレベルとして使用することができます, 損失を最小限に抑えるために損失を停止, リスクを軽減するために、損失ゾーンにポジションを転送. インジケ
VWap Bands EForex
Veridiana Adorno Kendrick
VWAP Bands Metatrader 4 Forex Indicator The VWAP Bands Metatrader 4 Forex indicator is a quite similar to the Bollinger bands, but it deploys volume weighted average as the core value of the bands. There is an option of using the tick volume or real volume for calculation when using the VWAP Bands Metatrader 5 custom forex indicator, especially when the forex broker displays symbol alongside real volume. Similarly, you can decide to have deviations calculated with the sample correction or not.
STRUCTURAL TREND LINES - MT4 Indicator Simple indicator that automatically draws trend lines based on market structure. Features: - 3 degrees of structure detection (short, medium, long term) - Configurable swing strength for each degree - Single color per degree for clean visualization - Adjustable number of lines per degree - Customizable colors and line widths How it works: The indicator identifies swing highs and lows based on the strength parameter, then connects these points to create t
FREE
AXIOM FVG + Order Block Pro v4.1 MetaTrader 5 向けのプロフェッショナル ICT・SMC 機関投資家向けトレーディング指標。 概要 AXIOM FVG + Order Block Pro は、ICT および SMC の方法論に基づいて Fair Value Gaps と Order Blocks を検出する非再描画指標です。機関投資家の活動が発生する可能性が高い需給ゾーンを特定します。 主な機能 任意の時間足で Fair Value Gap を検出。最小サイズの設定とリアルタイムの緩和トラッキングが可能。 インパルス確認と設定可能なローソク足数による Order Block 検出。 市場構造に沿ったトレンドコンテキスト、直近の高値・安値付近の流動性検出、ロンドン・ニューヨーク・アジアセッションの Killzone フィルター、0.5 から 10 までの独自のゾーン強度スコアリングを含むプレミアムフィルター。 コンフルエンス検出は FVG が Order Blocks と重なる場合を識別し、高確率ゾーンに強度ポイントを追加。 セッションステータ
This indicator filters the Zigzag indicator to calculate the main support and resistance levels. Variables minimum gap between peaks : is the distance (GAP) between the peaks of the Zigzag peaks sensitivity : Minimum number of nearby peaks look back: it means that it has to test the last 50 peaks in the Zigzag object name perfix: a prefix for level’s line name on chart
FREE
Colored Volume
Seyed Ali Tabatabaei Lotfi
The Colored Volume is a simple, yet useful indicator that paints the color of the volume based on the price direction.  If the price has increased, the volume will be shown in green. If the price has decreased, the volume will be shown in red. This indicator will make it super easy for traders to track volume bars based on price movements. (The settings of the volume bars including line width and color can be manually changed by the trader.)
The Auto Fibonacci Indicator is a professional technical analysis tool that automatically draws Fibonacci retracement levels based on the most recent closed Daily (D1) or 4-Hour (H4) candle. These levels are widely used by traders to identify key support , resistance , and trend reversal zones . This version is designed for manual trading and supports a powerful trading strategy using Fibonacci levels combined with a 50-period EMA (Exponential Moving Average) , which you can easily add from MT4
FREE
Closing average This is a completely new indicator in technical analysis. It is based solely on mathematical calculation. about signals It’s worth going into a buy transaction when the price has crossed the indicator line from bottom to top and it is under the price it is worth entering a deal on sell when the price is below the indicator line This author’s development, he doesn’t use any indicators of technical analysis in his analysis.
私のMT4・MT5インジケーターをすべて無料で入手 — 方法はこちら 新しいツールの価格   は   $30   で、対象は   発売後最初の1週間   または   最初の3件の購入です !  MQL5のTrading Toolsチャンネル : 私のMQL5チャンネルに参加して、最新情報を受け取ってください 概要 OA SnR Powerは、サポートおよびレジスタンスレベルの強度を識別して評価するために設計された強力なツールです。取引量、反発頻度、再テスト回数などの重要な要素を組み込むことで、このインジケーターは市場の重要な価格ゾーンを包括的に可視化します。 その他の製品を見る:   すべての 製品 OA SnR Powerの仕組み 高値と安値の特定 このインジケーターは、ローカル高値と安値を計算するための高度なアルゴリズムを使用します。 ユーザーはゾーン幅の設定を調整でき、サポートおよびレジスタンスの潜在的なレベルを正確に検出します。 主要レベルのフィルタリングと統合 近接するレベルは、ユーザーが定義した範囲に基づいて自動的に統合され、チャートをクリーンに保ち、重要な価格領域に
FREE
Fair Value Gap (FVG) Free Edition – 自動スマートマネー・フットプリント ICT(Inner Circle Trader)およびSMC(Smart Money Concepts)のメソッドにおいて、Fair Value Gap(FVG:公正価値ギャップ。インバランスとも呼ばれます)は、価格が極端なモメンタムで動き、流動性の空白を残していったときに発生します。これらの埋められていないギャップは、将来の価格変動を引き寄せる磁石のように機能するため、プロトレーダーにとって最も確率の高いリトレースメントおよびエントリーゾーンとなります。 Pro版へのリンク: https://www.mql5.com/en/market/product/147694 手動でゾーンを描画するのをやめましょう。 Fair Value Gap (FVG) Free Edition をご紹介します。この軽量かつ高精度なインジケーターは、チャート上のコア・インバランスを自動的に検出し描画するため、手動による面倒なチャートマークアップなしで機関投資家の足跡を特定するのに役立ちます。重労働は
FREE
BeST_ Classic Pivot Points is an MT4 Indicator that is based on the widely known and definitely classic Pivot Point of a market prices activity. A pivot point is calculated as an average of significant prices (high,low,close) from the performance of a market in the prior trading period. If the market in the following period trades above the pivot point it is usually evaluated as a bullish sentiment, whereas trading below the pivot point is seen as bearish. A pivot point and the associated suppo
FREE
SR indicator
Alexander Chertnik
5 (3)
SR is a support and resistance indicator, it shows major highs and lows by different colors. The color of a level is changing if the last high or low are touching it. After the closing of a bar above or below level, it will delete it. extern inputs: loop for candles / colors / drawing time *This indicator signal is not perfect and have to be used with other market analysis and confirmations.
FREE
This is a regression tree indicator for MT4/MT5. This indicator classificate nodes on the time period so that the deviation becomes smaller, and displays regression line and channel for each node. It's free! Attached CartDemo.ex4 and CartDemo.ex5 is a Demo version and has the following limitations: Can't use HighSpeed method (default method is RandomForest) Maximum number of bars is 260 (increase from 200) There is no expiration date and can be started many times, but it stops after an hour.
FREE
Indicator FiboZag - transfer the indicator to the chart and the Fibonacci levels will be built automatically on the last ZigZag turn. The main advantage lies in the correct construction of Fibonacci levels and markup of price levels. Simple, visual and effective use. The indicator is not redrawn and does not lag. Works on all currency pairs and on all timeframes.
The Multi Trendlines indicator automatically draws the dominant trendlines on the current chart. The indicator looks for the 5 best Up trends and the 5 best Down trends as at the current price, drawing each trendline if filter conditions are met. The trendlines are named "Trendline"+[Direction]+Symbol()+TrendlineSequenceNumber For example: The second Up trendline on a EURUSD chart would be named "TrendlineUpEURUSD2".   To get its current value would be: ObjectGet("TrendlineUpEURUSD2",OBJPROP_PRI
FREE
For Multi Time Frame version, please click here. BASE TRADING SYSTEM is a useful tool to trade with simple strategy. It draws automatically base up for long trade and base down for short trade. Clear trade when base is going opposite direction. User can trade by instant market entry or by pending order entry. It depends on user best strategy. input: Base Box Color- UP base box , DOWN base box, UP base shadow, Down base shadow.
FREE
TCL Boll Bands Trader is a Bollinger Bands indicator for MetaTrader 4 with a multi-mode trend filter, dual-deviation entry levels, volatility subfilters, and an interactive on-chart dashboard. How It Works Standard Bollinger Bands signals can produce signals against the dominant move when the underlying market is in a strong trend. This indicator addresses that by checking each potential signal against a configurable trend filter before plotting it, and by adding squeeze, Average Directional Ind
FREE
Double Price Channel   設定で指定された特定の数のバーの価格チャネルインジケーター。 インジケータラインは、動的なサポートまたは抵抗レベルを表します。上限は特定の期間の価格の最大値であり、下限は最小値です。終値に基づく移動平均とは異なり、指標は小さな変動によって「気が散る」ことはありません。境界が変更された場合にのみ再計算されます。後者が発生した場合は、新しいトレンドのアプローチについて真剣に考える価値があります。期間の異なる2つの指標を1つのチャートで同時に使用する戦略があります。このような場合、周期の短いインジケーターは2番目のインジケーターの内側に配置されます。 インジケーター設定の説明: Width_Bars-インジケーター期間 高さ-高さ(ポイント単位)
FREE
Like Support and Resistance levels, Round Numbers refer to price levels ending in one or more zeros, such as 125.00, 1.0350, 0.8750, 74.50, etc. These are psychological levels where financial institutions and traders expect price to either stall, retrace or breakthrough. On a price chart these figures are generally considered to rule off levels at the 50 and 100 mark. 5TT Round Numbers Indicator makes it absolutely easy for the trader to identify these levels on the chart without the laborious a
Auto Fibonacci Retracement Indicator — Flexible and Reliable This is not just another Auto Fibonacci Retracement indicator — it’s one of the most flexible and dependable tools available . If you find it useful, please leave a review or comment to support the project. Check out my other helpful tools below: Telegram to MT4 using AI   - AI-Powered Signal Copier Bot Timeframes Trend Scanner    - Scan the trend of assets in difference timeframes with multiple indicators Market Trend Scanner   - Scan
FREE
Rainbow MT4 is a technical indicator based on Moving average with period 34 and very easy to use. When price crosses above MA and MA changes color to green, it’s a signal to buy. When price crosses below MA and MA changes color to red, it’s a signal to sell. The Expert advisor ( Rainbow EA MT4) based on Rainbow MT4 indicator, as you can see in the short video below is now available here .
FREE
このプロダクトを購入した人は以下も購入しています
Trend SniperX MT4
Sarvarbek Abduvoxobov
5 (5)
Trend Sniper X は、トレーダーがトレンドの方向性と潜在的な反転ポイントを明確かつ正確に特定できるように設計された、MetaTrader 5 用のマルチタイムフレーム・トレンドフォロー指標です。 MT5版はこちら: https://www.mql5.com/en/market/product/181101 価格情報: 現在の価格はプロモーション価格であり、今後のアップデートや新機能の追加に伴い変更される場合があります。 Code2Profit チャンネル マルチタイムフレーム分析で市場をマスターしよう! Trend Sniper Xで勝率を最大化する方法:ルールとセッションのコツ 技術仕様 プラットフォーム MetaTrader 5 インジケータータイプ マルチタイムフレーム・トレンドインジケーター 動作タイムフレーム すべてのチャート時間足(上位足M1~MN1を独立して選択可能) 主要対象銘柄 為替(Forex)、ゴールド(XAUUSD)、その他のCFD 推奨口座 すべての口座タイプ ビジュアル表示 トレンドカラーローソク足(買い/売り/弱い/変化)+ 買い/売りシグナル
Tokyo Indicatorは、トレンドの方向性、潜在的な取引シグナル、および市場状況を視覚的に分かりやすく表示します。 色分けされた階段状のトレンドラインにより、強気局面(青色)と弱気局面(マゼンタ色)が明確に区別されます。トレンドの変化に合わせて表示される方向矢印は、売買の好機を強調します。 統合されたダッシュボードには、現在のシグナル、市場のバイアス(傾向)、モメンタム、ボラティリティ、シグナルの品質がひと目で分かるようにまとめられています。これにより、トレーダーはパネルを切り替えることなく、価格変動(プライスアクション)とインジケーターの数値を照らし合わせて分析を行うことができます。 すっきりとしたチャート表示と簡潔な市場概要により、Tokyo Indicatorはトレンド分析や取引判断における体系的なアプローチをサポートします。 あらゆる時間足や銘柄に対応しており、特に金(ゴールド)の取引に適しています。 トレンド スキャナーの強力なサポートを利用して、無料のインジケーターを入手し、プライバシーを守ります。あーみー!     設定 ShowHUD - チャート上のパネ
SR Liquidity は、市場の流動性が集中し、価格が最も強く反応する「隠れたゾーン」を可視化するために設計されたトレーディング指標です。こうした流動性の高いエリアは強力なサポート(支持)およびレジスタンス(抵抗)レベルとして機能し、市場が反転する可能性が最も高いポイントを明確に示してくれます。 単なる一般的なサポートラインやレジスタンスラインを描画するのではなく、「SR Liquidity」は実際の価格変動を分析し、売りと買いの圧力が集中するゾーンを特定します。これらは、市場の真の動きを牽引する「流動性のプール(溜まり場)」そのものです。それらをチャート上に直接可視化することで、価格が実際に反応する前に、その動きを予測することが可能になります。つまり、このインジケーターは価格の方向性が変わる可能性を予測するのです。生のプライスアクションを、市場の重要な水準(転換点となり得るポイント)を示す、明確で実用的なロードマップへと変換してくれます。 このインジケーターは、FX、株価指数、貴金属、仮想通貨など、あらゆる銘柄や時間足で使用可能です。 ご購入後、取引手順や無料の優れた追加インジケ
ゴールドラッシュ・トレンド・アロー・シグナル ゴールドラッシュ・トレンド・アロー・シグナル 指標は、XAU/USDにおける高速・短期スキャルパー向けに最適化された、正確でリアルタイムのトレンド分析を提供します。 1分足専用に設計されたこのツールは、明確なエントリーポイントを示す方向矢印を表示し、スキャルパーが変動の激しい市場状況でも自信を持って取引できるよう支援します。 この指標は、PRIMARY(主要)とSECONDARY(補助)のアラート矢印で構成されています。PRIMARYシグナルは、トレンドの方向転換を示す白と黒の方向矢印であり、SECONDARYシグナルは、PRIMARY矢印が示す方向を確認し、潜在的なエントリーポイントを示す青と赤の矢印です。 注意:トレンド方向の変化後にPRIMARYアラート矢印が1つだけ表示される場合、複数のSECONDARY青/赤矢印が表示される点に注意が必要です。SECONDARYシグナルは、シグナル基準を満たす任意のローソク足後に表示されます。したがって、長期的なトレンド移動の場合、画面に多くのSECONDARY矢印が表示されます(添付の
Atomic Analyst — MetaTrader 4 製品に関するご質問、設定方法、技術サポートについては、MQL5で直接メッセージをお送りください。 このインジケーターは、複雑な市場計算をシンプルな視覚シグナル、色分けされたローソク足、トレンド表示、ストップロスレベル、複数のテイクプロフィットゾーンに変換し、トレーダーが素早く理解して実際の市場環境で使用できるようにします。 主な取引用途: スキャルピングとイントラデイトレード: 素早い判断、明確な矢印、アラート、ローソク足カラー、構造化されたエントリー/エグジットゾーンのために設計されています。 デイトレードとスイングトレード: トレンド方向、強さ、モメンタム、マルチタイムフレーム分析を使って、より大きな市場の動きを追うのに役立ちます。 主な機能: • Price Action、強さ、モメンタム分析 • マルチタイムフレームトレンドスキャナー • 全体トレンド率の計算 • 買いと売りの矢印 • ストップロスと複数のテイクプロフィットレベル • 最大5つのフィボナッチベースのテイクプロフィットレベル • トレーリングストップ
M1 Sniper
Oleg Rodin
4.97 (30)
M1 SNIPER は使いやすいトレーディングインジケーターシステムです。M1時間足向けに設計された矢印インジケーターです。M1時間足でのスキャルピングのためのスタンドアロンシステムとして、また既存のトレーディングシステムの一部としても使用できます。このトレーディングシステムはM1時間足での取引に特化して設計されていますが、他の時間足でも使用できます。元々、この手法はXAUUSDとBTCUSDの取引用に設計しましたが、他の市場においても役立つと考えています。 インジケーターのシグナルは、トレンドの方向と逆方向に取引できます。インジケーターのシグナルを利用して両方向に取引するのに役立つ特別な取引テクニックをご紹介します。この手法は、特別な動的なサポートとレジスタンスの価格帯を利用することに基づいています。 ご購入後、M1 SNIPER矢印インジケーターをすぐにダウンロードできます。さらに、M1 SNIPERツールのすべてのユーザーに、以下のスクリーンショットに表示されているApollo Dynamic SRインジケーターを無料で提供しています。この2つのインジケーターを組み合わせることで
Smart Trend Trading System は、トレンド情報、エントリー・決済シグナル、価格水準をひとつのチャートにまとめて表示する MetaTrader 4 用インジケーターです。 このシステムは、トレンド検出、反転ゾーン、Smart Cloud、トレーリングストップロジック、サポートとレジスタンス、ローソク足の色分け、アラート、マルチタイムフレーム分析など、 10 種類以上のトレーディングツール を 1 つに統合しています。 このシステムは、さまざまな市場環境での取引をサポートするように設計されています。 トレンド相場: 主要トレンドを特定し、押し目を検出し、モメンタムに従い、ストップロスガイドとトレーリングストップオプションを使って、より明確なエントリーを見つけます。 レンジ相場: レンジ状態を検出し、反応ゾーンを特定し、価格が重要なレベルから反応したときに、より明確なシグナルを受け取ります。 スキャルピングとデイトレード: 短期売買の判断をサポートするために、高速シグナル、ローソク足の色、アラート、マルチタイムフレーム確認を使用します。 主な機能: • 10 種
Miraculous Indicator Binary & Forex v3 StrategySafe Miraculous Indicator Binary & Forex v3 StrategySafe は、明確なシグナル、強力な確認ツール、そして Binary と Forex 市場で使える体系的な取引アプローチを求めるトレーダー向けのプロフェッショナル指標です。 v3 では、MIR Dashboard、Miraculous Confirmation Dashboard、GANN Law、Square of 9 レベル、GANN 角度、そしてより高度な Forex モードが搭載されています。 主な特徴 Binary と Forex の両方に対応。 MIR Dashboard による素早い市場分析。 Miraculous Confirmation Dashboard によるエントリー確認。 Forex 分析用の GANN Law drawing lines。 Square of 9 のライン、レベル、方向表示。 1x1 GANN Angle によるトレンド圧力の確認。 Entry I
Liquidity Scalper System: インジケーター形式の流動性ベースのトレーディングシステムです。 多くのインジケーターは矢印を表示するだけで、ストップをどこに置くか、目標はどこか、そのシグナルを信頼してよいかはトレーダー自身が判断しなければなりません。Liquidity Scalper System はトレードの全サイクルをカバーします。流動性プールを見つけ、そのブレイク時にシグナルを出し、Entry、Stop Loss、3つのターゲットを即座に計算し、パネルに統計と新しいデータでの検証結果を表示します。設定はシステムが自動で選び、毎日更新します。 仕組み 1. システムが流動性プールを見つけます。市場参加者のストップ注文が集まっている価格水準です。 2. 価格がプールをブレイクし、そのブレイクが値動きの強さ(必要に応じて出来高)で確認されると、チャートに BUY または SELL の矢印が表示されます。 3. Entry、Stop Loss、TP1、TP2、TP3 の水準がゾーンの塗りつぶしとともに即座に描画されます。 4. 右側に流動性プロファイルが表示され、価
PRO Renko Systemは、特別にRENKOチャートを取引するために設計された高精度の取引システムです。 これは、様々な取引商品に適用することができる普遍的なシステムです。 システムは効果的に正確な逆転信号へのアクセスを与えるいわゆる市場の騒音を中和する。 表示器は非常に使いやすく、信号の生成に責任がある1つの変数だけがあります。 あなたは簡単にお好みの任意の取引ツールとレンコバーのサイズにツールを適応させることができます。 私はいつもあなたが私のソフトウェアで収益性の高い取引を支援するために余分なサポートを提供する準備ができています! 私はあなたに幸せで収益性の高い取引をしたいです! ご購入後にご連絡ください! 私はあなたに私のレンコチャートジェネレータを送信します。 私はまた、私の個人的な推奨事項やシステムの他のモジュールを無料で共有します!
Top Bottom Tracker は、洗練されたアルゴリズムに基づき、市場のトレンドを分析し、トレンドの高値と安値を検出することができるインジケーターです / MT5バージョン 。 価格は500$に達するまで徐々に上昇します。次の価格 --> $99 特徴 リペイントなし このインジケーターは 新しいデータが到着してもその値を変更しません 取引ペア すべてのFXペア 時間枠 すべての時間枠 パラメーター ==== インジケータの設定 設定パラメータ // 40 (値が高いほど、シグナルは少なくなりますが、より正確です) 上レベル値 // 80 (上水平線の値) 下限値 // 20 (下限水平線の値) インジケータ計算バー // 3000 (何本分のインジケータを計算するか。0を指定すると、全てのバーに対してインジケータを計算します) ==== アラーム設定 ポップアップアラート // true (端末にアラームを表示) メールアラート // true (アラームをメールで通知) アラート時間間隔 // 10 (アラーム間隔 (分)) 警告
Neuro Poseidon is a new indicator by Daria Rezueva. It combines precise trading signals with adaptive TP/SL levels - creating best possible trades as a result! Message me and get  Neuro Poseidon Assistant  as a gift to automize your trading process! What makes it stand out? 1. Proven profitability on all assets and timeframes 2. Only confirmed BUY and SELL signals present on the chart 3. Adaptive TP & SL levels generated by the software for each trade 4. Easy to understand - suitable for all
Elliott Wave Trend was designed for the scientific wave counting. This tool focuses to get rid of the vagueness of the classic Elliott Wave Counting using the guideline from the template and pattern approach. In doing so, firstly Elliott Wave Trend offers the template for your wave counting. Secondly, it offers Wave Structural Score to assist to identify accurate wave formation. It offers both impulse wave Structural Score and corrective wave Structure Score. Structural Score is the rating to sh
Gann Made Easy は、ミスター・ギャンの理論を使用した取引の最良の原則に基づいた、プロフェッショナルで使いやすい外国為替取引システムです。 W・D・ガン。このインジケーターは、ストップロスとテイクプロフィットレベルを含む正確な買いと売りのシグナルを提供します。 PUSH通知を利用して外出先でも取引可能です。 ご購入後、取引方法の説明と優れた追加インジケーターを無料で入手するには、私にご連絡ください! おそらく、ギャンの取引手法についてはすでに何度も聞いたことがあるでしょう。通常、ギャンの理論は初心者のトレーダーだけでなく、すでにある程度の取引経験がある人にとっても非常に複雑なものです。なぜなら、ギャンの取引手法は理論的にはそれほど簡単に適用できるものではないからです。私はその知識を磨き、最良の原則を私の外国為替インジケーターに組み込むために数年を費やしました。 このインジケーターは非常に簡単に適用できます。必要なのは、それをチャートに添付し、簡単な取引推奨事項に従うだけです。このインジケーターは常に市場分析の仕事を行い、取引の機会を探します。適切なエントリーポイントを検出す
発見が困難で頻度が少ないため、分岐は最も信頼できる取引シナリオの1つです。このインジケーターは、お気に入りのオシレーターを使用して、通常の隠れた分岐点を自動的に見つけてスキャンします。 [ インストールガイド | 更新ガイド | トラブルシューティング | よくある質問 | すべての製品 ] 取引が簡単 通常の隠れた発散を見つけます 多くのよく知られている発振器をサポート ブレイクアウトに基づいて取引シグナルを実装します 適切なストップロスおよび利益レベルを表示します 設定可能なオシレーターパラメーター カスタマイズ可能な色とサイズ バー単位でサイズ別に分岐をフィルタリング パフォーマンス統計を実装します 電子メール/音声/視覚アラートを実装します 幅広い市場の見通しを提供するために、異なるオシレーターを使用して、干渉なしで同じチャートにインジケーターを何度もロードできます。このインジケーターは、次のオシレーターをサポートしています。 RSI CCI MACD オスマ 確率的 勢い 素晴らしい発振器 加速器発振器 ウィリアムズパーセントレンジ 相対活力指数 特に外国為替市場では、
現在40%オフ 初心者やエキスパートトレーダーに最適なソリューション! このインジケーターは、独自の機能と新しい計算式を取り入れた、ユニークで高品質、かつ手頃な価格のトレーディングツールです。たった1枚のチャートで28の為替ペアの通貨強度を読み取ることができます。新しいトレンドやスキャルピングチャンスの引き金となるポイントを正確に特定することができるので、あなたのトレードがどのように改善されるか想像してみてください。 ユーザーマニュアルはこちら  https://www.mql5.com/en/blogs/post/697384 これが最初の1本、オリジナルだ! 価値のないクローンを買わないでください。 特別な サブウィンドウの矢印で強い通貨の勢いを表示 GAPがあなたのトレードを導く! 基準通貨や気配値が売られすぎ・買われすぎのゾーン(外相フィボナッチレベル)にあるとき、個別チャートのメインウィンドウに警告表示。 通貨がレンジの外側から反落した場合、プルバック/リバーサルのアラート。 クロスパターンの特別なアラート 複数の時間枠を選択可能で、トレンドを素早く確認できます
フィボナッチ・トレンド・マーカー (Fibonacci Trend Marker) は、現在のローソク足が過去のローソク足の高値-安値(High-Low、HL)範囲に対してどのように振る舞うかを、フィボナッチ・リトレースメントレベルを用いて分析するトレンド指標です。トレンドの強さを視覚的に追跡し、ローソク足の色の変化を通じてトレンドの弱まりや反転の可能性を示します。 特徴: トレンド重視のトレーダーのために設計されており、フィボナッチレベルに基づいてトレンドの変化を素早く検出します。 市場のボラティリティが十分で、3~5本のローソク足が明確な動きを形成する場合、あらゆる時間枠で有効です。 ローソク足のサイズはチャートのスケールに自動的に適応し、ズーム時にも正確な表示を保証します。 現在のローソク足をリアルタイムで分析することでトレンド変化に高い感度を持ち、M1やM5の時間枠でのスキャルピングに最適です。 取引方法: エントリー: 前の閉じたローソク足の色が変化した後にポジションを開きます。例えば、赤いローソク足の後に青で閉じた場合、上昇トレンドのシグナルとなり、買い(Buy)の取引
現在30%OFF! このダッシュボードは、複数のシンボルと最大9つのタイムフレームで動作するソフトウェアの非常に強力な部分です。 このソフトは、弊社のメインインジケーター(ベストレビュー:Advanced Supply Demand)をベースにしています。    Advanced Supply Demand ダッシュボードは、素晴らしい概要を提供します。それは示しています。  ゾーン強度評価を含むフィルタリングされた需給値。 ゾーン内/ゾーンへのPips距離。 ネストされたゾーンがハイライトされます。 選択されたシンボルの4種類のアラートを全ての(9)時間枠で提供します。 それはあなたの個人的なニーズに合わせて高度に設定可能です。 あなたの利益! すべてのトレーダーにとって最も重要な質問です。 市場に参入するのに最適なレベルはどこか? 成功のチャンスとリスク/リターンを得るために、強力な供給/需要ゾーン内またはその近くで取引を開始します。 損切りの最適な位置はどこですか? 最も安全なのは、強力な供給/需要ゾーンの下/上にストップを置くことです。 最適な利益
M1 Arrow
Oleg Rodin
4.81 (21)
M1 Arrowは、ボラティリティとボリューム分析を含む市場の自然な取引原理に基づいたインジケーターです。このインジケーターは、あらゆる時間枠と通貨ペアで使用できます。インジケーターに搭載された使いやすいパラメーター1つで、取引したい通貨ペアと時間枠に合わせてシグナルを調整できます。 買いと売りのシグナルに基づくメインアルゴリズムに加え、入力欄で選択できる複数の追加戦略も内蔵されています。これらの戦略は設定不要で、インジケーターで選択した戦略モードに基づいて自動的に設定されます。 アルゴリズムは、追加フィルターを用いたボリュームと価格波動の分析に基づいています。このインテリジェントなアルゴリズムは、2つの市場要因が1つに組み合わさった場合にのみシグナルを発します。インジケーターは一定範囲の波動を計算し、ボリューム分析を用いて波動を確認します。 ご購入後、私の取引ヒントと素晴らしいボーナスインジケーターを無料で入手するには、ご連絡ください!
DayTrader PRO MT5:  https://www.mql5.com/en/market/product/186222 DayTrader PROは、ジョン・エリュース(John Ehlers)のラグuerreフィルターと強力な自動最適化エンジンを組み合わせた、高度なトレーディング・インジケーターです。固定されたパラメーターを使用するのではなく、直近の市場状況に基づいて最適な設定を自動的に検索するため、手動による絶え間ない調整をすることなく、変化する市場のボラティリティに適応できます。 本インジケーターは、明確な「買い(BUY)」および「売り(SELL)」シグナルを生成し、現在の市場ボラティリティから算出された適応型のストップロス(Stop Loss)およびテイクプロフィット(Take Profit)レベルを表示します。トレンド、効率レシオ(Efficiency Ratio)、ボラティリティ、およびローソク足フィルターが内蔵されており、精度の低いセットアップを排除し、シグナルの精度を向上させます。 リアルタイム・パフォーマンスパネルには、現在最適化されている設定、プロフィッ
KURAMA GOLD SIGNAL PRO MT4版 ゴールドのサインに、目で見えるトレード計画を。 ゴールドのサインが出た。利確はどこか。損切りはどこか。エントリー前に何を確認すべきか。 KURAMA GOLD SIGNAL PROは、その判断材料をチャートに集約します。XAUUSDのM5、M15向けに、売買サイン、自動計算TP/SL、3段階のサイン評価、注意すべき相場条件を知らせるMARKETパネルを搭載。 セットアップ、決済目安、相場の注意点を一か所で確認。情報を集める手間を減らし、トレードの判断に集中できます。 買い切り購入者限定特典 AI Zone Radar MT5版と完全PDFマニュアルを無料プレゼント。 ご購入後にMQL5でメッセージをお送りください。買い切り購入が対象です。レンタルは対象外です。 AI Zone Radarを見る サインから、具体的なトレード計画へ SMA 13、21、75、100へのタッチを使ったセットアップを検出。各サインに売買方向と対象MAを表示するため、浅い押し目、戻りと深い調整を区別して確認できます。 チャートとパネルには、次の情報を表示し
このインジケータは、30を超える日本のローソク足パターンを認識し、チャート上でそれらを美しく強調します。それは、価格行動トレーダーがなしでは生きていけない指標の1つにすぎません。 一晩でテクニカル分析を強化 日本のローソク足パターンを簡単に検出 信頼できる普遍的な反転パターンを取引する 継続パターンを使用して、確立されたトレンドに安全に飛び乗る インジケーターは再描画されず、アラートを実装します インジケーターは、マルチタイムフレーム ダッシュボードを 実装します チャートが非常に多くのパターンを検出するため、チャートが非常に乱雑に見え、読みにくくなります。トレーダーは、チャートをより読みやすくするために、インディケーター入力から望ましくないパターンを無効にする必要があるかもしれません。 1小節、2小節、3小節、および多小節のパターンを検出します 反転、継続、および脆弱性のパターンを検出します パターンは有効または無効にできます 強気のパターンは 青 、弱気のパターンは 赤 、中立のパターンは 灰色で ラベル付けされてい ます 。 検出されたローソク足パターンのリスト 1バーから5
Break and Retest Hunter MT4 is a powerful MetaTrader 5 indicator designed to automatically identify support and resistance levels, breakout structures, and potential retest opportunities in real time. Bonus Indicator: After purchasing Break and Retest Hunter , contact me to receive Trade Indicator Assistant EA completely free as a bonus utility. $65 for the next 10 copies . Next price is $120.  Combining adaptive market analysis, clear BUY/SELL signals, Fibonacci-based profit targets, and a pre
This is a professional chart indicator designed for traders focused on stability and clear price action. It helps filter market noise and provides clear visual entry and exit zones for your trading decisions. Core Features: Strictly Non-Repainting: The system is built with strict non-repaint logic. What you see on the chart is the true historical performance. Confirmed Signals: Signals are triggered and confirmed only after the candle closes . Once a trading arrow appears on a closed candle, it
Quantum Naked SMC Prime is a streamlined Smart Money Concepts indicator designed for traders who prefer a clean chart, structured market analysis and clear visual trade setups without unnecessary complexity. The indicator combines market structure, liquidity behavior, institutional zones and confirmation logic into a compact analytical framework. Instead of flooding the chart with technical indicators, Quantum Naked SMC Prime focuses on the core elements of price action and Smart Money Concepts
Forex Breath System は、あらゆる市場で使用できるトレンドベースの取引システムです。このシステムは、通貨、金属、商品、指数、仮想通貨、さらには株式でも使用できます。任意の時間枠でも使用できます。システムは普遍的です。トレンドを示し、トレンドに伴う矢印シグナルを提供します。このインジケーターは、シグナルがトレンドの方向に現れたときに特別なタイプのアラートを提供することもできるため、トレンド取引が簡単になります。 このインジケーターは、理解しにくい設定に対処する必要がないため、非常に使いやすいです。 チャートに添付するだけで取引の準備が完了します。どのような取引スタイルを好む場合でも、このシステムは市場の方向性とトレンド方向への可能なエントリーポイントを確認するのに役立ちます。 このインジケーターは、PUSH 通知を含むあらゆる種類のアラートを提供します。 取引手順と素晴らしいボーナスを入手するには、購入後に私にご連絡ください。 幸せで収益性の高い取引をお祈りします!
Prop Firm Sniper MT4  is a professional market structure indicator that automatically identifies high-probability BUY and SELL opportunities using BOS and CHoCH analysis. Recommended Timeframes: For backtesting, use the indicator on   M5 or M15   for Gold (XAUUSD), and   M15 or H1   for more volatile Forex pairs such as   GBPUSD, USDJPY, EURGBP , and similar markets. CONTACT ME AFTER PURCHASE TO CLAIM YOUR FREE BONUSES! Prop Firm Sniper  is a professional market structure indicator designed t
PZ Wedges
PZ TRADING SLU
3 (2)
このインディケーターは ウェッジを 見つけます。 ウェッジ は、価格統合期間を囲む収束トレンドラインによって識別される継続パターンです。フォーメーションブレイクアウトと一緒にドンチャンブレイクアウトを使用してトレードを通知します。 [ インストールガイド | 更新ガイド | トラブルシューティング | よくある質問 | すべての製品 ] 使いやすい カスタマイズ可能な色とサイズ ブレイクアウト信号を実装します あらゆる種類のアラートを実装します 最適な使用法 オーバーラップする可能性があるすべてのサイズのウェッジを表示するには、異なるサイズ(6、12、18、24など)でインジケーターをチャートに数回ロードします。 入力パラメータ サイズ:検出されるパターンのサイズ。代替ポイント間のバーとして表されます ブレイクアウト期間:取引を通知するドンチャン期間 最大履歴バー:チャートで調べる過去のバーの量 強気パターンの色:このパラメーターは一目瞭然です 弱気パターンの色:このパラメーターは一目瞭然です 切れ目のないパターンの色:このパラメーターは一目瞭然です 線幅:パターン線のサイズ 強
Matrix Arrow Indicator MT4
Juvenille Emperor Limited
5 (3)
マトリックスアローインジケーターMT4は、すべてのシンボル/商品(外国為替、商品、暗号通貨、インデックス、株式)で使用できる100%再描画されていないマルチタイムフレームインジケーターに続くユニークな10in1トレンドです。マトリックスアローインジケーターMT4は、初期段階で現在のトレンドを判断し、最大10の標準インジケーターから情報とデータを収集します。 平均方向移動指数(ADX) 商品チャネルインデックス(CCI) クラシック平研アシキャンドル 移動平均 移動平均収束発散(MACD) 相対活力指数(RVI) 相対力指数(RSI) 放物線SAR ストキャスティクス ウィリアムズのパーセント範囲 すべてのインジケーターが有効な買いまたは売りシグナルを与えると、対応する矢印がチャートに印刷され、次のろうそく/バーの開始時に強い上昇トレンド/下降トレンドを示します。ユーザーは、使用するインジケーターを選択し、各インジケーターのパラメーターを個別に調整できます。マトリックスアローインジケーターMT4は選択されたインディケーターからのみ情報を収集し、それらのデータのみに基づいてアローを印刷
ボリューム ブレイク オシレーターは、オシレーターの形で価格変動とボリューム トレンドを一致させるインジケーターです。 私はボリューム分析を戦略に統合したいと思っていましたが、OBV、マネー フロー インデックス、A/D、ボリューム加重 Macd など、ほとんどのボリューム インジケーターにいつもがっかりしていました。 そのため、このインジケーターを自分で作成し、その有用性に満足したので、市場に公開することにしました。 主な機能: ボリュームの増加 (ブレイク) によってサポートされる方向に価格が動くフェーズを強調します。 ボリュームの増加が止まり、市場が縮小するフェーズを強調します。 特に時間枠 (<=15 分) のデイトレードでは、価格もボリュームも動かないため、市場が将来の動きに備えられるフェーズを強調します。 ボリュームの増加によってサポートされていない場合、他のエキスパート アドバイザーからの誤ったシグナルをフィルターします。 トレンドとレンジ フェーズを非常に簡単に視覚化できます 入力パラメーター: 計算設定: 計算タイプ: FAST、NORMAL、SLOW。同じ
作者のその他のプロダクト
インディケータは、最も可能性の高いトレンドストップ/反転エリア、自信のあるトレンド移動エリアを計算します。 計算では次のことが考慮されます。 価格変動率; チャートの相対偏差角度。 価格変動の平均振幅。 その「コンフォートゾーン」を離れる価格。 ATRインジケーターの値。 インジケーターは、価格がストップ/リバーサルエリアに入るとアラートを生成できます。 設定 全長を描きますか? -チャートの最後まで領域を描画します。 Show StopUP-trend-上昇トレンドのストップ/反転エリアを表示します。 上昇トレンドを表示-自信を持って上昇トレンドの領域を表示します。 下降トレンドを表示-自信を持って下降トレンドの領域を表示します。 Show StopDOWN-trend-下降トレンドのストップ/反転エリアを表示します。 エリア変更のアラート-価格がトレンドストップ/変更エリアに入ったときにアラートを生成します。 次は、各商圏の色設定です。
フラットとトレンドを決定するための指標。 価格が2つのヒストグラムと2つの線(赤と青)のいずれかを下回っている場合、これは売りゾーンです。 このバージョンのインジケーターを購入するときは、1つの実際のアカウントと1つのデモアカウント用のMT4バージョン-ギフトとして(受け取るには、プライベートメッセージを書いてください)! 価格が2つのヒストグラムと2つの線(赤と青)のいずれかを上回っている場合、これは購入ゾーンです。 MT4バージョン: https//www.mql5.com/en/market/product/3793 価格が2つの線の間、またはいずれかのヒストグラムのゾーンにある場合、市場に明確な傾向はありません。簡単に言えば、市場は横ばいです。 インジケーターの動作は、スクリーンショットでより明確に示されています。
SuperTrend
Evgeniy Zhdan
2.5 (2)
The Supertrend Expert Advisor The Supertrend Expert Advisor with averaging elements. It has been developed during three months until I finally got good results. It is not a scalper. The minimum balance to start trading - 100 $. Is automatically adjusted to the 4 and 5-digit prices. Has an efficient risk management system. The lot and limit on the maximum lot is automatically calculated based on the settings specified in the EA. As a result, you have a complete automated trading system. Download
StarDust searches for divergences in the values of several indicators considering them as signs of flat and enters the market if a relatively steady trend is detected. The Expert Advisor trades "basic" symbols with a low spread. The best results are achieved on М15. The EA automatically adjusts to 4 and 5-digit quote flows. Settings Comment_to_orders – comment to a placed order. The field can be left blank if no comment is required. MM – enable money management with automatic setting of a worki
The EA catches the price when it moves against the trend in an effort to open an order in an opposite direction (direction of the main trend). Screenshots illustrate examples of entries and the strategy gist. The EA uses stop losses depending on values of ATR. Settings: Lot_ - if Risk_ = 0, the EA will trade this lot; Risk_ - risk per one trade. Stop loss is taken into account; koeff_ATR - coefficient multiplied by the ATR value to calculate stop loss (the bigger the value, the bigger stop loss
The FastBoom EA finds the most probable points of price pullback/reverse and places an order. It places averaging orders if the price moves further against take profit. Settings of the EA: Lots - initial lot; LotExponent - multiplier for following orders (Martingale). 1 - no multiplier. TakeProfit - take profit in points; Stochastic Settings InpKPeriod - K Period of Stochastic InpDPeriod - D Period of Stochastic InpSlowing - Stochastic Slowing LevHigh - level for sell positions of Stochastic L
The Expert Advisor calculates the double/triple divergence of volumes, and starts trading. It uses a unique formula of lot calculation, which greatly improves stability of trading. Recommended TF - 1h. Currency pair - EURUSD , but the EA can be used on any trading instruments which are not subject to high volatility. Settings mode - trading direction can be set manually; close - order close level (details on the screenshot); Step between orders - step between orders in points; Maximum orders -
The Expert Advisor opens orders from the horizontal line, the a trader can set on any level by dragging using the mouse or by changing the line properties. For example, when a horizontal line is above the current price, the EA will open a Buy order once the horizontal line is reached. And vice versa: If the line is below the current price, the EA will open a sell order once the line is crossed. A buy crossover of the line is: opening of the current candlestick below the horizontal line; the curr
SellerATR
Evgeniy Zhdan
5 (1)
The Expert Advisor only sells. Recommended currency pairs : EURUSD; GBPUSD; USDCHF; USDJPY; USDCAD; AUDUSD; EURGBP; EURAUD; EURCHF; EURJPY; GBPCHF; CADJPY; GBPJPY; AUDNZD; AUDCAD; AUDCHF; AUDJPY; CHFJPY; EURNZD; EURCAD; CADCHF; NZDJPY; NZDUSD. Timeframe: H1. Percent% manages closing both loss-making and profitable deals based on the account overall status. Using the EA on 23 symbols mentioned above allows the robot to cope with the drawdown in case of a long trend. While positions on some pairs
Illusion
Evgeniy Zhdan
3 (2)
The Illusion EA uses the probability theory - after a series of consecutive virtual losses - i.e. right during a flat the EA already starts trading in the trend. In addition, the EA considers the ratio of bullish/bearish candles on the higher timeframes to determine the greatest probability of the price movement direction. Only 1 order can be opened at a time. In case of a loss the following order will be placed with an increased lot (the multiplication coefficient is set in the parameters). The
The indicator plots a trend line and determines the levels for opening trades, in case the price goes "too far" away from the trend level. More detailed information is available in the screenshots. Settings Away from the trend line - distance from the trend line to the trades level; Arrow Signal for deals - enable displaying an arrow when the price reaches the trades level; Size of Arrow - size of the arrow; Alert Signal for deals - enable generating alerts when the price reaches the trades lev
Turbina
Evgeniy Zhdan
5 (4)
The axiom of the Forex market is that any trend will be broken. The Expert Advisor determines trend direction (the pink line), and calculates levels for opening opposite orders depending on the settings. The value of Away from the trend line for Deal will be different for each pair and timeframe, depending on the volatility of the trading instrument. Next orders can be opened with an increased lot (a static lot is used by default). See the screenshots to understand the idea of the Expert Advisor
The Expert Advisor determines the moments of strong movements and opens a position in the direction of the most probable price movement. The strategy always uses stop loss and take profit. Several independent orders can be in the market (the maximum number is set in parameters). The goal of the EA's underlying trading system is the quantitative excess of the number of profitable deals over the number of losing ones. Recommended: EURUSD 5m; GBPUSD 5m; USDJPY 5m. The Expert Advisor is able to work
Vise is a trend indicator. The upper and lower lines follow the price showing the prevailing price direction. Frequent breakthroughs of the upper line indicate a bullish trend, while frequent breakthroughs of the lower line indicate a bearish one. Parameters Points for UpLine - initial number of points for the upper line; Points for DownLine - initial number of points for the lower line. During the breakthrough of the upper level (line), this level shifts upwards by Points for UpLine. If the up
Twinkle is a trend-based scalper using stop loss and take profit invisible to the broker. The EA does not look for trend reversals. The EA catches strong market movements and opens orders in the direction of the trend. Your broker will not see the order closing levels. The EA closes orders independently when reaching the take profit or stop loss levels specified in the settings. Recommended trading symbols: EURUSD M5, GBPUSD M5. ECN accounts with 5 digits quotes are recommended. Expert Advisor
Shine
Evgeniy Zhdan
4.75 (4)
This Expert Advisor implements elements of the Martingale system. Orders are opened at a specified distance from the moving average. The Parabolic SAR indicator and certain technical details are used to ensure the most accurate entries. The EA is highly customizable. It is recommended for simultaneous use on 4 currency pairs: EURUSD M15; GBPUSD M15; USDJPY M15; USDCAD M15. Despite good stability, it is advisable to disable the EA operation during the days rich in news releases. Configurations P
LuckyCase is an Expert Advisor with martingale elements. The EA strategy is based on a significant "deviation" of the price from SAR inadicator and the Bands levels breakthrough point. The money management system is an essential part of the EA. It starts working after a trade is opened. Trades are closed after accumulating specified points of market orders, by deposit % or after an opposite side of the channel is broken through. The default EA settings are meant for: EURUSD M15; USDJPY M15. The
The Elize Expert Advisor has been designed to work with the EURCHF currency pair. It considers the peculiarities of this trading instrument, its behavior and dependence on the behavior of other currencies. In particular, when the currencies of the European countries (EURUSD, GBPUSD, EURNOK, EURCHF) move in the same direction, the EA starts its operation and opens a deal in the trend direction of the European currencies. In the event of price rollbacks, the EA uses a unique method for making the
Brief Description of the All Trend Lines Indicator The indicator analyzes the wave structure of the market. What it displays on the chart: First. Wave pivots (semaphores) • Red markers – wave highs • Yellow markers – wave lows • Yellow-green markers – additional local extremes Second. Trend lines • Purple/blue lines – trends based on highs (resistance/support) • Beige/green lines – trends based on lows • Lines are built automatically by connecting wave pivots of the same type Third. Main trend
The Expert Advisor has been specifically developed for trading gold (Spot Gold). The strategy is based on Fibo levels calculated from the previous (first) candle High/Low and the width of the current and lower timeframes channel. If important Fibo levels of different orders are located in a single price channel (within a spread), the EA defines this channel as the target for price movement and starts operation. Martingale and averaging are not used. Each order is independent and is accompanied b
The algorithm of this Expert Advisor determines the significant price levels, where the trend often turns into a flat or reverses. Stochastic Oscillator serves as an additional filter of overbought/oversold zones. The EA sets stop loss and take profit after opening an order. The underlying trailing strategy applies a trailing stop. The EA is recommended for simultaneously use on three trading instruments: EURUSD M5, GBPUSD M5, EURCHF M5. Settings: Comment to order - comment to orders. MaxRisk -
The Expert Advisor looks for technical analysis patterns formed on the higher (hourly) timeframe to start working on the 5-minute chart. Technical analysis patterns used: double top/double bottom, head/shoulders, flag, expanding/narrowing triangles. The Relative Vigor Index technical indicator is used as the filter for opening deals. It is based on the idea that on the bull market the closing price is, as a rule, higher, than the opening price. It is the other way round on the bear market. This
The Expert Advisor calculates the divergence on the current and higher timeframes. In case the divergences coincide, the EA starts its operation. Deals have strict take profit and stop loss levels. Each deal is managed by trailing stop. The strategy involves the use of a tight stop-loss. Therefore, losing deals and/or series of losing deals are not uncommon. This EA is not suitable for those who have difficulties coping with losing deals. The EA is recommended for simultaneous use on the followi
The Expert Advisor has been developed specifically for the features of the CHFJPY currency pair. The EA's algorithm determines the direction of the current trend and starts operation. In case of a price reversal within the current trend, the EA adds additional orders. If trend changes, the EA starts to work in the direction contrary to the initial grid of orders. If there were no conditions for closing orders and the trend direction changed again, the EA continues to work with the "first" grid o
The Expert Advisor algorithm determines on daily charts those candlestick patterns, which set the intraday trading direction. The trading EA determines how long the price is moving in overbought/oversold zones and starts working in the direction of the expected trend movement. Each position is accompanied with a tight stop loss and take profit. Only one active position can be open in the market. The EA was developed and tested using 99% quality quotes. The Expert Advisor has a built-in news filt
The strategy of this Expert Advisor is based on a hedging system, which implies placing opposite orders. The EA algorithm determines trend beginning and opens a position in the trend direction. In case of a wrong entry, the EA tries to neutralize the drawdown through opposite (hedging) orders at a preset interval (Coefficient of counter orders). Orders are closed when one of the two values ​​is reached - profit in percent or profit in points. The EA does not use lot increase. The EA wast tested
Советник работает по принципу хеджирования с периодическими "перекосами" в сторону трендовых направлений. Направления тренда советник определяет на основании стандартного индикатора Parabolic Stop and Reverse system (SAR). Уникальная стратегия установки балансирующих позиций позволяет избегать больших просадок даже при самых не благоприятных рыночных условиях. Параметры по умолчанию рекомендуется использовать на торговом инструменте: GBPJPY 15m. Разработка и оптимизация параметров производились
Snoot
Evgeniy Zhdan
5 (1)
This Expert Advisor works using a grid in the direction of a trend movement with the step between opened positions defined in the settings. The positions are closed by the total take profit. The Parabolic SAR standard indicator is used to filter order opening, which comes in the MetaTrader 4 package. The EA has been developed and tested using 99,9% quality of quotes. Operation of the EA in real time can be viewed in the signals . The best trading results have been achieved on CHFJPY M15. Settin
The Expert Advisor builds channels based on the data obtained using ATR and MA indicators according to the equations: Upper channel border = MA + ATR * (FIBO); Lower channel border = MA - ATR * (FIBO), where FIBO has the following values: Style of Trade - Aggressive = 1.61852; Style of Trade - Average = 3.26704; Style of Trade - Calm = 4.85556. Trades are opened inside the channel with the intervals defined in the settings. Long and short positions are opened independently. Positions are closed
The trading statistics indicator notifies the trader of the aggregate income of the trading account for different time intervals. The indicator has wide display settings on the graph. There is a choice of one of the two display languages on the chart- English and Russian. Settings Indicator language (ENG, RUS) - Select the language to display on the chart; To control the magic (-1: any magic) - Entering the Magic for control (-1: any Magic); Angle of indicator tie - Selecting the angle of the c
フィルタ:
レビューなし
レビューに返信