 MetaTrader 5
 Experts
 Indicadores
 Bibliotecas
 Utilitários
 Widgets
 Regras
Conheça o Mercado MQL5 no YouTube, assista aos vídeos tutoriais
Como comprar um robô de negociação ou indicador?
Execute seu EA na
hospedagem virtual
hospedagem virtual
Teste indicadores/robôs de negociação antes de comprá-los
Quer ganhar dinheiro no Mercado?
Como apresentar um produto para o consumidor final?
Indicadores Técnicos para MetaTrader 4 - 176
 É com base nos sinais de indicadores técnicos listados abaixo que você pode aplicar as decisões para abertura ou fechamento de uma transação na plataforma MetaTrader 4.
O funcionamento dos indicadores reside na previsão de mudanças de preço, com base na conversão matemática de preço e/ou volumes de um instrumento financeiro.

Momentum Intelligence — MT4 O movimento está ganhando força ou perdendo impulso? Momentum Intelligence reúne o momentum do mercado e a estrutura local em um único gráfico. Um mostrador angular suave acompanha o preço, o histograma mostra a evolução do impulso e as setas BUY/SELL destacam mudanças confirmadas da estrutura local. Assim, você acompanha o movimento e identifica a confirmação pelo preço. O que aparece no gráfico Mostrador ancorado em uma vela histórica e no preço atual para acompanha

Reversal Intelligence — MT4 Identificar uma possível reversão e saber quando ela se confirma são tarefas diferentes. Reversal Intelligence reúne ambas no gráfico: zona de preparação, confirmação BUY/SELL e limite do extremo LOW/HIGH. Três modos permitem escolher uma busca mais ativa, seleção clássica ou filtragem adicional por um modelo treinado integrado. O que aparece no gráfico Zonas de preparação para acompanhar uma possível reversão em formação. Confirmação BUY/SELL após o fechamento da vel

Market Projection Pro — MT4 Quer visualizar como os ciclos de preço de um trecho do gráfico podem se estender? Market Projection Pro analisa uma janela histórica escolhida por você, identifica componentes cíclicos e desenha uma projeção composta à direita. Controle o trecho de origem e o horizonte para comparar o cenário com a estrutura do preço e possíveis zonas de virada. O que aparece no gráfico Limites interativos para selecionar a janela histórica diretamente no gráfico. Componentes cíclico

Reversal Edge System is a professional top-bottom reversal indicator built for MetaTrader 5. It identifies potential trend reversal zones and generates clear trade signals, filtered by multi-timeframe trend analysis to reduce false setups. The indicator displays market sentiment in real time: Strong Bullish Strong Bearish Bullish Bias Bearish Bias Bull-Bear Divergence Each signal comes with predefined Take Profit and Stop Loss levels for proper risk management. It includes signal backtest functi

Institutional Checklist You know your rules. The difficult part is following them when you want the trade. The market starts moving. One indicator looks convincing. Another disagrees. You feel the pressure to act—and suddenly, the conditions you carefully defined yesterday become negotiable today. Institutional Checklist brings your attention back to your process. This interactive indicator for MetaTrader 4 guides you through your own analysis, one component at a time, then combines your answers

Trendlines drawn for you — and a good shape kept as your basis. TrendLineSnap finds the swing highs and swing lows on your chart, joins them and draws one high trendline and one low trendline. Triangles, channels, wedges and horizontal levels used in line trading show up as lines. Automatic trendlines are redrawn whenever a new swing forms. When you see a shape you want to trade, save it. The saved line does not move. When the price comes near it again, show the saved line next to the current li

Where is the price inside the range — in one panel. BoxRangeSnap looks for price zones where the highs and lows touched the same top and bottom again and again, and draws them as a big box and a small box. The panel keeps showing the distance from the price to the top and bottom of the current box. Features Automatic range boxes: a big box and a small box, newest first. The current box is highlighted and extends to the last closed bar. Adjustable detection: minimum touches on the top and bottom,

Reversal Edge Prime Reversal Edge Prime is a comprehensive and highly visual trading tool designed to automatically identify high-probability Reversal and Continuation zones. What sets this indicator apart is its ability to provide a complete, ready-to-use trading plan right on your chart—showing you exactly where to enter, where to place your stop loss, and where to take profit. The indicator is strictly non-repainting (signals are confirmed on candle close) and is incredibly easy to use for bo

Indicador HTF de Média Móvel Crypto_Forex para MT4. - Aprimore seus métodos de negociação com o Indicador HTF MA profissional para MT4. HTF significa - Período de Tempo Superior. - Este indicador é excelente para traders de tendências com entradas de Ação de Preço. - O Indicador HTF MA permite anexar a Média Móvel de um período de tempo superior ao seu gráfico atual para seguir a direção da tendência principal. - O indicador mostra a tendência de um período de tempo superior --> este é sempre u

Indicador Crypto_Forex personalizado avançado "Oscilador de Tendência Adaptativo" - uma ferramenta auxiliar eficiente para negociação no MT4! Sem repintura. - Este indicador é uma nova geração de osciladores - veja as imagens para conferir como usá-lo em combinação com as principais tendências. - Possui zonas de sobrecompra/sobrevenda adaptativas e ajustáveis. - Este oscilador é uma ferramenta auxiliar para encontrar pontos de entrada exatos a partir de áreas de sobrecompra/sobrevenda na direç

Price Action Scanner PRO is a multi-symbol and multi-timeframe candlestick pattern scanner for MetaTrader 4 . The indicator helps traders save time by monitoring multiple instruments and identifying recent Price Action formations from a single chart. Detected patterns are displayed in a compact dashboard , with direct navigation to the corresponding signal candles. Supported Price Action Patterns The scanner detects five candlestick formations: Pin Bar — bullish and bearish candles with a promi

テクニカル指標開発の第一人者であるトム・デマークが考案した TDシーケンシャルは、 トレンドの転換点を判断するのに有用なインディケータです。このインディケータは TDシーケンシャルを裁量およびEAで実際に利用してきた私自身の経験から、より手軽に、かつ効果的に活用できるよう作成された裁量トレード用サインツールです。
この TDシーケンシャルをSupply and Demandと合わせて利用できるのがこのツールの最大の特徴です。例えば価格がDemandゾーンにあるときに TDシーケンシャルのシグナルが出ればより高い精度で反発が期待できます。
また、強いトレンドが生じている際に多くのだましが生じるのはTDシーケンシャルの弱点と思われますが、これを克服するために強力なフィルターを装備しています。また、最も有効と思われるセットアップ9に絞ってサインを発信します。
全通貨ペア、全タイムフレームで利用できます。勝敗判定機能により、このインディケータの直近の相場環境に対する有効性を確認できます。
設定項目は下記のとおりです。 Long...Long方向のシグナルを有効にします。Go

FXB Confluence Engine follows the trend with a range filter and, each time that trend turns on a closed bar, scores how much of the market agrees with the new direction. Momentum and the EMAs, four other timeframes, a higher-timeframe bias, the same filter at two wider settings, volatility, RSI and volume each add points, and a choppy market takes points away. A BUY or SELL prints only when the score reaches your minimum and every filter you have switched on is open. A dashboard on the chart sh

Range Zones M30 draws zones on your chart where price was pushed back hard on the 30-minute timeframe. It works on any symbol and any chart timeframe, and reads only the prices your terminal already has. It does not use any server, does not send anything out, and does not open or change orders. What It Shows A resistance zone above the market and a support zone below it, as filled rectangles that start at the open of the swing candle that formed them and run to the right. At any moment there is

Angora Patterns finds, draws and tracks chart patterns for you. It recognises 23 classic chart patterns, 8 harmonic patterns and 13 candlestick patterns, and gives every pattern a breakout level, a target, an invalidation level, a state and a quality score. Chart patterns: Double Top and Bottom, Triple Top and Bottom, Head and Shoulders, Inverse Head and Shoulders, Rounding Top and Bottom, Ascending, Descending and Symmetrical Triangle, Rising and Falling Wedge, Rectangle, Ascending and Descend

### Crossfire Pro MT4: Precision HYBRID Indicator
**Crossfire Pro** is an institutional-grade hybrid indicator engineered specifically for MetaTrader MT4. A volatility-adapted hybrid indicator for MetaTrader MT4 (Crossfire Pro) that pairs Average True Range (ATR) volatility expansion bands paired with tick volume surge filters to signal high-probability swing and momentum entries with signals evaluated strictly on closed bars to prevent repainting and on-chart signal markers and terminal alert

Retest Pivot Signals é um indicador para o MetaTrader 5 que detecta o rompimento de um nível de pivô importante e só emite o sinal depois que esse nível é retestado, ou seja, quando o preço volta à linha rompida e reage a partir dela. Isso filtra parte dos falsos rompimentos: o sinal vem após a confirmação do nível, e não no momento do rompimento. MT5-version: https://www.mql5.com/en/market/product/200224
Como funciona O indicador procura máximas e mínimas de pivô. Um pivô é confirmado quando

The Dow Theory structure of the chart — in one look. DowTheoryVisual labels every swing high and low as HH, HL, LH or LL and draws a zigzag colored by the trend: blue for an uptrend, red for a downtrend, gray for a range. The panel keeps showing the trend of the current chart and of two higher timeframes side by side. Features HH / HL / LH / LL labels: each swing high and low is compared with the previous one. Trend-colored zigzag: up blue, down red, range gray. The color changes on the bar wher

Key levels on nine timeframes, and an alert the moment the price breaks out. Prices that were stopped again and again are levels many traders watch. BreakerDetectPro finds the zones where swing highs and swing lows gather and draws one level above and one below the price for each timeframe you select, from M1 to MN1. Higher-timeframe levels are drawn on the chart you are looking at. Features Automatic key levels: one level above and one below the price, from swing highs and lows that gather in t

О продукте Yearly Rects — авторский индикатор для MetaTrader 4, который автоматически строит диапазоны каждого торгового года прямо на графике и рассчитывает прогнозируемую ценовую цель следующего года на основе статистики предыдущего. Индикатор создан специально для работы с фондовыми индексами (S&P 500, NASDAQ, DAX, FTSE, Nikkei, MOEX и др.), где годовые циклы имеют ярко выраженный характер и исторически хорошо отрабатывают уровни открытия/закрытия. Однако методика универсальна — её

### Triad Breakout Pro MT4: Precision HYBRID Indicator
**Triad Breakout Pro** is an institutional-grade hybrid indicator engineered specifically for MetaTrader MT4. A volatility-adapted hybrid indicator for MetaTrader MT4 (Triad Breakout Pro) that pairs Average True Range (ATR) volatility expansion bands paired with tick volume surge filters to signal high-probability swing and momentum entries with real-time multi-bar execution signals and real-time chart popups and mobile push notifications.

QUARTER ZONE SCALPER
Pullback signals · 25 % quarter zone target · live hit-rate lab · MT4 + MT5 Quarter Zone Scalper turns a simple pullback scalping method into clear, non-repainting signals. A trend ribbon sets the side, price pulls back through the EMA 20 and closes back on the trend side, and a stochastic 8 / 5 / 3 cross confirms. Every signal comes with the pullback swing, a stop and four targets - with the 25 % "quarter zone" as the main target. The idea: the less of a move you ask

Daily Trend Confluence Scanner Daily Trend Confluence Scanner is a systematic multi-indicator trend-following tool designed to spot high-probability trade setups while filtering out market noise. By evaluating market conditions strictly on completed daily candle closes (shift = 1), this indicator provides reliable, non-repainting signals based on four layers of technical confirmation. Key Features 100% Non-Repainting: All calculations freeze upon daily candle close (shift = 1), eliminating

SMC LEGENDS $56 NOW → $66 NEXT | Price +$10 every 10 copies sold | MT5 VERSION HERE . updates posted regularly | DON'T MISS IT! SMC LEGENDS is a professional institutional-grade Smart Money Concepts (SMC) trading engine for MetaTrader 5 . combining market structure analysis, TPO Market Profile, auto signal alerts, live trade management, and a full trading command center in one indicator. Core Features # Fea

Indicador Forex "CCI para 8 Símbolos" para MT4, sem repintura. - O CCI é um dos osciladores mais populares para negociação. - O Commodity_Channel_Index (CCI) mede a diferença entre o preço atual e a média histórica. - Níveis importantes: +/-200. - É ótimo para entradas de Venda acima da zona de +200 e entradas de Compra abaixo de -200. - O "CCI para 8 Símbolos" oferece a oportunidade de controlar os valores de CCI de até 8 símbolos diferentes em apenas um gráfico. - Este indicador também é exce

Indicador Crypto_Forex "Micro M and Micro W patterns Pro" para MT4, sem repintura, sem atraso. - O indicador "Micro M and Micro W patterns Pro" é um indicador muito poderoso para negociação de Price Action. - O indicador detecta os padrões Micro M e Micro W no gráfico: - Micro W de alta - Sinal de seta azul no gráfico (veja as imagens). - Micro M de baixa - Sinal de seta vermelha no gráfico (veja as imagens). - Com alertas integrados para PC e dispositivos móveis. - O indicador "Micro M and Mic

ApexConverge é um indicador para MetaTrader 5 que detecta automaticamente padrões de triângulo (ascendente, descendente e simétrico), desenha seus limites com uma área sombreada e marca com uma seta o candle de rompimento. MT5-version: https://www.mql5.com/en/market/product/200424
Como funciona O indicador encontra topos e fundos de oscilação, traça duas linhas de tendência por eles e valida o formato: topo plano com fundo ascendente é um triângulo ascendente; topo descendente com fundo plano,

PRL Levels is a MetaTrader 4 indicator that displays structured and evenly spaced psychological price levels directly on the chart. It is designed to make price structure easier to read visually. It does not open, manage or close trades.
The indicator can be used on Forex symbols, indices and CFDs. Distances are entered in conventional pips for Forex and in direct price units for indices and CFDs. The appropriate unit is detected automatically from the symbol specifications provided by the bro

Signal Confirm watches one symbol and tells you when a trend setup has passed a fixed chain of checks. It works on any symbol and any chart timeframe. It reads only the M1 prices, the prices of the oscillator timeframe (M5 by default) and the daily prices your terminal already has, does not use any server, does not send anything out, and does not open, change or close orders. It shows what happened and when; the decision stays with you. What It Does When the chain below is complete, the indicato

QCL RSI Flow Candles — MetaTrader 4 QCL RSI Flow Candles transforms RSI momentum into smoothed Heikin Ashi-style candles in a separate indicator window. Candle bodies, wicks, a directional trend line and reference zones provide a visual framework for assessing momentum, pullbacks and changing conditions. Key Features RSI-based candles: View momentum through candle structure instead of a conventional RSI line. Directional colors: Green candles indicate that the oscillator close is at or above its

this indicator Draws Two Trend Lines automatically. my intend of use is :- 1 . For Buy Entry Make sure The Blue trend line is in Upward and Trending and also the Redline is in Horizontal.
2 . For Sell Entry Make sure the Red Line is in Downward and its Trending and also the Blueline is in Horizontal.
3. use caution, Technical confirmations is needed always. any info please submit a message.

This is MT4 indicator that automatically finds Edge of Trend where it makes Draw Down.
Examples
1 . Buy if The Two trend lines align up
2. Sell if the two trend lines align down
you can also make likes these
1. Buy if drawdown line is (yellow line) that upwards and Trend (Blue line) is Down 2. Sell if drawdown line is (yellow line) that downwards and the Trend (Blue line) is up
for any comments and contats submit message.

SMC Super position - Smart Money Structure & Liquidity Intelligence Professional multi-module market structure, liquidity and trade-planning indicator for MetaTrader 5, designed to combine structural analysis, liquidity behavior, trend context and confirmed signal logic in one compact workspace. The system includes Smart Money structure tools, an independent Master Signal engine, Confluence setups, Scalping analysis, Queen Trend context, multi-timeframe routing and an integrated Signal History d

Volatility Dots puts a trailing line of dots on your chart. In an uptrend the dots sit under the price, in a downtrend above it, and they flip when price closes through the opposite band. It works on any symbol and any timeframe. It reads only the prices your terminal already has, does not use any server, does not send anything out, and does not open or change orders. What It Shows One dot per bar. White dots under the candles mark a rising trend, red dots above the candles mark a falling trend.

CrowdTrap MultiAsset Liquidity MT4 CrowdTrap MultiAsset Liquidity is a technical analysis indicator for MetaTrader 4 designed to identify market structure, liquidity levels, liquidity sweeps, price retests, and potential trading scenarios. The indicator combines multi-timeframe market structure analysis with price action and liquidity-based analysis. Main Features Market Structure Analysis Uses H1, H4, and D1 market data to assess directional bias and identify Break of Structure (BOS) and Change

Nexus Trend Pulse – Trend & Signal Indicator for MT4/5 Nexus Trend Pulse is a visual trend analysis and trading signal indicator developed for MetaTrader 4/5. It combines dynamic trend zones, directional signals, stop reference lines, and entry level visualization in one chart interface. Designed for traders who prefer a clear and organized trading environment, Nexus Trend Pulse helps identify market direction, observe price reactions, and recognize potential trading opportunities without overcr

Daily Range Ladder draws six horizontal levels across the current trading day. The distances come from how far the symbol usually travels in a day, so the levels adapt to every symbol without any setting. It works on any symbol and any chart timeframe. It reads only the daily bars your terminal already has, does not use any server, does not send anything out, and does not open or change orders. What It Shows Three resistance levels above the day's low and three support levels below the day's hig

Indicador Crypto_Forex de Aceleração da Média Móvel para MT4, sem repintura (no-repaint). O MA Acceleration é um indicador de *scalping*, projetado como ferramenta auxiliar para o indicador "MA Speed". O cálculo deste indicador baseia-se em equações da física. Ele mostra a aceleração da linha da média móvel. Existem muitas oportunidades para aprimorar até mesmo estratégias padrão utilizando o MA Acceleration. Ele pode ser usado com SMA, EMA e LWMA. O MA Acceleration representa a segunda derivad
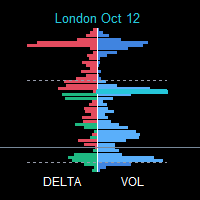
SessionFlowMap — Perfil multissessão de volume e delta com níveis POC O SessionFlowMap constrói um perfil de volume e um perfil de delta (desequilíbrio entre compras e vendas) para as sessões do dia no forex: Ásia, Londres, Nova York e, opcionalmente, Sydney e uma sessão personalizada. Para cada sessão, encontra o POC (Point of Control: o preço com maior volume negociado) e a Value Area (VAH e VAL: a faixa que concentra a maior parte do volume), e projeta esses níveis para a frente como linhas h

Know the direction. Know the plan. Know when to stand aside. CS Trend Pro turns a busy chart into a clear decision. It shows which way the market is moving and marks the moment that changes. With every signal it gives you a complete plan: where to enter, where the idea is wrong, and where to take profit. It is built for swing traders and scalpers who move with the swing: take a part of the profit at each target, and stay in for as long as the move lasts. Built on volatility and on support and re

Quantum Enigma Quantum Enigma is a technical analysis indicator based on market structure and price action. It is designed to identify potential Bullish and Bearish setups around established price ranges. The indicator analyses market conditions and can apply several configurable confirmation and filtering conditions before displaying a signal. This allows traders to adjust the balance between signal frequency and selectivity according to their preferred trading approach. How It Works Quantum En

AlphaTrend Pullback Pro MT4 Sinais de pullback com a tendência, filtro de notícias e painel profissional — tudo em um só indicador. O AlphaTrend Pullback Pro transforma a leitura de tendência e correção em sinais visuais claros no gráfico. Ele identifica a direção macro do mercado em um timeframe superior, aguarda o preço retornar à média (pullback), confirma a rejeição com o fechamento a favor da tendência e dispara o gatilho de entrada. Sem repintar barras fechadas, sem ruído, sem complicação.

Correlation Radar PRO — Painel Multiativo de Correlação para MetaTrader 4 Descrição Curta: Elimine o ruído do mercado e identifique distorções de preço em segundos. O Correlation Radar PRO calcula a correlação histórica, mensal, semanal e atual entre múltiplos ativos e permite sobrepor gráficos diretamente na sua tela sem alterar o símbolo principal. Descrição Completa: Analisar múltiplos ativos alternando gráficos manualmente faz você perder tempo e perder oportunidades. O Correlation Radar PRO

Mechanical Support Resistance automatically identifies potential support and resistance levels using vertical price profiles built from historical Open, High, Low, and Close (OHLC) prices. Most mechanical support and resistance indicators identify levels based on obvious price swings on the chart. Mechanical Support Resistance takes a different approach by analyzing the vertical distribution of OHLC prices to reveal support and resistance levels that are difficult to identify manually through vi

Enigma Cipher Enigma Cipher is a technical analysis indicator designed to help traders identify potential bullish and bearish market reversals through price pressure, momentum and multiple confirmation conditions. The indicator evaluates the relationship between recent price behaviour and the current signal candle. Additional filters can be enabled to refine the analysis and reduce signals that do not meet the selected conditions. How It Works Enigma Cipher first evaluates market pressure and pr

Renko Chart Pro MT4 is a practical Overlay/Panel Renko indicator designed to give traders a cleaner way to read price action without leaving the standard chart environment. Unlike many Renko tools that require separate offline charts or complicated setups, this indicator displays a fully configurable Renko panel directly inside your active MT4 chart .
You no longer need to have endless offline charts which makes shifting through instruments cleaner and more efficient. This is not an indicator I

MQLTeam Currency Power coloca duas moedas num gráfico e mostra qual é mais forte. Cada moeda tem o seu cesto de pares. As colunas na janela do indicador são a diferença entre os dois cestos, e a tabela mostra o par que produz essa diferença. O exemplo pronto é o euro contra o dólar. Se mudar os dois nomes e as listas de pares, a forma de ler continua a mesma para quaisquer duas moedas. Também disponível: MQLTeam Currency Power para o MetaTrader 5 O valor está em pips. A medida padrão é a distânc

O ValueOrbit mostra onde está o preço «justo» do período atual e quanto o mercado se afastou dele. É uma ferramenta de contexto: desenha uma linha central Value Core com três pares de órbitas (±1σ, ±2σ, ±3σ) ao redor, e o painel indica o quanto o preço está esticado. Não gera sinais de entrada. MT5-version: https://www.mql5.com/en/market/product/201292
Como funciona O Value Core é um nível de referência que se forma desde o início de cada período (sessão, semana ou mês) e recomeça quando um no

AI ZONE RADAR — Suporte e resistência em zonas de preço Escolha a versão para sua plataforma Esta é a edição MT4. A edição MT5 também está disponível. Ver a versão MT5 MT4 e MT5 são produtos separados no Market. A compra inclui apenas a plataforma escolhida. Veja onde o preço está antes de decidir Surge um sinal de compra, mas há uma resistência logo acima? Você observa um recuo, mas onde está o suporte próximo? Acrescentar linhas nem sempre esclarece essas questões. AI ZONE RADAR reúne áreas pr

Indicador Crypto_Forex HTF DeMarker para MT4. - Este indicador é uma ferramenta útil utilizada pelos traders técnicos para encontrar pontos de entrada e saída. HTF significa - Prazo Superior. - A linha do oscilador DeMarker indica a posição atual do preço em relação aos máximos e mínimos anteriores. - O DeMarker fornece os sinais de divergência regular mais eficientes entre outros osciladores. - Zona OverBought é quando o DeMarker está acima de 0,7 e OverSold - quando está abaixo de 0,3. - O in

TraderDesk is an institutional-grade financial spreadsheet and account metrics dashboard meticulously engineered for professional portfolio managers, proprietary firm traders, and systemic asset growth monitors. By integrating a state-of-the-art Time-Weighted Split-Period Capital Engine , TraderDesk transforms your chaotic chart canvas into a beautifully structured, clean financial workspace. It automatically filters out standard candlestick noise, grid line clutter, and price scale bars, allow

Indicador Crypto_Forex "Padrão do Enforcado" para MT4, sem repintura, sem atraso. - O indicador "Padrão do Enforcado" é um indicador muito poderoso para negociação de Price Action. - O indicador detecta padrões de baixa do Enforcado no gráfico: sinal de seta vermelha no gráfico (veja as imagens). - Com alertas para PC, celular e e-mail. - O indicador "Padrão do Enforcado" é excelente para combinar com níveis de suporte/resistência. Click here to see high quality Trading Robots and Indicators! E

Indicador Forex "INFO Spread Swap Display" para MT4, ferramenta auxiliar de negociação. - O indicador INFO Spread Swap Display mostra o Spread e os Swaps atuais do par de moedas onde está ligado. - Indica também o Saldo da conta, o Capital Próprio e as Margens. - É possível localizar os valores dos indicadores em qualquer canto do gráfico. - É possível configurar também a cor e o tamanho da letra. Click here to see high quality Trading Robots and Indicators! Este é um produto original oferecido

*Strong Hosoda Pro - Edizione COMPLETA - Premium*
Strong Hosoda Pro è un indicatore professionale di trend e livelli basato sul metodo originale Ichimoku Hosoda, sviluppato per trader esperti.
Questa è la versione Premium COMPLETA, valida per tutti i tempi, da M1 a D1. Nessuna restrizione.
*Perché Premium?* A differenza degli indicatori standard, combinazione direzione del trend, tempistica di ingresso e livello di take profit in un unico sistema chiaro, basato sulla logica completa dell'Ich

ZZ Impulse PRO is an authoring toolkit for reading market structure: two independent fractal ZigZags, Classic and Impulse/Correction modes, non-standard period candles, and full panel control — on a single chart. Concept The market speaks on both lower and higher scales at once. A typical ZigZag often keeps only one of those voices. ZZ Impulse PRO delivers controlled structure : two markups with separate settings, two ways to read waves, a flexible multiplier, and HTF/synthetic candles overlaid

GT Direction Dashboard — Comprehensive User Manual & Technical Guide 1. Executive Summary & Core Purpose The GT Direction Dashboard is a multi-timeframe, multi-metric currency alignment dashboard built for MetaTrader 4. It is designed to solve one of the greatest challenges manual currency traders face: Analysis Paralysis and Information Overload . Rather than manually switching across 6 or 8 timeframe charts ( MN1 down to M5 ) and adding 4 or 5 separate indicators (RSI, ADX, PBR, Volatility, RO

NOTE: Only 10 copies left at current price! Final price: 990$
Trade the Breakout. Catch the Move.
Take your technical analysis to the next level with TrendLine Support Resistance with Alerts , a MetaTrader 4 indicator designed for traders who focus on trendline breakouts. Identify potential trading opportunities with trendlines drawn directly on your chart and clear BUY and SELL arrows that help you spot possible breakout signals. KEY FEATURES Trendline Breakout Signals — Identify potenti

Fulcrum Value Profile é um indicador para MetaTrader 4 que constrói um perfil de volume de ticks para cada sessão, marca o Point of Control (POC) e a área de valor, desenha o POC/VAH/VAL em desenvolvimento como linhas, acompanha POCs virgens (naked POC) e sinaliza dois padrões em barras fechadas: reentrada na área de valor anterior (regra dos 80%) e aceitação fora dela (rompimento). Nunca abre, modifica ou fecha operações. Início rápido Coloque o indicador em um gráfico M5, M15 ou M30. Mantenha

Every ICT idea in one indicator - market structure, order blocks, fair value gaps, premium / discount and OTE, liquidity sweeps, killzones and SMT - added up into one confluence score, with alerts and a multi-symbol scanner. Try it free first: press Free Demo and run it in the Strategy Tester (visual mode) - the panel, zones, signals and scanner all work there. ICT Pro Honest Stats draws all of it on your chart, checks every closed candle against nine ICT factors, shows the bullish and bearish s

Apex Patterns PRO Compre o indicador - Obtenha um Expert Advisor baseado nele GRATUITAMENTE. Inteligência Auto-otimizada de Padrões e Rompimentos Os rastreadores de padrões tradicionais dependem de entradas fixas, frequentemente apresentando baixo desempenho quando a volatilidade e as estruturas do mercado mudam. O Apex Patterns PRO foi projetado para se adaptar às mudanças nas condições do mercado, combinando o reconhecimento estrutural de padrões de gráfico, filtragem de momentum e auto-otimi

SMC Market Structure Toolkit é um conjunto de ferramentas Smart Money (ICT / SMC) para MetaTrader 4 em UM só indicador. Ele lê o mercado como um trader Smart Money: primeiro a estrutura, depois a liquidez, depois as áreas onde o preço pode reagir - e desenha tudo diretamente no gráfico, com rótulos curtos, setas opcionais e alertas opcionais. Principais recursos A estrutura é construída de DUAS formas ao mesmo tempo - BOS / CHoCH Internal e Swing, cada uma com seu próprio período gráfico, força

Ribbon Pilot — Fita de tendência com zonas de operação, histórico de sinais e lista de observação Para que serve O Ribbon Pilot é um indicador de gráfico para o MetaTrader 4 que mostra a direção da tendência num relance, marca os sinais de entrada com setas e desenha de imediato um plano de operação completo: entrada, stop e até quatro alvos de lucro. Além disso, mantém estatísticas dos sinais recentes e permite verificar outros instrumentos sem sair do gráfico. MT5-version: https://www.mql5.co

TCM ORB Indicator for MetaTrader 4 draws the opening range of the Asia, London and New York sessions and marks breakouts from each range on closed candles. What it shows - A box for each session's opening range (the first 30 minutes by default, adjustable) - Session times adjusted to your broker's clock and daylight saving automatically, or set manually - A breakout arrow when a candle closes outside the range - Optional entry, stop-loss and take-profit lines for each breakout, with an adjustabl

Indicador Crypto_Forex "Correction Breakout Pro pattern" para MT4, sem repintura, sem atraso. - O indicador "Correction Breakout Pro pattern" é um indicador muito poderoso para negociação de Price Action com alto potencial de lucro. - O indicador detecta barras de rompimento de alta e de baixa após a correção de preço: - Padrão de rompimento de correção de alta - Sinal de seta azul no gráfico (veja as imagens). - Padrão de rompimento de correção de baixa - Sinal de seta vermelha no gráfico (vej

TCM SMC Indicator for MetaTrader 4 marks market structure on your chart: supply and demand zones, breaks of structure, liquidity grabs and fair value gaps. Everything is calculated from closed candles. What it shows - Fresh supply and demand zones, extended to the right until price returns to them, with the option to also show zones that have been revisited - Breaks of structure (BOS), labelled on the chart - Liquidity grabs (LQG), where price runs a recent high or low and turns back - Fair valu

BTCUSD SSL Channel Pro Multi-timeframe trend analysis and filtered BUY/SELL signals for MetaTrader 4. Overview BTCUSD SSL Channel Pro is a technical analysis indicator designed to help traders identify market direction, potential trend reversals, and filtered trading opportunities. The indicator combines an SSL channel with momentum analysis, trend-strength measurements, volatility conditions, tick-volume participation, and optional higher-timeframe confirmation. Its chart interface displays tre

TCM Trend Indicator for MetaTrader 4 highlights trend-following setups on closed candles and shows a suggested entry, stop-loss and take-profit for the latest one. What it shows - An arrow under or over the candle when a bullish or bearish trend setup appears, on closed candles only, so arrows do not repaint - Entry, stop-loss and take-profit lines for the latest setup, with the stop based on market volatility - A title and status line showing the current state Risk : reward Choose 1:1, 1:1.5, 1

Liquidity Sweep and Market Structure Indicator is a chart-based tool for MetaTrader 4 that highlights potential liquidity grabs around recent swing highs and lows. The indicator can optionally wait for a market structure break, known as a Change of Character, before displaying a directional signal. Its scoring system can include a volume filter and higher timeframe trend bias. Features Identifies potential bullish and bearish liquidity sweeps. Optional market structure confirmation. Configurabl

Indicador Crypto_Forex "Histograma do Filtro de Ação de Preço" - é uma ferramenta de negociação auxiliar eficiente para negociação de Ação de Preço! Sem repintura. - Este indicador sugere ao trader a direção das entradas. Então o trader só precisa procurar por sinais de Ação de Preço nessa direção. - O Histograma do Filtro de Ação de Preço deve ser combinado com padrões de Ação de Preço e níveis de suporte/resistência. - Histograma de cor verde - Procure por entradas de Compra. - Histograma de

Box Volume Profile Box Volume Profile draws a volume histogram inside any rectangle you place on the chart. Choose a time window and a price range, and the indicator shows how much volume was traded at each price level inside that zone. It also plots the Point of Control (POC) and the Value Area boundaries (VAH and VAL). How to use Press the draw hotkey (the letter V by default) and drag a rectangle anywhere on the chart. The volume profile appears immediately inside the box. Move or resize the
Você sabe por que o mercado MetaTrader é o melhor lugar para vender as estratégias de negociação e indicadores técnicos? Não há necessidade de propaganda ou software de proteção, muito menos problemas de pagamentos. Tudo é providenciado no mercado MetaTrader.

Você está perdendo oportunidades de negociação:
- Aplicativos de negociação gratuitos
- 8 000+ sinais para cópia
- Notícias econômicas para análise dos mercados financeiros
Registro
Login
Você concorda com a política do site e com os termos de uso
Se você não tem uma conta, por favor registre-se