Reversal and Breakout Signals for MT4
- インディケータ
- バージョン: 1.1
- アップデート済み: 4 4月 2024
- アクティベーション: 5

This innovative tool is crafted to enhance your chart analysis by identifying potential reversal and breakout opportunities directly on your charts. It's designed with both novice and experienced traders in mind, providing intuitive visual cues for better decision-making. Let's dive into the key features and how it operates:
### Key Features:
- 🔶 Dynamic Period Settings: Customize the sensitivity of the indicator with user-defined periods for both the indicator and volume strength.
- 📊 Volume Threshold: Set a threshold to define what constitutes strong volume, enabling the identification of significant market movements.
- 💡 Trend Coloring: Option to color candles during trends, making it easier to visualize bullish and bearish market conditions.
- 🌈 Customizable Visuals: Choose your preferred colors for bullish, bearish, and breakout signals, personalizing the chart to your liking.
- 🚨 Advanced Alert System: Configure alerts for reversal and breakout signals, ensuring you never miss a potential trading opportunity.
### How It Works:
The core logic revolves around calculating weighted moving averages of high and low prices over a user-defined period, identifying the highest and lowest points within this period to establish potential breakout or breakdown levels while reducing the amount of noise, hence the use of moving averages.
###
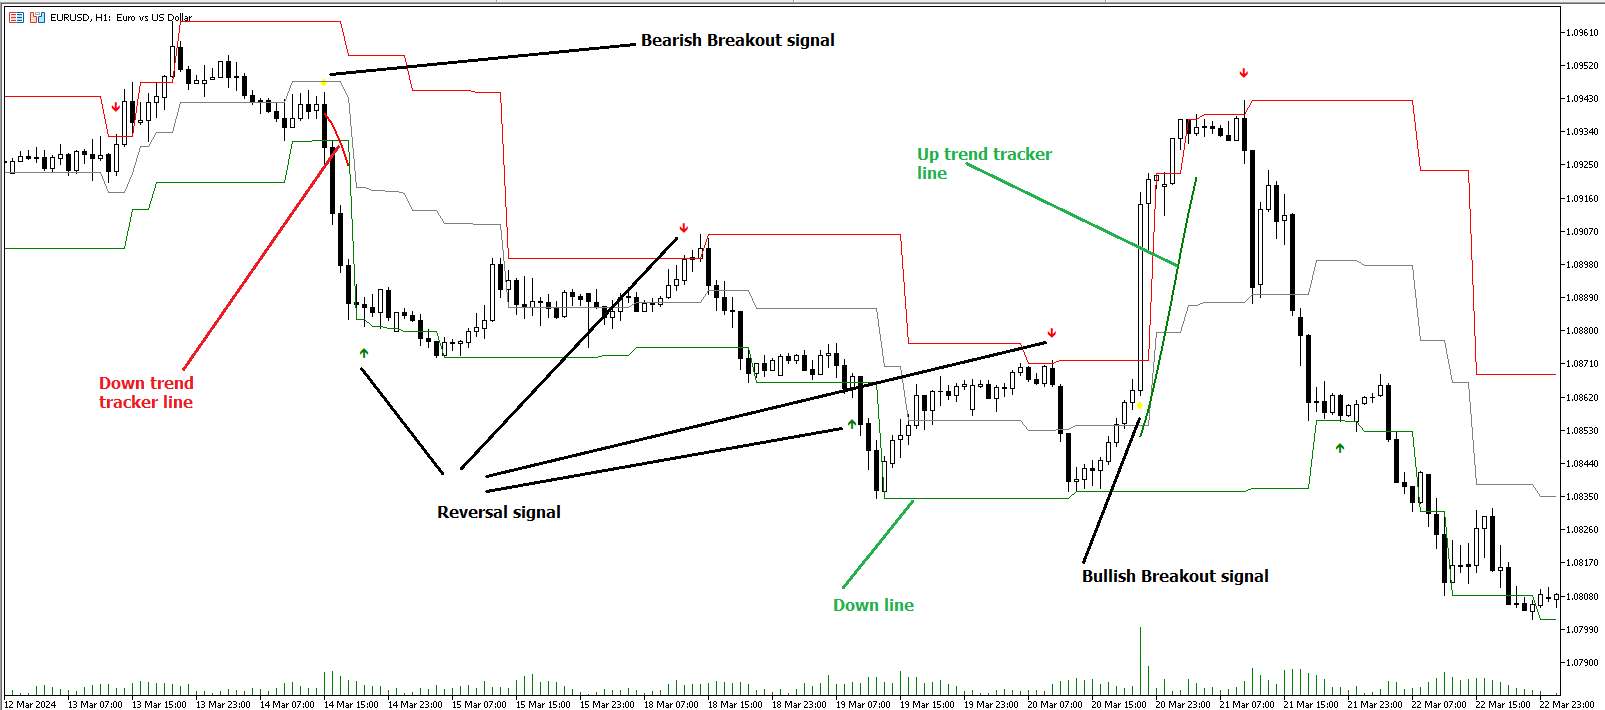
- Diamonds represent breakout signals. A bullish breakout is marked below the bar when the price closes above the upper level, suggesting strong buying pressure. Conversely, a bearish breakout above the bar indicates strong selling pressure as the price closes below the lower level.
- The tool also features a Trend Tracker that highlights the current market trend using the Hull Moving Average (HMA). This can help you stay aligned with the overall market direction for your trades.
How to Use:
To maximize the effectiveness of the Reversal and Breakout Signals tool, follow these steps:
1. 🔧 Set Up Your Preferences:
- Adjust the Indicator Period and Volume Strength Period to match the timeframe of your trading strategy. This fine-tuning allows the indicator to better align with your specific market analysis needs.
- Define the Strong Volume Threshold to distinguish between ordinary and significant volume movements. This helps in identifying breakout or reversal signals with higher confidence.
2. 🎨 Customize Visuals:
- Choose colors for Bullish, Bearish, and Breakout Signals to visually differentiate between different types of market activities. This customization facilitates quicker decision-making while scanning charts.
3. 🔍 Reversal Signals:
- Bullish Reversal: Look for a triangle below the bar indicating a potential upward movement. It's identified when the price dips below the lower level but closes above it, suggesting a rejection of lower prices.
- Bearish Reversal: A triangle above the bar signals a potential downward movement. This occurs when the price spikes above the upper level but closes below, indicating a rejection of higher prices.
4. 📈 Trend and Breakout Signals:
- Diamonds represent breakout signals. A bullish breakout is marked below the bar when the price closes above the upper level, suggesting strong buying pressure. Conversely, a bearish breakout above the bar indicates strong selling pressure as the price closes below the lower level.
- The tool also features a Trend Tracker that highlights the current market trend using the Hull Moving Average (HMA). This can help you stay aligned with the overall market direction for your trades.
### Buy and Sell signals:
+ Indicator provides information suggesting to place buy and sell orders at the Reversal arrow candle and exit the position when the price crosses the average line (default is gray line) or a Breakout signal appears in the opposite direction (default is orange diamond - bullish breakout signal displays below the candle's low while bearish breakout signal displays above the candle's high)