YouTubeにあるマーケットチュートリアルビデオをご覧ください
ロボットや指標を購入する
仮想ホスティングで
EAを実行
EAを実行
ロボットや指標を購入前にテストする
マーケットで収入を得る
販売のためにプロダクトをプレゼンテーションする方法
MetaTrader 4のための新しいテクニカル指標 - 45
このインジケーターは、トレーダーの要件に従ってチャートをよりクリーンにするために有効/無効にできる最大6つのレベルをプロットします
これらの6つのレベルは2つのセットにあります:高と低
セットごとに、異なる時間枠を選択できます
価格が日次、週次、または月次の高値に達すると、通常5分などの短い時間枠で価格が拒否されると考えられるため、これは以前の高値と安値の反転の戦略に基づいています。
特徴 :
-単一のチャートで最大6つの時間枠の高値と安値を追跡します
-これらのレベルにアラートを設定します。メール、プッシュ、またはターミナルアラート。価格がこれらのレベルに達すると、即座にアラートが送信されます。
-線のスタイル、幅、色など、レベルのスタイルをカスタマイズします
-シフト:2日目または3日目の高低を追跡または調査したいですか?シフトは、2番目のバーの高低の場合は2に、3番目のバーの高低の場合は3に設定できます。

Cobra Pivot Points は、最適化されたピボット ポイントをプロットするためのインジケーターであり、デモをダウンロードすることで自分でバックテストできます。
1. 2 つの最適なピボット モードを選択します: Cobra ピボットまたは Camrilla ピボット
2. D1 に限定されず、任意の時間枠を使用できます。
3. Shiftパラメータを使用して、前日の高値安値終値を操作できます。 1 = 前のバー、2 = 前のバーなど。これらのパラメーターは、ピボットの研究開発に役立ちます。
4. レベルがタッチされると、アラート、電子メール、またはプッシュ通知が送信されます。 レベルに達すると、ピボット レベルは緩和されたとみなされ、再度警告されなくなります。 再度アラートが必要な場合は、時間枠を変更してアラートをリセットする必要があります。
5. 線の色、線のスタイル、線の幅、文字の色、フォントを完全にカスタマイズします。
コブラピボットは、LZone (スキャルピングに非常に近いレベル)、NZone (市場が統合しているとき)、HZone (ポジション取引
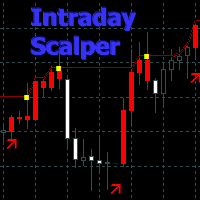
An automatic trend indicator that uses an algorithm to determine impulse signals for scalping and intraday trading.
The trend-following indicator automatically calculates potential entry and exit points for trades.
The indicator contains a trend line and a target channel for following signals, changing color depending on the direction.
Main characteristics
Signal colored candles and arrows: blue - downward direction, red - upward direction. Yellow dots for exiting trades are located along the

An extended version of the indicator for visualizing the time ranges of key trading sessions: Asian, European and American. The main advantage of this indicator is the automatic construction of a price profile for a trading session. The indicator has the functionality to set the start and end time of each trading session, as well as automatically determine the time zone of the trading server. The indicators include the ability to work with minimal CPU usage and save RAM. In addition, the option
FREE

(first and original) MOLFAR – a new price rebound indicator algorithm .
NON-REPAINTING - it has appeared and will remain! NON-LAGGING - appears on time!
We really worked on the algorithm of this indicator for a long time.
It is unique, you can make sure of it both in the free version on the tester and in the full-fledged version on your account.
Description, settings and other interesting things about the MOLFAR indicator can be found here .
MOLFAR uses technical analysis, calculates

One of the most powerful and important ICT concepts is the Power of 3. It explains the IPDA (Interbank Price Delivery Algorithm) phases. PO3 simply means there are 3 things that the market maker's algorithm do with price:
Accumulation, Manipulation and Distribution
ICT tells us how its important to identify the weekly candle expansion and then try to enter above or below the daily open, in the direction of the weekly expansion.
This handy indicator here helps you keep track of the weekly and
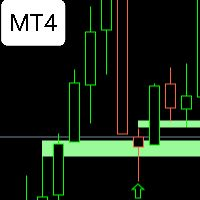
FVG WATCHER is an indicator that helps traders identify fair value gaps in the market. The indicator draws fair value gaps and alerts the user when the fair value gap has been swept. It allows users to specify how it should be swept, what time range to alert, and the size of the fair value gap to alert. It also allows the user to apply a moving average trend filter for better choice of alerts. The indicator also allows push mobile notifications. What makes FVG Watcher special is that it can be
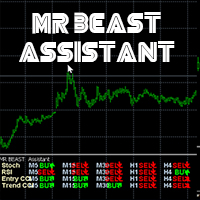
MRBEAST Assistant El indicador MR BEAST Assistant para MetaTrader es un indicador multitemporal que se basa en tres indicadores estándar: el oscilador estocástico, el RSI (Índice de Fuerza Relativa) y el CCI (Commodity Channel Index). Muestra las direcciones de la tendencia actual para los marcos temporales M1, M5, M15, M30, H1, H4, D1, W1 y MN1. Cuando se sigue un indicador de este tipo se tiene una visión clara de las tendencias en todos los marcos temporales importantes. No imp
FREE
Simple but effective entry improving indicator that you want to use. Combine with other indicators and your trading strategies. Explore different ways to use it and find your perfect entry.
Basic instructions: Buy Signal Example: colour change from red to green Sell Signal Example: colour change form green to red
Check screenshots below for examples of use.

Introducing our advanced Indicator, a groundbreaking tool for identifying support and resistance zones with unmatched precision. Elevate your trading strategy with a host of features, including a dual-color upper and lower box system that allows for easy visual recognition of market trends.
Key Features: Dual-Color Box for the Support and Resistance Zones Customize your analysis with dual-color box. The upper and lower boxes offer distinct colors, providing a clear visual representation of supp

Introducing our revolutionary intra-day trading indicator, meticulously crafted to optimize your trading insights within the 24-hour market cycle. Immerse yourself in historical data with precision using two distinctive modes - "All History" and "Last X Hours."
Key Features: All History Mode Uncover a comprehensive view of the day's dynamics. Instantly analyze the preceding day's high and low, 50% mid-point, and the open versus close price for the current day. Decode critical patterns to inform

Introducing our groundbreaking indicator designed to elevate your trading strategy! Unlock the power of precise volume analysis with Buy, Sell, and Neutral indicators. Tailor your approach with customizable levels based on timeframes and moving average methods.
Key Features: Dynamic Volume Insights Instantly identify Buy, Sell, and Neutral volumes for informed trading decisions. Gain clarity on market sentiment like never before. Adaptable Level Configuration Customize and adapt levels to match
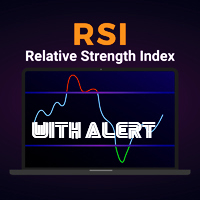
Indicador Universal RSI con Alertas de Oportunidad Este indicador para MetaTrader ha sido meticulosamente diseñado para adaptarse a todos los periodos de tiempo, proporcionando una herramienta versátil para los operadores de todos los niveles. Basado en el índice de fuerza relativa (RSI), este indicador destaca oportunidades potenciales en el mercado y te notifica de manera instantánea a través de alertas personalizadas. Características Principales: Universalidad de Periodos de Tiempo: Funciona
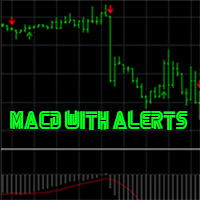
Indicador de Oportunidades MACD en Tiempo Real con Alertas de Precisión Descubre un indicador excepcionalmente preciso diseñado para potenciar tu experiencia de trading. Basado en el Moving Average Convergence Divergence (MACD), este indicador ofrece señales nítidas y oportunas, mejorando tu capacidad para identificar puntos de entrada y salida estratégicos. Además, este potente instrumento te mantendrá informado con alertas en tiempo real, proporcionándote una ventaja competitiva en los mercado
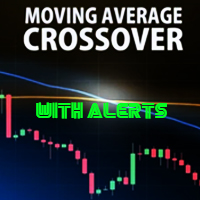
Descubre una nueva dimensión en el análisis técnico con CrossAlert MA, un poderoso indicador basado en cruces de medias móviles con funciones de alerta incorporadas. Diseñado para MetaTrader 4, CrossAlert MA utiliza la estrategia de cruce de medias móviles para identificar cambios significativos en la dirección del precio, proporcionando señales claras y oportunas. Características Principales: Cruces de Medias Móviles: CrossAlert MA aprovecha la potencia de los cruces de medias móviles para iden

PrecisionBands Descripción: Explora el mundo del trading con mayor precisión utilizando PrecisionBands, un indicador avanzado basado en las famosas Bandas de Bollinger. Diseñado para MetaTrader 4, PrecisionBands combina la versatilidad de las bandas de volatilidad con marcadores nítidos de señales de compra y venta, proporcionando una herramienta esencial para los traders que buscan tomar decisiones informadas. Características Principales: Bandas de Bollinger Mejoradas: PrecisionBands utiliza al

The Trend Analysis Indicator is an innovative tool designed for traders and investors who seek to navigate the complexities of the financial markets with greater precision and insight. This powerful indicator is engineered to adeptly identify whether a market is trending or not, offering users a vital edge in their trading strategy. Key Features: Accurate Trend Detection : The core functionality of the Trend Analysis Indicator lies in its ability to accurately detect market trends. It analyzes p

**Market Structure Break Out(MSB)**は、 MT4およびMT5 向けに設計された高度なツールで、市場の動きを構造としてとらえ、 トレンド方向および逆方向の矢印とアラート によって優れたトレードシグナルを発見するのに役立ちます。 この製品のもう一つの重要な機能は、 持続的な供給と需要ゾーンの描画 です。トレーダーは重要な価格レベルを簡単に把握できます。さらに、 リアルタイムのバックテスト機能 により、過去におけるインジケーターのパフォーマンスをチャート上で確認でき、透明性と信頼性が向上します。 無料EAを入手:
無料の Market Structure Breakout EA を手に入れましょう。このEAは、ブレイクアウト矢印に基づいて自動的に取引を開き、固定ロットサイズとカスタマイズ可能なストップロスおよびテイクプロフィットを設定できます。 受け取り方法:
ここをクリックしてEAをダウンロードしてください。このEA は、すでに Market Structure Break Outインジケーター を購入している場合にのみ動作します。 この商品のMT5

基本的な需給インジケータは、あなたの市場分析を強化し、あらゆるチャート上の重要な機会領域を特定するために設計された強力なツールです。直感的で使いやすいインターフェイスで、この無料のメタトレーダー用インディケータは、需給ゾーンを明確に表示し、より多くの情報に基づいた正確な取引判断を可能にします / MT5無料版 この指標のダッシュボードスキャナー: ( Basic Supply Demand Dashboard )
特徴 チャートの需給ゾーンを自動的にスキャンし、面倒な手動分析を不要にします。 直近の需給ゾーンまでの残り距離をグラフィカルに表示 供給ゾーンは特徴的な色で強調表示され、需要ゾーンは別の色で表示されるため、迅速かつ正確な解釈が可能。 このインディケータは、最も近い供給ゾーンまたは需要ゾーンとチャート上の現在価格との距離をpips単位で自動的に計算し、明確かつ定量的な指標を提供します。pips単位の距離はチャート上にはっきりと見やすく表示され、現在価 格との距離が大きい、または小さいエリアを素早く特定できます。 需給ゾーンの接近やブレイクを警告 どのタイムフレームでも機
FREE

このダッシュボードは、選択したシンボルの取引戦略に応じて、スキャルピングと長期モードの両方で、チャート上の需給ゾーンを発見し表示します。さらに、ダッシュボードのスキャナーモードは、一目ですべての希望のシンボルをチェックし、適切なポジションを見逃さないようにするのに役立ちます / バージョンMT5 無料インディケータ: Basic Supply Demand
特徴
複数の通貨ペアの取引機会を見ることができ、需給ゾーンの近さに応じてランク付けされた全ペアを明確かつ簡潔に表示します。 色から検出パラメータまで、特定のニーズに合わせてカスタマイズ可能な設定
主な入力
Indicator mode : 新機能を備えたインジケーター・モードまたはパネル・モードから選択。 Symbols : "主要28通貨ペア "または "選択されたシンボル "から選択。 Selected Symbols : カンマで区切られた監視したいシンボル (「EURUSD,GBPUSD,XAUUSD」)。お使いのブローカーがペアに接尾辞または接頭辞を付けている場合は、次の2つのパラメータ(ペア接頭辞またはペア接尾

--- FREE VERSION - WORKS ONY ON EURUSD
------------------------------------------------------------------- This is a unique breakout strategy that is used for determination of the next short term trend/move. The full system is available on MQL5 under the name "Forecast System". Here is the link --> https://www.mql5.com/en/market/product/104166?source=Site Backtest is not possible, because calculations are done based on the data of all timeframes/periods. Therefore I propose you use the technolo
FREE
LuxAlgoによってコード化された別のプラットフォームから変換されたインジケータです。
異なるタイプの移動平均を追加しました。オリジナルのバージョンでは、移動平均はSMAで、データソースはローソク足の終値から収集された市場からのものでした。
このバージョンでは、多くの移動平均の種類を選択でき、また、高値/安値/HL2/HLC/HLC2/...のようなソースデータも選択できます。
以下はオリジナル開発者からの詳細です:
レンジ検出インジケータは、価格がレンジ化している間隔を検出し、強調表示することを目的としています。レンジの両端はリアルタイムで強調表示され、ブレイクアウトは両端の色の変化で示されます。
レンジ相場は、価格が特定のレンジ内で動く定常期間によって定 義されます。
レンジ相場の検出は、トレーダーが手動で行う一般的な作業です。価格がレンジの両端のいずれかをブレイクすることは、新たなトレン ドを示唆することがあり、価格がレンジの上限をブレイクすれば上昇トレンド、 下限をブレイクすれば下降トレンドとなります。
レンジはゾーンとして強調表示され、過去に遡って設定されま

Levels インジケータは、前日のデータに基づいています。 数式がエントリーレベルとエグジットレベルを決定します。
取引推奨。 Levelsは、ボラティリティが出現する欧州セッションの開始時に取引する。 ボラティリティが十分でない場合は、利食いの半分でエグジットする。 利益が半分の水準で価格が反転した場合、反転時に利益が半分の水準でターゲットを探します。 価格がエントリーレベルから跳ね返された場合、反対方向に価格が2番目のテイクプロフィットに到達する可能性があります。
常にブレイクアウトでエントリーするべきではありません。再テストを待つことをお勧めします。 再テストは、市場に複数の最小出来高レベルがある場合に有効です。UPD1 Profile Levelsインディケータを参照。
入力パラメータ 。
Start Hour - 1日の始まりの時間から。 00-デフォルト 。
Visual Button - ボタン表示(有効/無効) 。 Corner - ボタンアンカー角度 。 X indent - ピクセル単位の水平パディング 。 Y indent - ピクセ
FREE

**IRDeS(距離とスパイクの検出指標)**は、ほぼ完璧なタイミングで市場に参入するための力とゼロからの距離を示す指標です。 ゼロからの距離とボラティリティを検出する青色の連続線と、ゼロを上回る赤色のヒストグラムおよびゼロを下回る緑色のヒストグラムから構成され、特定のローソク足での取引の強度と力を測定し、チャート上の特定のポイントで強力な推進、つまり「スパイク」を生成します。 IRDeSは技術分析において貴重で革新的かつ多様なツールであり、市場参入後の動きのパワーの品質も測定できるため、現代の状況に適しています。 IRDeSの明白な利点にもかかわらず、他のどの指標と同様に、アナリストは慎重に行動し、特定のチャート領域に焦点を当て、他の領域を避ける必要があります。 特にトレーダーはこの指標を過買いまたは過売りの条件を見つける手段として使用しようとするかもしれませんが、これが常に機能するわけではありません。 IRDeSは任意の値を取る可能性があるため、「過剰のしきい値」を正確に特定することは不可能です。当社の指示に従えば、時間と十分な経験を積めば、ほぼ誰でもチャートデータを分析し、IRD

Indicator Waiting Volatility - an indicator for determining volatility zones and flat conditions.
Over time, the price on the chart is in different trends, goes down, goes up, or stays the same. The indicator helps the trader determine which trend the price is in.
In its work, it uses several tools for technical analysis; first, the direction of the trend is determined, then, in this direction, the indicator monitors changes in volatility.
If the price fluctuates within the noise, it is in track

This indicator presents an alternative approach to identify Market Structure. The logic used is derived from learning material created by DaveTeaches (on X) Upgrade v1.10: add option to put protected high/low value to buffer (figure 11, 12)
When quantifying Market Structure, it is common to use fractal highs and lows to identify "significant" swing pivots. When price closes through these pivots, we may identify a Market Structure Shift (MSS) for reversals or a Break of Structure (BOS) for co

This indicator provides the ability to recognize the SMC pattern, essentially a condensed version of the Wyckoff model. Once the pattern is confirmed by RTO, it represents a significant investment opportunity. There are numerous indicators related to SMC beyond the market, but this is the first indicator to leverage patterns to identify specific actions of BigBoy to navigate the market. Upgrade 2024-03-08: Add TP by RR feature. The SMC (Smart Money Concept) pattern is a market analysis m

An indicator for visualizing time ranges of key trading sessions: Asian, European, and American. The indicator features functionality for setting the start and end times of each trading session, as well as an adjustable timezone of the trading server. The main advantages of the indicator include the ability to operate with minimal CPU load and memory usage. Moreover, it offers the option to specify the number of displayed historical days, providing the user with flexible market dynamics analysis
FREE

Introducing the advanced trading tools of 2023. MTF PPAAF Model S. This is sub window version of my best trading tool : MTF Precise Price Action Arrow Filtered. Click here to learn more about MTF PPAAF . This trading tool is equipped with various powerful features : MTF = Multi Time Frame = Time Frame can be changed. On/off button. Non Repaint Arrows. Customizable parameter, color etc. Can show all time frame (ATF) crossover arrows of fast stochastic main line & fast stochastic signal line (

ALQANNAS (Sniper) Indicator Overview: Welcome to ALQANNAS, your ultimate sniper in the forex market! ALQANNAS is a powerful and versatile trading indicator designed to enhance your trading experience. Whether you're a beginner or an experienced trader, ALQANNAS provides you with accurate non repainting signals, trend direction and strength, and advanced features to elevate your trading strategy. Key Features: Buy and Sell Signals: ALQANNAS is equipped with a sophisticated algorithm that genera

QuantumAlert CCI Navigator is a free indicator available for MT4/MT5 platforms, its work is to provide "alerts" when the market is inside "overbought and oversold" regions in the form of "buy or sell" signals. This indicator comes with many customization options mentioned in the parameter section below, user can customise these parameters as needful. Join our MQL5 group , where we share important news and updates. You are also welcome to join our private channel as well, contact me for the pri
FREE

The indicator still has a few bugs but is ready for testing.
This is my first indicator that determines entry and exit points. The entry point is based on breaking the peaks determined by a channel indicating highs and lows (invisible channels). TP1 is a probable target at which most positions can be closed. The channel determining the opening and closing of positions is based on different assumptions. The red stop loss line is determined based on lows and highs.
The stop loss can be adjusted a
FREE

This indicator is a histogram showing the trend based on 3 different moving averages. When all averages are set in ascending order, the indicator is green, and when in descending order, it is red. If the averages do not show a trend, the color is yellow. Additionally, each average can have different settings, such as Mode MA and Price MA. You can also set an alert and receive notifications on your phone.
To enable the alert and push notification, you need to activate them first in the MT4 settin
FREE

The Cossover MA Histogram indicator is a simple tool showing the trend based on crossover of moving averages. Simply specify two mobving averages and addicional parameters like MA method and Applied price. When fast MA is above slow MA the histogram is green, indicating an uptrend. When MA fast is below MA slow the histogram is red, indicating an downtrend.
FREE

Are you searching for a tool that can uncover hidden market imbalances and guide your trading decisions? Look no further than the Fair Value Gap Indicator. This powerful tool acts as a magnet, pulling the price back to its starting point before making a move. By identifying these gaps on charts, you can take advantage of bearish bias trades and predict potential future price movements with greater accuracy. Created by a three-candle sequence, the Fair Value Gap Indicator is suitable for both bul

Just an excellent arrow indicator with 96 percent accuracy. It uses trend moving averages to detect trend direction change and alert with corresponding arrow. It does not repaint and the alert is optional on the basis of current bar or previous bar. Please this indicator is not responsible for every of your trading position and it must be used in conjunction with other indicators to make trading.

Introducing our cutting-edge product, an innovative MACD Oscillator with a dynamic level enhanced by a decimal point Moving Average (MA) also with the versatility of multiple moving average modes. This advanced trading tool brings precision and flexibility to your technical analysis, offering a seamless experience for traders seeking a competitive edge in the financial markets.
Key Features: Dynamic Level Precision Our MACD Oscillator is equipped with a dynamic level feature, providing traders

تمكين الصفقات الخاصة بك مع مؤشر الأمل الجيد تحقيق التكامل لنقاط دخول قوية إذا كنت تبحث عن طريقة لتحسين تداولك في الفوركس، فإن مؤشر الأمل الجيد موجود هنا لإرشادك. يتميز هذا المؤشر بقدرته على الدمج الفعال لمختلف المؤشرات المعروفة، مما يؤدي إلى نقاط دخول قوية وتحليل شامل للسوق. ما الذي يميز الأمل الجيد؟ <أ ط=0>1. تكامل المؤشر: تتفوق شركة Hope Good في استخدام مجموعة متنوعة من المؤشرات المعروفة ودمجها بشكل فعال، مما يوفر لك تحليلًا شاملاً للسوق. <أ ط=0>2. نقاط الدخول القوية: يعمل المؤشر على توليد نق
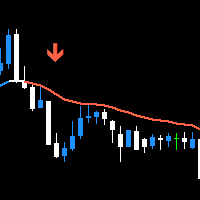
Trend Swift is the trend finding indicator that can estimate the trend volume for you. It help you seeking for the possible trend reversal so you can enter the trade with confident. Because it's indicator you can trade with your decision and really safe to use with any Prop Firms without worry about the rule that doesn't allowed to use EA to trade. This indicator isn't the the normal indicator that just blindly follow EMA, it's the trading system that surely find major trend with EMA but measur

TradingViewでInside Barを使用していて、Inside Barの検出が簡単で心地よいのに、MQL市場では見つからない場合は、ここで検索が終了します。 InsideBar Highlightの特徴: ABCのように簡単:Inside barsはシンプルに。当社のツールはローソク足の本体に焦点を当て、煩わしさなしに重要な情報が見えます。 あなたのスタイル、あなたの選択:カラフルが好きですか、すべて同じが良いですか? あなたが決める。上昇または下降の動きを楽に見つけます。 手袋のようにフィット:ハイライトは見せ物だけでなく、各ローソク足に完璧にフィットし、グラフをクリアで読みやすくします。 手を差し伸べる助け: 当社のツールの使用に関する課題や質問がある場合は、お気軽にお問い合わせください。メッセージは歓迎されており、必要なものは何でもお手伝いいたします。InsideBar Highlight 4は単なるツールではありません。質問や経験が重要なサポートコミュニティです。
FREE

重要なお知らせ – ライセンスとアクティベーションが必要です
アクティベーション手順:
購入が完了したら、すぐに弊社にご連絡いただき、ライセンスキー、パスワード、またはアクティベーションの詳細をお受け取りください。これらがなければ、ソフトウェアは動作しません。スムーズなアクティベーションプロセスを保証し、どんなご質問にもお答えするために私たちがサポートいたします。
多言語カスタマイズ
トレーディング体験を向上させるため、ソフトウェアを複数の言語で完全にカスタマイズするサービスを提供しています。弊社のチームは以下の言語で翻訳をご用意できます:
中国語 | フランス語 | ポルトガル語 | スペイン語 | ロシア語
日本語 | ドイツ語 | 韓国語 | イタリア語 | トルコ語
ご希望の言語をお知らせいただければ、ユーザーフレンドリーな体験を保証するため、インジケーターをカスタマイズいたします。
ボリュームプロファイル – 高度な市場分析ツール
ボリュームプロファイルは、トレーダーに市場のダイナミク

このコードは、もともとLuxAlgoによって他のプログラミング言語から公開されたものです。
このインジケータは、多くの取引目的に使用できる許容可能なトレンド予測能力を持っています:
このインジケータは、以前に掲載したNadaraya-Watsonスムーザーをベースにしています。ここでは、価格とエンベロープの両極端間のクロスから統合されたアラートを持つ、カーネル・スムージングに基づくエンベロープ・インディケータを作成しました。ナダラヤ・ワトソン推定量とは異なり、このインディケータは逆張り の手法に従っています。
デフォルトでは、このインディケータは再描画される可能性がある ことに注意してください。ユーザーは、設定から再描画しないスムージング方法を使用で きます。三角形のラベルは、このインディケータがリアルタイムのアプリケーショ ンで有用であり続けるように設計されています。 テスターでのバックテストでは、最初のローソク足500本が経過するまでお待ちください。これは、パラメータを計算するために過去のヒストリカルデータを使用するインディケータのテスターからの制限です。

バイナリオプションと外国為替"高速道路の利益"の指標は、チャネルラインの背後にある価格を見つけるという原則に基づいています。 価格がチャネルを離れ、徐々にそれに戻り始めた後、信号が表示されます。 そのような指標を取引することは非常に簡単で便利です。 そして、初心者のトレーダーや長年の経験を持つトレーダーでさえ、それを取引することができます。
アセットごとに独自の設定を選択する必要があります。 たとえば、変数"A_Period"に設定されているトレンドのバーを計算するための期間です。 トレンドは、チャネルの中央の線で示されます。 緑の色は購入を意味し、赤い色は販売を意味します。
また、"Range"変数で設定されている異なる取引セッションでチャネル幅を調整する必要があります。 その中のデジタル値が高いほど、チャンネルは広くなります。
さて、下の変数では、便利な矢印と線のパラメータを選択できます。 厚さ、バーからの矢印の距離、それらのコードと色。
矢印はリアルタイムでは描画されません。 彼らはバーからバーにジャンプして消えることはありません。 しかし、タイムスタンプを切り替えた後

インジケーターは他のプログラム言語からMQLに翻訳されています。RTIはチャートのトレンドをオシレーション的に識別する強力なツールです。
以下はオリジナル・プログラマーからのメモです:
概要 Zeiiermanによって開発されたRelative Trend Index (RTI)は、市場トレンドの強さと方向を測定するために設計された革新的なテクニカル分析ツールです。従来の指標とは異なり、RTIは市場のボラティリティに適応し、対応することができ、しかも短期的な市場変動の影響を最小限に抑えることができます。
Relative Trend Indexは、トレンドフォローと平均回帰の特性を融合させ、ト レ ン ド の 強 さ に 対 す る カ ス タ マ イ ズ 可 能 で 直 感 的 な ア プ ロ ー チ を 備 え て い ま す 。
RSIの代わりにこのRTIを使用する利点 相対力指数(RSI)と相対トレンド指数(RTI)は、どちらも強力なテクニカル指標で あり、それぞれに独自の強みがあります。 し か し 、特 に ト レ ン ド や 買 わ れ 過 ぎ / 売 ら れ
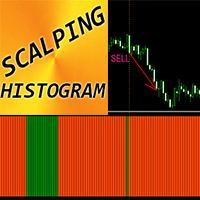
Crypto_Forex インジケーター「スキャルピング ヒストグラム」MT4 用、リペイントなし。
- スキャルピング ヒストグラム インジケーターは、マイナーな価格修正後の価格モメンタムの主な方向へのエントリー シグナルの検索に使用できます。 - スキャルピング ヒストグラムは 2 色で表示されます。弱気のモメンタムの場合はオレンジ、強気のモメンタムの場合は緑です。 - 同じ色のヒストグラム バーが 10 本以上連続して表示されると、強いモメンタムが発生していることを意味します。 - エントリー シグナルは、ヒストグラムで反対色の 1 列と、最初のモメンタム色で表示される次の列です (画像を参照)。 - スキャルピング ターゲットを使用 - チャート上の最も近い高値/安値。 - インジケーターには、モバイルおよび PC アラートが組み込まれています。
インジケーターの使用方法: - 買いシグナルの場合: 少なくとも 10 本の連続した緑のヒストグラム バー (モメンタム) + ヒストグラム上の 1 本のオレンジ色のバー (修正) + 1 本の緑のバー (ここでロング トレード

Level Breakout Indicator is a technical analysis product that works from upper and lower boundaries, which can determine the direction of the trend. Works on candle 0 without redrawing or delays.
In its work, it uses a system of different indicators, the parameters of which have already been configured and combined into a single parameter - “ Scale ”, which performs gradation of periods.
The indicator is easy to use, does not require any calculations, using a single parameter you need to select

This is the best Support and Resistance Indicator on the market, and it shows both confirmed Support and Resistance as well as Retests. Support & Resistance: Support marks where buying demand halts price declines, acting as a safety net. Resistance caps price surges, driven by selling pressure. Traders leverage these levels to predict reversals, plan entries, exits, and manage risks, making them trading's fundamental guideposts. Join To Learn Market Depth - https://www.mql5.com/en/channels/suv
FREE

Indicator is converted from another programming language code by programmer " sbtnc ". MQL version is simplified to be more useful by less settings complexity. There is some clues from programmer about indicator: The indicator tracks and reports the percentage of occurrence of daily tops and bottoms by the time of the day. At certain times during the trading day, the market reverses and marks the high or low of the day. Tops and bottoms are vital when entering a trade, as they will decide if y
FREE

Introducing ISIS SCALPER for MetaTrader 4: Innovation Beyond the Traditional! Discover the future of trading strategies with our innovative indicator, carefully designed to transcend the limitations of conventional products. This is not just another indicator, but a flexible and powerful tool that empowers traders to explore the full potential of the market. Exceptional Features: Unlimited Versatility: Designed to adapt to any asset and time frame, our indicator allows you to create custom strat

TREND HARMONY MT4 – Multi Timeframe Trend and Phase and Pullback Level Visualizer indicator for Metatrader4 The TREND HARMONY indicator automates deep trend analysis and generates visualizations for you. Take control of your trades by eliminating uncertainty! Revolutionize your trading experience with precision and insight through the TREND HARMONY Multi Timeframe Trend Indicator – your ultimate MT4 trend visualization indicator. Are you tired of missing trading opportunities or consistently e
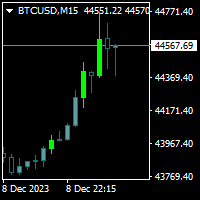
Trendfinder MA Pro are based on Colored candlesticks showing the trend based on two Moving Averages as Signal and two Moving Averages as a Buy and Sell Zone, the slope of the slow Signal moving average and ATR and Volume increasing. This indicator will give you the color change on the next bar on the confirmation candle and will provide alert on Buy and sell signal, when it enters the buy and sell zone and when the market test the buy or sell zones as support or resistance and will never repain
FREE

The "Trend Edges" indicator determines whether the trend is rising or falling. It is suitable for any time frame (tested on DAX).
The indicator should be treated like Bollinger Bands, meaning that if it breaks out upwards, you can buy with a stop loss below the lower edge.
Find a trending pair, index or CFD. Additionally :
-Sound alert on trend change.
-Alert Notification
-Alert Notification on your mobile phone Check my other indicator "Trend Edges histogram"
FREE

This indicator is not only for trading but also for learning, thanks to it, you can learn to identify trend, support and resistance.
You've probably heard about the Dow trend theory, where higher highs and higher lows indicate an uptrend, and lower highs and lower lows indicate a downtrend. This indicator determines this trend based on the Dow Theory. You just need to enter a number representing the number of candles between extremes. The optimal solution is the number 3 (H1 TF), unless you wa
FREE

This indicator is an addition to "Trend Edges."
The "Trend Edges histogram" indicator determines whether the trend is rising or falling. It is suitable for any time frame (tested on DAX).
Find a trending pair, index or CFD. Additionally :
-Sound alert on trend change.
-Alert Notification
-Alert Notification on your mobile phone Check my other indicators.
FREE

Arrow signal indicator for scalping Has three sensitivity levels
Quickly detects changes in price direction and provides signals to open positions Equipped with built-in audio and visual alerts about trend changes. Can send notifications to a smartphone or email. Works on all timeframes, all currency pairs, metals, indices and cryptocurrencies. Can be used when working with binary options.
Distinctive features Does not redraw; Three sensitivity options; Three types of alerts; Simple and clea

Pivots Indicator Traders have been using this indicator for a long time, but the main difference or might better call it betterment applied to well known pivots indicator is that you can change how the pivot can be illustrated. There are two ways to get the pivots on the chart. you can use either number of candles or the movement of the market using points of retracement. you can find out more on the video. furthermore pivots lines can be drawn to see the possible support and resistance prices w

You've probably heard about the Dow trend Theory, where higher highs and lows indicate an uptrend, and lower highs and lows indicate a downtrend. This indicator determines this trend based on the Dow Theory. You just need to enter a number representing the number of candles between extremes. The optimal solution is the number 3, unless you want to have the trend from M5 but you're on M1, then you need to multiply this number by 5. Check various combinations to trade with the trend. In the scree
FREE

CycleView is an indicator that highlights possible phases of expansion and contraction in the different time frames, it helps to highlight the correct timing to make the entry. The cycle can be changed via external settings. After installing the indicator, you can contact me by message for the best settings and time frames to use.
The indicator works by analyzing the price action. When the indicator is downloaded, you need to move the EX4 file from "Market-Expert" to "Market-indicator".

Just another plain Super Trend indicator.
On this one i have added another buffer (on index 2) which can be used on EA; the values is -1 to identify a bearish trend while for bullish trend the value is 1.
Here a code snippet:
int trend = ( int ) iCustom ( NULL , Timeframe, "SuperTrend" , Period , Multiplier, 2 , 1 ); It work on every timeframe.
If you need help to integrate it on your EA, don't hesitate to contact me.
FREE

The Starting Points indicator for MetaTrader 4 is a technical analysis tool that shows the monthly, weekly, and daily starting points, as well as the 1000-point and 500-point levels, in the forex market. The indicator is displayed as a series of horizontal lines that represent the starting points and levels. Benefits of Using the Starting Points Indicator Identify potential trend changes: The Starting Points indicator can help traders identify potential trend changes by highlighting areas wher
FREE

up down stars indicator is no repaint indicator. it hold long way to signals. suitable all pairs and all timeframes. it needs at least 1000 bars on charts. 1 is critical level for signals. if red line reach 1 it gives red star to sell.. if blue line reach 1 it gives blue star to buy.. signals comes mostly exact time. sometimes lower timeframes it makes consecutive signals.

QuantumAlert RSI Navigator is a free indicator available for MT4/MT5 platforms, its work is to provide "alerts" when the market is inside "overbought and oversold" regions in the form of "buy or sell" signals. This indicator comes with many customization options mentioned in the parameter section below, user can customise these parameters as needful. Join our MQL5 group , where we share important news and updates. You are also welcome to join our private channel as well, contact me for the pri
FREE

QuantumAlert Stoch Navigator is a free indicator available for MT4/MT5 platforms, its work is to provide "alerts" when the market is inside "overbought and oversold" regions in the form of "buy or sell" signals. This indicator comes with many customization options mentioned in the parameter section below, user can customise these parameters as needful. Join our MQL5 group , where we share important news and updates. You are also welcome to join our private channel as well, contact me for the p
FREE

This indicator allows you to overlay three different moving averages on the chart simultaneously. Each of these moving averages has additional settings such as: -Time frame
-Shift
-MA method
-Applied price
Using this indicator, you can easily set up three moving averages and find the one that suits you the best. You can also use this indicator to determine the trend when the moving averages cross.
FREE

FusionAlert StochRSI Master is an indicator available for MT4/MT5 platforms, it is a combination of RSI & Stochastic indicator which provide "alerts" when the market is inside "overbought and oversold" regions combined for both indicators, results in more precise and accurate signals to be used as a wonderful tool, in the form of "buy or sell" signals. This indicator comes with many customization options mentioned in the parameter section below, user can customise these parameters as needful. Jo
FREE
WONNFX iSTATS - information indicator showing profit/loss on your MT4 account (pips, lots, currency, percentage) current profit profit for today profits for the current week profits for the current month profit for the current quarter profit for the current year
A convenient format for displaying statistics of your trading account in real time. (the indicator can be installed on any MT4 terminal chart)
FREE

This indicator will show yesterday and today high low, very useful to understand the market sentiment. To trade within the range/ break out. Previous day low- can act as support- can used for pull back or break out Previous day high- can act as resistance- can used for pull back or break out The previous day high low breakout strategy refers to the day trading technique that provides traders with multiple opportunities to go either long or short . The main idea is to identify the trend in its m
FREE

The risk-to-reward ratio is used for assessing the potential profit (reward) against the potential loss (risk) of a trade. Stock traders and investors use the R/R ratio to fix the price at which they'll exit the trade, irrespective of whether it generates profit or loss. A stop-loss order is generally used to exit the position in case it starts moving in an opposite direction to what a trader anticipated.
The relationship between the risk and reward helps determine whether the potentia
FREE

ADX MA: The Ultimate Trend Strength Guide
In forex trading, the Average Directional Index (ADX) is a vital indicator for gauging trend strength. Here's a streamlined approach to using ADX for effective trading:
1. Add ADX to your forex chart. 2. Interpret ADX values: <20 is weak, >40 is strong. 3. Identify trend direction: +DI above -DI indicates an upward trend, and vice versa. 4. Execute trades based on ADX and trend: Strong up trend, consider buying; strong down trend, consider selling; we

Overview Automated smart money market structure identification following smart money concept and inner circle trader concept, it gives an unprecedented edge on your smart money and market structure analysis by automatically identifies valid market structure using smart money concept: Identify impulsive and corrective moves Identify valid pullbacks built by impulsive and corrective market moves Idenitfy bearish or bullish leg and their inducements for smart money concept Identify valid market st
MetaTraderマーケットは、履歴データを使ったテストと最適化のための無料のデモ自動売買ロボットをダウンロードできる唯一のストアです。
アプリ概要と他のカスタマーからのレビューをご覧になり、ターミナルにダウンロードし、購入する前に自動売買ロボットをテストしてください。完全に無料でアプリをテストできるのはMetaTraderマーケットだけです。
取引の機会を逃しています。
- 無料取引アプリ
- 8千を超えるシグナルをコピー
- 金融ニュースで金融マーケットを探索
新規登録
ログイン