DynamicCOG Mt4
- インディケータ
- バージョン: 1.10
- アップデート済み: 26 1月 2025
- アクティベーション: 5

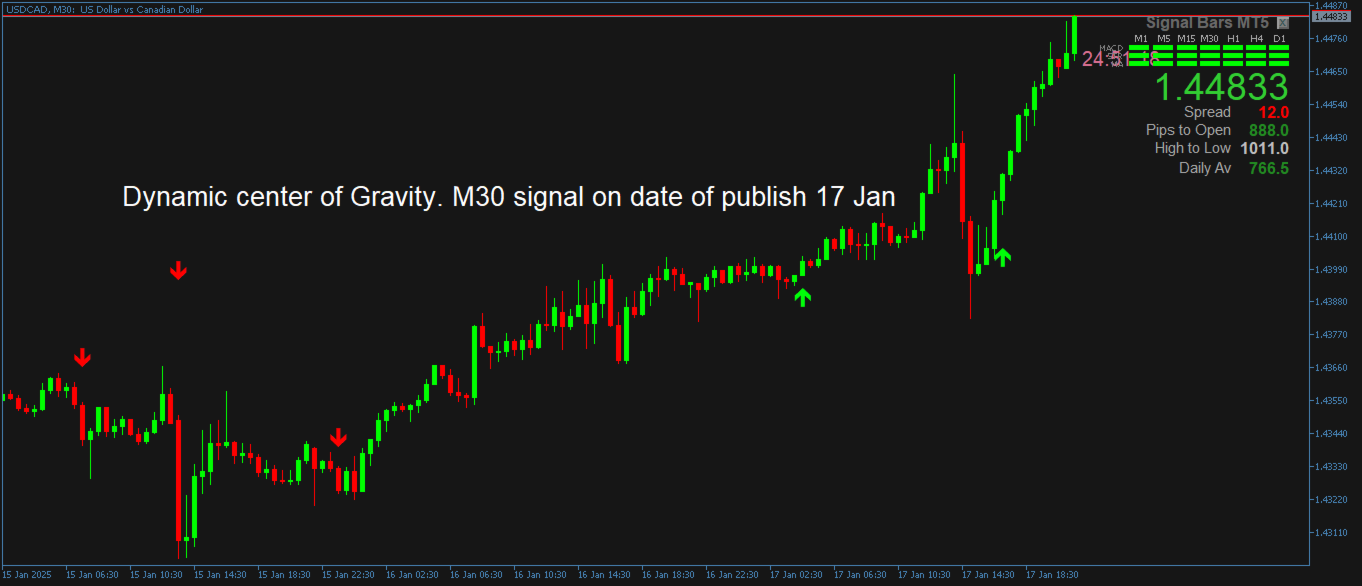
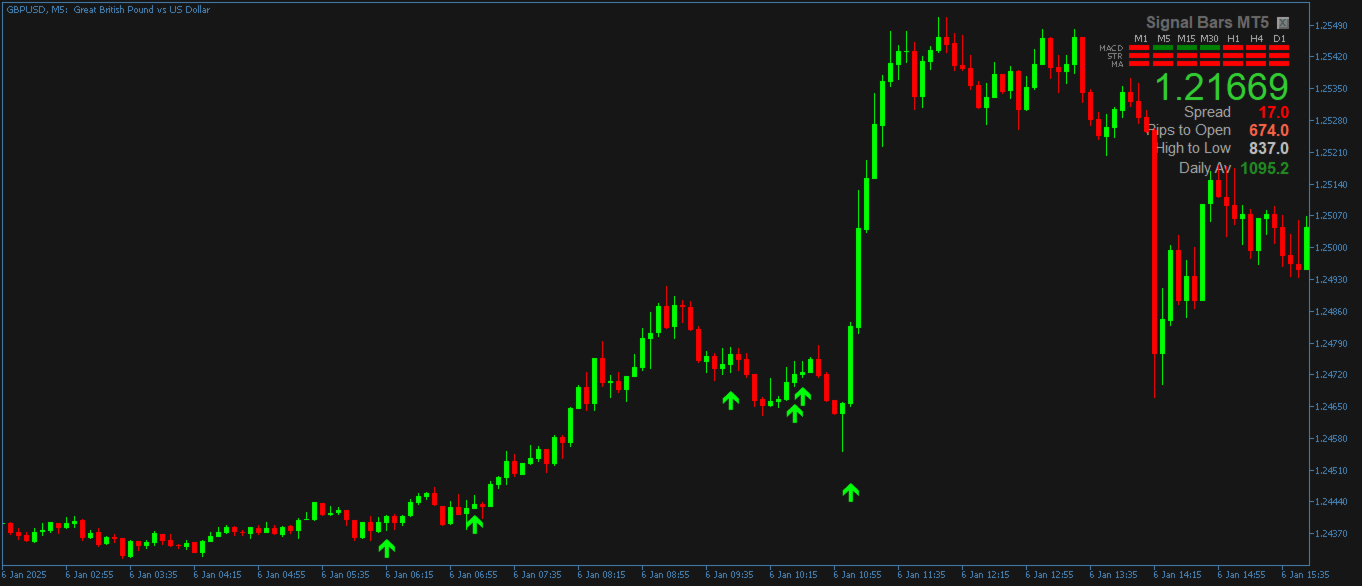
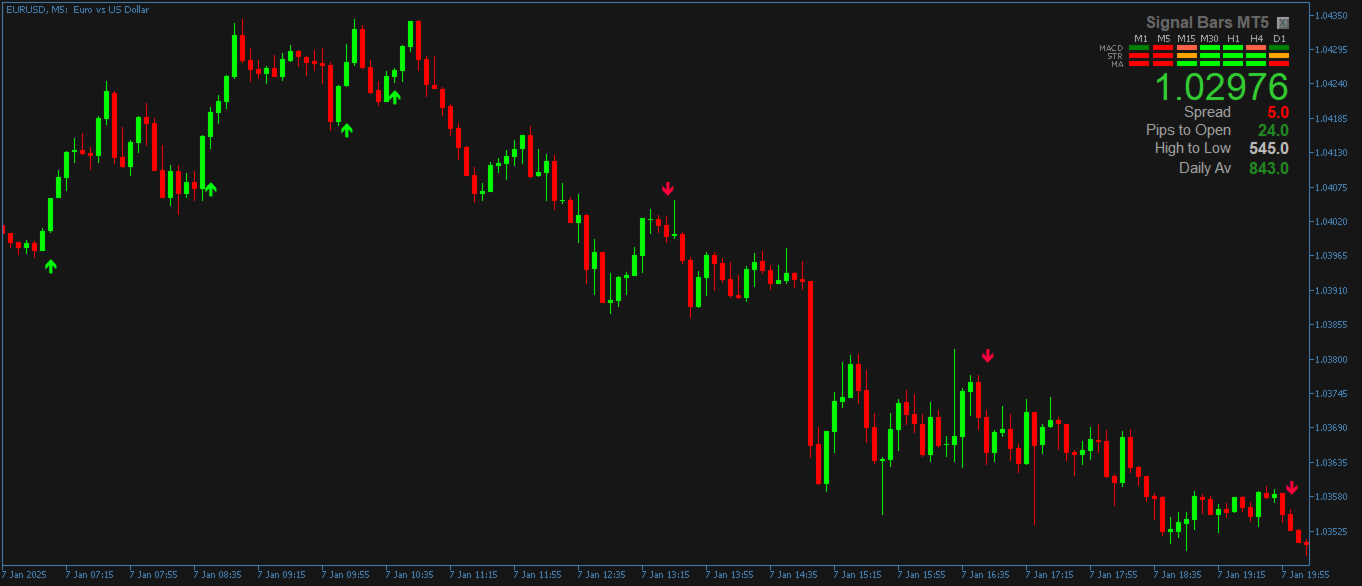
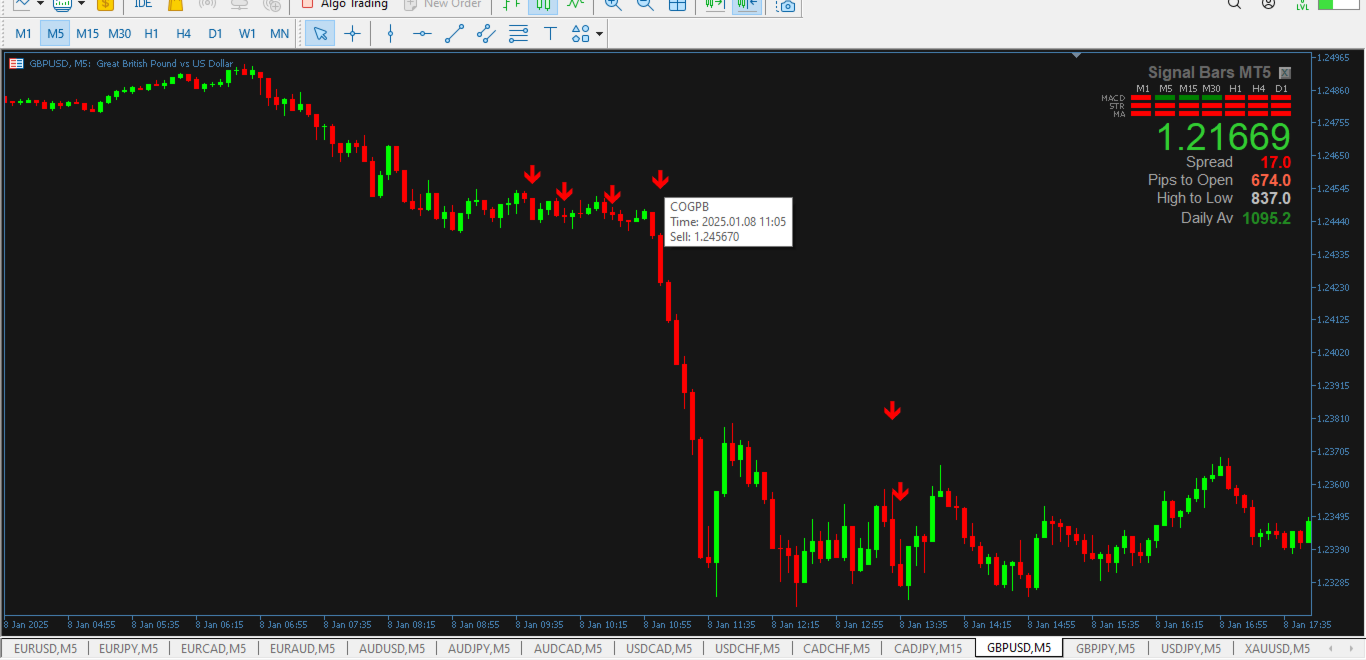
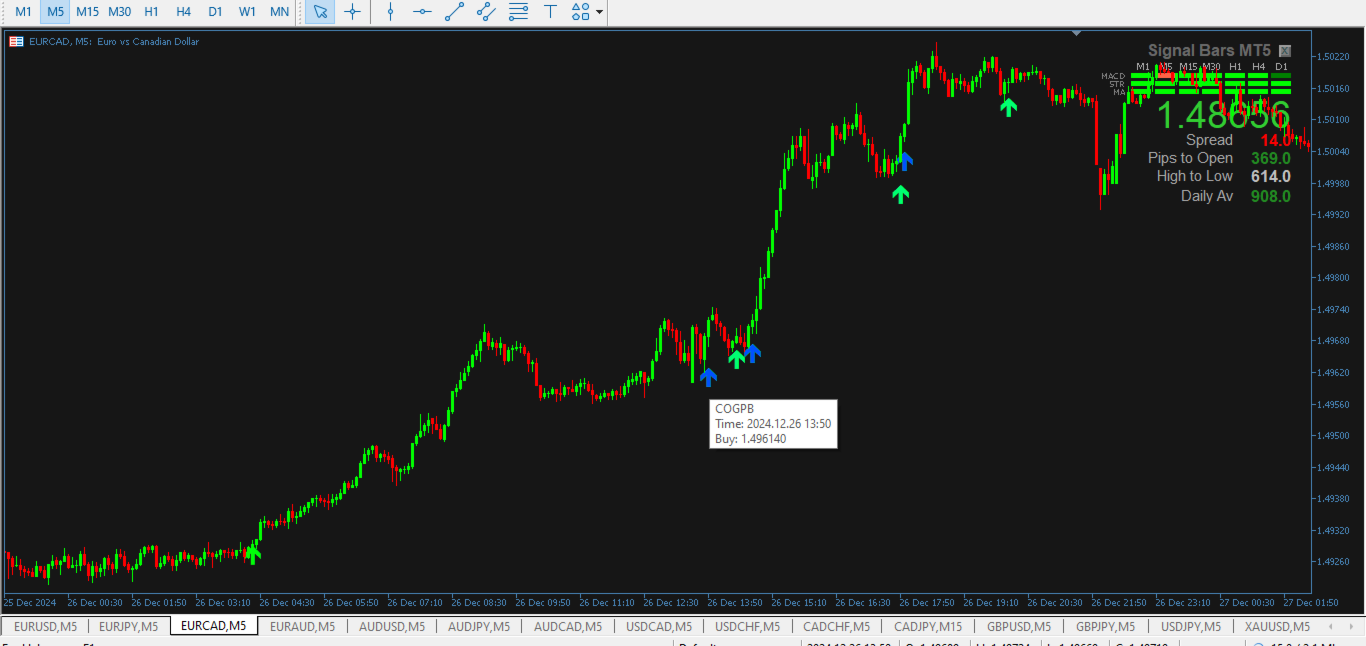
Dynamic Center of Gravity Indicator
Revolutionary Price Action Trading System
Harness the power of price momentum with the Dynamic Center of Gravity indicator - an advanced price action trading tool designed for serious traders. This innovative indicator identifies powerful gravity zones that attract rapid price movements, creating high-probability trading opportunities when momentum breaks free from these zones.
Key Features
- Pure price action analysis - no lagging indicators
- Works effectively across all timeframes.
- Compatible with multiple trading instruments:
- Binary Options
- Forex
- Derivatives
- Automated trading capability through JesVersal Universal EA integration
- Professional setup and optimization support included
Perfect For
- Binary Options traders seeking precise entry points
- Forex traders looking for momentum-based strategies
- Traders who prefer clean, price-action based analysis
- Both manual and automated trading systems
Optimal Trading Hours
Trading is recommended during peak market hours: 12:00 AM - 7:00 PM GMT+0 (UK time)
Package Includes
- Dynamic Center of Gravity Indicator
- Detailed setup instructions
- Direct access to optimization support
- Compatible with JesVersal Universal EA (sold separately)
System Requirements
- MetaTrader 4 or 5 Platform
- Stable internet connection
- Compatible with all major brokers
For automated trading implementation, get the JesVersal Universal EA: https://www.mql5.com/en/market/product/126819
MT5 version here: https://www.mql5.com/en/market/product/130519
Contact us for personalized setup assistance and optimization settings to maximize your trading potential.