 MetaTrader 5
 エキスパート
 インディケータ
 ライブラリ
ライブラリ
 ユーティリティ
 ウィジェット
 ルール
ルール
YouTubeにあるマーケットチュートリアルビデオをご覧ください
ロボットや指標を購入する
仮想ホスティングで
EAを実行
EAを実行
ロボットや指標を購入前にテストする
マーケットで収入を得る
販売のためにプロダクトをプレゼンテーションする方法
MetaTrader 4のための無料のエキスパートアドバイザーとインディケータ - 11
 自動売買ロボットは市場取引を自動的に実行しますが、インジケータを使用すると、相場をより適切に分析し、価格行動を予測できます。
これらのアプリケーションを使用すると、より多くの機会を獲得しながら、より多くの情報に基づいた方法でMetaTrader4で取引を実行できるようになります。
自動売買ロボットは市場取引を自動的に実行しますが、インジケータを使用すると、相場をより適切に分析し、価格行動を予測できます。
これらのアプリケーションを使用すると、より多くの機会を獲得しながら、より多くの情報に基づいた方法でMetaTrader4で取引を実行できるようになります。 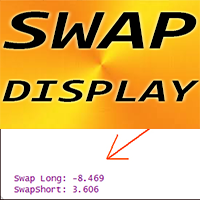
これは無料でご利用いただける製品です。お客様のニーズに合わせてご利用ください。
このインジケーターが気に入ったら、ぜひ短い肯定的なフィードバックを残してください!ありがとうございます!
高品質のトレーディングロボットとインジケーターをご覧になるにはここをクリックしてください!
MT4 用 Forex インジケーター SWAP 表示、優れた補助取引ツール。 Click here to MT5 version! ................................................................................. - SWAP 表示インジケーターは、それが接続されている Forex ペアのロング トレードとショート トレードの現在の SWAP を表示します。 - SWAP 表示の値は、チャートのどのコーナーにも配置できます. - 色とフォント サイズも設定できます。 - トレードを 1 日以上オープンにしておく場合、各トレーダーは SWAP を知っておく必要があります。 これは、この MQL5 Web サイトでのみ提供
FREE
Necessary for traders: tools and indicators Waves automatically calculate indicators, channel trend trading Perfect trend-wave automatic calculation channel calculation , MT4 Perfect trend-wave automatic calculation channel calculation , MT5 Local Trading copying Easy And Fast Copy , MT4 Easy And Fast Copy , MT5 Local Trading copying For DEMO Easy And Fast Copy , MT4 DEMO Easy And Fast Copy , MT5 DEMO 砖图Renko PRO->>>
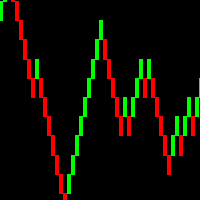
The display of the brick map on the main map.
The Renko chart ideally remove
FREE

The indicator synchronizes eight types of markings on several charts of one trading instrument.
This indicator is convenient to use in conjunction with "Multichart Dashboard" or other similar assistant that allows you to work with several charts at the same time.
"Multichart Dashboard" can be found under the link on my youtube channel.
Settings:
enable vertical line synchronization
enable horizontal line synchronization
enable Trend Line synchronization
enabling Fibonacci Retracement synchron
FREE

Time your Entry and Exits with Average True Range (ATR) Trailing Stops ATR Trailing Stops are primarily used to protect capital and lock in profits on individual trades but they can also be used, in conjunction with a trend filter, to signal entries. The indicator will help make your calculation of stop loss easier as it will be visually aiding you in choosing where to put your stoploss level on the chart by calculating the current value of ATR indicator. For those who are unfamiliar with ATR, i
FREE

This indicators automatically draws the Support and resistances levels for you once you've dropped it on a chart. It reduces the hustle of drawing and redrawing these levels every time you analysis prices on a chart. With it, all you have to do is dropped it on a chart, adjust the settings to your liking and let the indicator do the rest. But wait, it gets better; the indicator is absolutely free! Get the new and improved version here: https://youtu.be/rTxbPOBu3nY Parameters Time-frame -> T
FREE

Easy Lot Size Calculator Stop calculating lot sizes manually and start trading visually.
Automatic position lot size calculator for MT4 (MT5 also available)
The Easy Lot Size Calculator is the ultimate trade management dashboard. It is designed for traders who need speed, precision, and strict risk management. Whether you are a scalper needing split-second execution or a swing trader demanding exact risk percentages, this EA handles the math so you can focus on the chart. Why Use This Calcu
FREE

この製品は、ブローカーサーバーのタイムゾーンに基づいて15か国の取引セッションを表示するように設計されており、希望の設定に基づいたさまざまな表示モードにより、チャートの混雑を防ぎ、ユーザーの希望の時間でセッションを設定することが可能です。
外国為替市場に太陽が沈むことはありませんが、そのリズムは独特の取引セッションのビートに合わせて踊ります。これらのセッション、それらの重複、およびその独特の雰囲気を理解することは、市場に逆らうのではなく、市場とともに動きたい外国為替トレーダーにとって非常に重要です。
Tokyo China London Canada New York Moscow Saudi Arabia ... USDJPY *** *
***
AUDJPY ***
NZDUSD *
***
EURAUD
**
GBPUSD
***
***
EURCHF
***
USDCHF
*
***
GBPJPY *** ***
FREE
M1Arrows is a MT4 trend arrows Indicator
* Smart Scalper Setup (M1) :: Signal 5 Main 20 + Signal 20 Main 80 + Fibonacci ZigArcs 20
(Screenshot1) Add the indicator with first setting,
then add it again to the same graph with other settings.
You can add as many as you want, but 2 M1Arrows in just one graph is enought
Never open orders againt the slow setting trend
Do not open more than 3 orders per slow setting trend
It will work better in Europe/USA markets, * M15 Day Trade Setup: Signal 20 ma
FREE
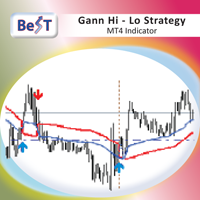
BeST_Gann Hi-Lo Strategy is an MT4 indicator that is based on the Gann Hi-Lo Activator the famous trend-following indicator that allow us to to enter a trade quite early while also stay in a trade as longer as we can for taking profit.While it is built of a moving average it helps traders determine the direction of the trends and to produce with-trend trading signals.
This indicator is in fact a simple moving average of the highs and lows of the previous period. It follows the trends in the mark
FREE

Trex – トレンド検出およびエントリーシグナルインジケーター Trexは、トレーダーが市場のトレンドと正確なエントリーポイントを高い視認性で識別できるように設計された、強力でありながらシンプルなトレンドフォロー型インジケーターです。 Trexは、ボリンジャーバンドと移動平均線の傾き分析を基に、スマートな外部フィルターと組み合わせることで、可能な限り悪いシグナルを減らし、全体的な取引精度を向上させます。 このインジケーターはトレンド取引に重点を置き、不要な複雑さを避けているため、初心者からプロのトレーダーまで幅広くご利用いただけます。 より良く、プロフェッショナルなツールを見つける方法: 参加する Koala Trading Solution チャンネル に参加して、MQL5コミュニティでKoala製品の最新情報を入手しましょう 100人以上のトレーダーに信頼されている私の最高のインジケーター Market Structure Break Out MT4をダウンロード MT5をダウンロード 主な特徴 トレンド検出システム
Trexは現在の市場トレンドを自動的に検出し、明確なト
FREE

SuperTrend Signal Alerts MT4 is a free SuperTrend indicator for MetaTrader 4. It colours the trend line blue or red, puts a buy or sell arrow on every trend change and sends alerts, with optional EMA and RSI filters on the arrows. It places no trades and does not touch your orders. Arrows and alerts come from closed bars, so a signal never appears and then disappears. The calculation follows the SuperTrend indicator as published on TradingView. Standalone: everything is built in. You do not need
FREE

Heiken Ashi Smoothed A two-stage smoothed Heiken Ashi indicator that filters out market noise for clearer trend reading. What it does Heiken Ashi Smoothed applies a two-stage moving average process on top of the classic Heiken Ashi formula. First, the raw price data is smoothed with a moving average; the Heiken Ashi candles are then built from that smoothed price. A second moving average pass smooths the resulting candles again, producing a cleaner, calmer picture of trend direction with fewer f
FREE

ATSCStrategy is a versatile indicator designed for both binary options and forex markets. Empower your trading strategies with this dynamic tool, providing valuable insights for making informed decisions in the fast-paced world of binary options and forex trading.
-Forex Market
-Binary Option Market
-Binary use timeframe 1M - 5M
-Forex use timeframe M30 or high
FREE

Advanced SMC & Volumetric Order Block Indicator Overview
This enhanced-grade for MetaTrader 5 indicator is designed to decode market behavior using Smart Money Concepts (SMC) method . It goes beyond standard price action analysis by integrating Volumetric Data directly into market structure, helping traders identify high-probability reversal and continuation zones with precision. Key Features Volumetric Order Blocks: A unique, split-gauge visualization within Order Block zones tha
FREE

The UZFX - Close All Open Buy & Sell Orders Instantly script for MetaTrader 4 (MT4) is a powerful tool that enables traders to immediately close all active market positions with a single execution. This script is ideal for emergency trade management, helping traders quickly exit the market during high volatility, news events, or strategy adjustments. If you are Looking Best indicators in Mql5 Market. Check these out!
SSS Scalping Smart Signals MT5 Indicator
Scalping Winning Signals Pr
FREE

Free indicator, that displays the remaining time until the current candle closes directly on the chart. Designed for traders who demand precision and timing, this lightweight and fully customizable tool enhances your trading experience. It is easy to install, compatible with all assets, markets, and timeframes, and provides real-time updates to support smarter decision-making.
FREE

SnR Trend Direction MT4 by RWBTradeLab
A clean, non-repainting multi-timeframe trend dashboard for MetaTrader 4 that tells you the REAL trend direction — detected the classical SnR way. No moving averages, no oscillators: the trend is derived purely from classical Support/Resistance behavior (level creation, rejection and confirmed breakouts), exactly how a classical SnR trader reads the market by hand.
What This Indicator Does
The indicator shows the confirmed trend direction (Bullish / Bea
FREE
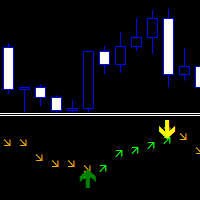
Direction Change Detector - 強気の動きと弱気の動きのバランスを分離するトレンドインジケーター。方向を確認する信号が付いた 2 列の矢印があります。
トレンドを見つけるためのスタンドアロンインジケーターとして、または取引を開始してシグナルの方向に従うための追加ツールとして機能します。
あらゆる市場と時間枠に適応します。 歴史に彼の証言を塗り替えることはない。 通知にはいくつかの種類があります。 上向きの緑の矢印は、価格が強気の方向であることを示します。 下向きのオレンジ色の矢印は、価格が弱気な方向であることを示しています。 読み取り値を変更するためのカスタマイズ可能なパラメータが 1 つあります。方向の数が増えると、価格はよりスムーズになり(低いタイム フレームに使用)、方向の数が減ると、価格はより早くなります(高いタイム フレームに使用)。
Length Directions - 方向の変化を計算するためのローソク足の数。
FREE
チャネルインジケータはトレンドであり、再描画されません。 反対のボラティリティ境界を持つATR価格チャネルを作成します。 この指標は、インパルスレベルと偽のブレイクアウトで取引する戦略で十分に証明されています。 指標線の修正でエントリポイントを探し、反対側の境界にテイクプロフィットを設定する必要があります。 Blog-Link - Retest and Fake Breakout with UPD1 。
入力パラメータ 。
Bars Count - 表示する履歴 。 ATR - 計算期間 。 Coefficient - 動的価格チャネルの高さに影響を与える係数 。
Visual Channel - 一行または二行表示 。 Simple Line Visual Width - 単純な線の太さ 。 Simple Line Buy Color - シンプルなラインカラー Buy 。 Simple Line Sell Color - シンプルなラインカラー Sell 。
Reverse Channel - 反対のチャンネルを表示するかどうか 。 R
FREE
This is a powerful, session-aware breakout indicator designed for serious traders who thrive on volatility and structure. Engineered for precision, it identifies high-probability breakout zones during the London and New York trading sessions—where the market moves with intent. Key Features: Session Range Detection
Automatically detects and highlights the key price range of London and New York sessions. Breakout Confirmation
Identifies breakout candles after the session range, with cl
FREE

Blahtech VWAP - Volume Weighted Average Price (VWAP) is the ratio of price to total volume. It provides an average price over a specified time interval. Links [ Install | Update | Documentation ] Feature Highlights
Configurable VWAP Line Sessions, intervals, anchored or continuous Previous day settlement line Standard Deviation bands Alerts at bar close or real time Automatic Broker or Tick volumes Significantly reduced CPU usage
Input Parameters
Expert Advisor Mode - Reserved for iC
FREE

Smart Session Breakout MT4 — Precision Range Accumulation & Volatility Expansion Signals
Markets spend part of the day building a range and part of the day leaving it. This indicator draws the range of a session you choose, keeps its high and low on the chart as levels, and marks the bars that close outside it.
That is the whole scope. It is a way of seeing session structure, not a trading system, and it does not tell you when to buy or sell.
What it does:
- Draws the high and low of your c
FREE

YOU CAN NOW DOWNLOAD FREE VERSIONS OF OUR PAID INDICATORS . IT'S OUR WAY OF GIVING BACK TO THE COMMUNITY ! >>> GO HERE TO DOWNLOAD
This system is an Heiken Ashi system based on RSI calculations . The system is a free open source script originally published on TradingView by JayRogers . We have taken the liberty of converting the pine script to Mq4 indicator . We have also added a new feature which enables to filter signals and reduces noise on the arrow signals.
Background
HEIKEN ASHI
Th
FREE

ハーモニックパターンは市場の転換点を予測するのに最適です。これらのパターンは高い勝率と1日の中での多くの取引機会を提供します。当社のインジケーターは、ハーモニックトレーディングの原則に基づいて、市場反転ポイントを予測する最も一般的なハーモニックパターンを特定します。 重要な注意事項: インジケーターは再描画されず、遅れることはありません(パターンはDポイントで検出されます);再描画されることはありません(パターンは有効またはキャンセルされます)。 使用方法: インジケーターをMT5チャートにドラッグアンドドロップします。 パターン検出をTRUE(ABCD;Gartley)に設定します。 任意のデバイスを設定します(高いデバイス=より多くのパターン;低いデバイス=より少ないパターン)。 好みに合わせて色を調整します。 バルブ/エントリーポイント、TP、SLの警告を有効または無効にします。 パターンが検出された場合: アルゴリズムはDポイントでパターンを検出します。 警告が有効になっている場合、パターン検出を通知します。 パターンが無効になった場合、「パターンがキャンセルされました」という
FREE

Now free!
Discover the Expert Advisor that never loses and multiplies your profits at lightning speed! Imagine a trading tool that wins at every tick, leaving no room for loss. That’s exactly what our Expert Advisor offers: a cutting-edge algorithm designed to provide you with consistent and rapid profits! Thanks to its market intelligence, it constantly opens positions, capturing every opportunity to maximize your gains. The more you use it, the faster you’ll see your profits skyrocket. Why
FREE

このインジケーターは、重要なサポートラインやレジスタンスラインのブレイクアウトに基づいてトレンドを判定する、先進的な分析ツールです。
価格が特定の水準を突破したときにシグナルを発することで、トレーダーは明確な方向性を把握しやすくなり、エントリーのチャンスを逃さず捉えることができます。 従来の複雑なインジケーターとは異なり、このツールは設定項目が1つだけ。
そのため、どのような通貨ペアや銘柄に対しても迅速に適応し、最小限の調整で最大のパフォーマンスを発揮します。
例えば、ドル円、ユーロドル、ゴールド、株価指数など、幅広い市場に柔軟に対応でき、余計な最適化作業を省くことが可能です。 さらに大きな特徴は、リペイントを一切しないという点です。
これは一度確定したシグナルが後から変わることがないという意味であり、信頼性の高いシグナルを得られることを保証します。
特に短期トレードやスキャルピングでは「正確さ」と「スピード」が重要ですが、このインジケーターはその両方を兼ね備えています。 通知機能も充実しています: モバイル PUSH 通知 – 外出中でもリアルタイムでシグナルを受信可能。 デスク
FREE

GAMBLERS Games Changer – 20 Pairs in One, Prove it! Is trading gambling??? Yes, if you realize that forex and capital market trading almost entirely resembles gambling. Within seconds, you can become wealthier—or lose everything just as quickly. This undeniable fact sparks endless debates. Some argue trading is just normal commerce with profit and loss, but statistics reveal that over 95% of traders suffer massive losses , while only about 5% manage consistent wins—mostly dominated by globa
FREE

Impulse System MTF は、Alexander Elder が示した Impulse System に従ってチャート上のローソク足を色分けするインジケーターで、その色分けを表示中の時間足ではなく上位の時間足から取得することもできます。Impulse System はトレンドの尺度と勢いの尺度をひとつずつ組み合わせています。終値の指数移動平均と、MACD のヒストグラムです。両方が上昇していれば緑、両方が下降していれば赤、両者が一致しない場合は青になります。
この三つの状態が役に立つのは、Elder がそれらに与えた役割によります。Impulse System はシグナルを生み出す仕組みではなく、禁止するための仕組みです。緑は買えという意味ではなく、強気側がトレンドと勢いの両方を握っているあいだ売りが禁じられているという意味です。赤は売れという意味ではなく、買いが禁じられているという意味です。青はどちらも market を支配しておらず双方向が許されている状態で、実際の相場ではトレンドが終わり、また始まる場所にあたります。このように読めば、色分けはすでにお使いのエントリ
FREE

This tool is designed to measure the distance between two points on a chart and much more.
List of measured values:
Distance in points Profit (with and without spread) Time difference Percentage price change Slope angle Number of bars (various variations) Ratio of distance in points to the reference value Features:
Snap to OHLC prices Automatic color profile setting based on chart background color Various types of pointers to choose from Display of values of selected points on th
FREE

取引の精度を高める WH トレーディングセッション MT4 MetaTrader 4 のインジケーター! この強力なツールは、主要な市場セッションを簡単に視覚化して管理するのに役立ちます。 ベース: WH SMC インジケーター MT4
MT5 バージョン: WH トレーディングセッション MT5 主な特徴: インタラクティブ GUI パネル – 簡単に選択して切り替える アジア、ロンドン、ニューヨーク 取引セッション。
カスタマイズ可能なアラートと設定 – 直感的に操作できるインジケーターで戦略に合わせてカスタマイズ オプションタブ 。
高速で応答性の高いインターフェース – スムーズな体験をお楽しみください 移動可能、最小化可能、最大化可能なパネル 。
自動 GMT オフセット処理 – 手動調整は不要です。セッションは常に市場時間に合わせて調整されます。
トレーディングセッション で市場動向を先取りし、取引の決定を最適化しましょう
FREE
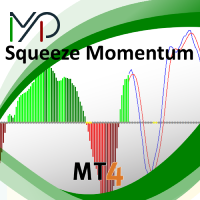
MP Squeeze Momentum is a volatility and momentum indicator derivated of "TTM Squeeze" volatility indicator introduced by John Carter. It capitalizes on the tendency for price to break out strongly after consolidating in a tight range. Introduction: The volatility component of MP Squeeze Momentum measures price compression using Bollinger Bands and Keltner Channels. If the Bollinger Bands are completely enclosed within the Keltner Channels, that indicates a period of very low volatility. This st
FREE

======================================================== GOLD WAVE LEVELS (ELLIOTT-ALIGNED) - MQL5/MT4 MARKET DESCRIPTION (formatting: **bold** = Bold button; lines with • = bullet list; UPPERCASE = heading) ========================================================
OVERVIEW ------------------------------------------------------- **Gold Wave Levels** draws a tested wave backbone for gold and validates signals against **Elliott theory hard-rules**, with higher-timeframe context and per-timeframe
FREE

このユーティリティを使用すると、戦略テスターで戦略を手動でテストできます。視覚化チャート上でワンクリック取引。
このユーティリティの最新バージョンは、トレーダーが取引戦略を手動でテストするための高度な機能を提供します。ストラテジー テスターを使用すると、シミュレートされた環境で取引戦略の有効性を評価できるようになります。この機能を使用すると、取引テクニックのパフォーマンスを分析し、それらを改良して取引スキルを向上させることができます。 さらに、ストラテジー テスターは、視覚化チャート上でワンクリック取引で取引を実行する便利で効率的な方法を提供します。この機能により、異なる画面を切り替えることなく、希望の価格レベルで取引を迅速に開始および終了することができます。 ストラテジー テスターで利用できる完全な機能を使用すると、取引戦略をシミュレーションして洗練し、結果を分析して、取引スキルを効果的かつ効率的に最適化できます。 MT5 のバージョン
完全な説明 +DEMO +PDF 購入する方法
インストールする方法
ログファイルの取得方法 テストと最適化の方法 E
FREE

ControlPoints インジケーター
目的: コントロールポイント(CP)— チャート上の局所的極値(フラクタル)を特定します。上側 CP は局所的高値(high による)、下側 CP は局所的安値(low による)です。チャート上にひし形で表示されます。 No-Repaint: 本インジケーターは再描画しません。バー i の CP は、ウィンドウ [i − 前のバー数, i + 後のバー数] 内のすべてのバーが確定したときにのみ確定します。形成中の(現在の)バーは決して評価されません。確定後、その値は再計算されません。 CP 判定ロジック 上側 CP: 範囲 [i − 前のバー数 .. i + 後のバー数](ただし j ≠ i)内のすべての high[j] よりも high[i] が厳密に大きい。 下側 CP: 同じ範囲内(ただし j ≠ i)のすべての low[j] よりも low[i] が厳密に小さい。 同一のバーが上側 CP と下側 CP を同時に兼ねることがあります。 パラメーター パラメーター 型 既定 説明 1 前のバー数 int 2 候補バー
FREE

1. 目的 本インジケーターは、M15タイムフレームでの転換点を見つけるためのものです(他のタイムフレームでも使用可能ですが、パラメーターはM15向けに最適化されています)。 シグナルは、平滑化されたCCIがゼロ・レベルをクロスした際に生成され、後続のバーでの必須の確認とボラティリティによるフィルタリングを伴います。 2. 動作ロジック 期間18の標準CCIインジケーターを使用します。それに、ノイズを低減するために指定された期間のSMAによる平滑化を適用します。 ゼロクロスの検出: 下から上へのクロス → 潜在的な買いシグナル(BUY) 上から下へのクロス → 潜在的な売りシグナル(SELL) 確認: ゼロクロスの後、CCIが新たなゾーンにさらに3本のバー(パラメーター ConfirmBars)とどまることが必要です。これにより、誤った戻りを排除します。 フィルタリング: バーのレンジ:(高値-安値)は、過去14本のバーの平均レンジの65%以上(MinRangeRatio=0.65)、かつ最小25ピップス(MinRangePoints=25)であること。 ATRボラティリティ:現在の
FREE

ForexFanclub(FFC) : For detailed instructions and our official website, please visit my profile ! BreakLine - Advanced Breakout Alert Tool BreakLine is a powerful and intuitive indicator designed to elevate your technical analysis. It automates the process of identifying key market levels and instantly notifies you when the price breaks through them, ensuring you never miss a critical trading opportunity. Key Features Automatic Line Drawing: Instantly detects swing highs and lows to plot o
FREE

Effective MACD Advisorは、あなたのトレーディングアシスタントです。
完全自動モードと半自動モードで使用できます。
1つの注文、または複数の注文で取引でき、ポジションの平均化を個別に設定できます。
取引はMACDインジケーターに基づいています。
インジケーターの設定は標準で、アドバイザーに組み込まれています(必要に応じてアドバイザーに表示できます)。
平均化は乗数なしで行われます(ロットサイズのみ手動で増やすことができます)。
ロットサイズ、距離、テイクプロフィットは、あなたのトレーディングスタイルに合わせてカスタマイズできます。
25種類の通貨ペアを取引できます。
半自動モードのアドバイザーは、あなたのトレーディングをより簡単にする素晴らしいアシスタントです。
取引はH1~H4の時間足で行われます。
設定:
LotsBuy、LotsSell - 買いと売りのロットサイズを個別に設定できます。これにより、ロットサイズをあらゆる方向に、そして任意の数の注文で調整できます。例えば、10回の注文後、ロットサイズを増やすことでテイクプロフィットを増やす
FREE

Promotion: for the purchase of this product you will receive as a bonus an expert advisor who cannot lose money! (on a demo account, with proof of purchase of this product in pm)
Hello and welcome,
Here is my new expert advisor: It works on 14 different pairs in M5. All possible combinations have been tested with a spread of 40, 0.01 lot, a leverage of 1:30 and over several years.
Here are the results : TOP PAIR SET1 SET2 Profit
1 GBPNZD 10 43 647
2 GBPCHF 10 20 415
3 GBPAUD 9 22 385
4 EU
FREE

For trading on M15 currency pair EURUSD A good robot for trading in any currency - with the proper settings (example EMA_Signal 10 EMA_Trend 60 Take Profit - 0.2-0.3 Lots - 0.20-0.28) - on non-USD currency pairs gives up to 100 percent per month . On USD - more than 100 percent per year - it all depends on the broker you choose. The trading system is based on the EMA indicator - the price is below the indicator - buy, the price is above the indicator - sell - a grid trading strategy, but the lar
FREE

This indicator lets you easily mark the daily open levels on a chart with several possibilities of customization. For many trading strategies, the daily open level is an important level to base trading decisions on. That is why I chose to create this indicator that is designed to assist you with trading these strategies, as well as further optimizing them and getting a general understanding of the markets movements. With this tools help, you can easily take a look at the previous price action ar
FREE

無料のBlueDigitsFxツール + エコシステムアクセス この無料ツールは、BlueDigitsFxトレーディングインフラエコシステムの一部です。 BlueDigitsFxボットを通じて、アップデート、ワークリソース、製品リリース情報、および公式エコシステムへのアクセスを取得できます。 Telegramエコシステム
ウェブサイト
BlueDigitsFx Symbol Changer MT4 — MetaTrader 4の分析効率を向上させるワンクリック・シンボル切替ツール BlueDigitsFx Symbol Changerは、インジケーター、オブジェクト、テンプレート、チャート設定を保持したまま、既存チャートのシンボルを素早く変更できる軽量なMT4ユーティリティです。 複数の銘柄や市場を分析するMetaTrader 4トレーダー向けに設計されており、新しいチャートを開いたり作業環境を再構築したりすることなく、より迅速に市場を切り替えることができます。 シンボルを変更しても同じチャートレイアウトを維持できるため、市場スキャンを効率化し、銘柄比較を高速化しながら、整理され
FREE

Volatility Pullback Radar は、現在の大きなトレンド方向を表示し、現在の市場ボラティリティに対するプルバックの深さを測定するチャートインジケーターです。 インジケーターを適用したチャートの銘柄と時間足で動作します。 このインジケーターは取引の開始、終了、管理を行いません。トレンド方向、プルバックの深さ、現在のプルバック状態に関する情報を提供します。 仕組み 長期の指数移動平均を大きなトレンドの基準として使用します。初期設定の期間は 200 です。 より短期の指数移動平均を、プルバックを測定する基準として使用します。初期設定の期間は 20 です。 Average True Range を使用して現在の市場ボラティリティを測定します。初期設定の期間は 14 です。 価格が長期平均を十分に上回っている場合、トレンドは Bullish と判定されます。 価格が長期平均を十分に下回っている場合、トレンドは Bearish と判定されます。 長期平均の周辺に設定された小さなボラティリティ調整領域は Neutral と判定されます。 Bullish トレンドでは、短期基準平均
FREE

Trade Simulator With this toolbar you have both: a compact surface, which simultaneously shows you the most important information you need for trading.
You can use it with your real account or also in the strategytester mode. This toolbar allows you to trade in the strategytester as real as possible with every option available from the MT4 platform. Settings available: Magic Number - When the 'MagicNumber' number is 0, the toolbar will watch all orders without a 'MagicNumber'. If th
FREE
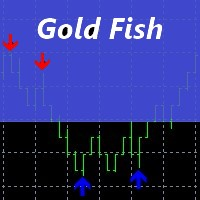
Thank you for your interest in "Goldfish Indicator". I have been trading since 2008. I usually trade on Renko chart in reversal pattern with Goldfish Indicator. If you share your vps details with me, I will connect your account (Live/Demo). To get proper results copy my trades for at least 30 days. Minimum Deposit: $1000 Leverage: 100:1 Profit Target: Monthly average profit target is 10% to 20%+/- Draw-down: The average drawdown is 10% to 20% Risk
Warning: Trading financial products on margin
FREE

RSI Assistant MT4 – 高度なRSIトレーディングツール 主な機能 スマートRSI可視化 – 滑らかなカラーエリアで買われ過ぎ・売られ過ぎゾーンを明確に表示 高度なシグナル検出 – RSIゾーンの強さ(70、80、90 / 30、20、10)に応じて異なる色で強気・弱気の矢印を表示 ゾーン別アラート – RSIの強さに応じて異なるアラートを受信 マルチタイムフレームRSIパネル – インタラクティブボタンでM15、M30、H1、H4のRSIを監視 動的ステータスボタン – ボタンは自動的に色が変わり、買われ過ぎ(赤)と売られ過ぎ(緑)を表示 プロ版利用可能 – 16以上のトレーディング戦略 をアンロック -> Strategy Assistant 今すぐ試す 最新情報を入手 – MQL5コミュニティ @hdtradinglabチャンネル に参加して最新情報と無料ツールを入手 概要 RSI Assistant MT5は、従来のRSIを強化するために設計された強力で完全無料のインジケーターです。高度な可視化、スマートアラート、マルチタイムフ
FREE

======================================================== GANN CLUSTERS - INSTITUTIONAL SIGNAL PANEL - MQL5/MT4 MARKET DESCRIPTION (formatting: **bold** = Bold button; lines with • = bullet list; UPPERCASE = heading) ========================================================
OVERVIEW ------------------------------------------------------- **Gann Clusters** finds where three independent Gann systems agree and draws those **confluence clusters** across multiple timeframes, with a signal panel that
FREE

======================================================== XAUUSD ELLIOTT WAVE + REAL YIELD (BIG DASHBOARD) - MQL5/MT4 MARKET DESCRIPTION (formatting: **bold** = Bold button; lines with • = bullet list; UPPERCASE = heading) ========================================================
OVERVIEW ------------------------------------------------------- **XAUUSD Elliott Wave + Real Yield (Big Dashboard)** is the dashboard edition of the Elliott + real-yield engine: the same ZigZag/Elliott structure and ma
FREE

インジケータは、チャート上の端子RSI発振器に基づく信号を示しています。 繰り返し信号をフィルタリングすることができます。
ここでは、発振器は逆信号を検索するために使用されます。 これは、レベルからスイング戦略や取引のエントリポイントとして推奨されます。
マルチ通貨ダッシュボードが利用可能です。 それを使用すると、簡単にチャートを切り替えることができます。 製品のディスカッションでは、ダッシュボードを埋め込むことができるアルゴリズムを提案できます。
入力パラメータ 。
主な設定 。 Bars Count – インジケータが動作する履歴バーの数 。 RSI Period – オシレーター周期 。 RSI Level – オシレータのレベル。 発振器は0と100の間に行きます。 10を選択すると、信号は10以上90以下になります 。 RSI Applied Price 。 Repeat Signal - 繰り返し信号 。 Enable – すべての繰り返し信号は、矢印/アイコンで表示されます 。 No Signal – 繰り返されるものはすべて無視されます 。
視覚的な矢印 。
FREE

MTF Currency Strength Panel for MetaTrader 4 マルチタイムフレーム通貨強度インジケーター。主要28通貨ペアを1つのチャートに集約します。 この通貨強度パネルは、主要8通貨の現在の位置関係と、主要28通貨ペアがM1からMN1までの9つの時間足でどのように動いてきたかを同時に表示します。両方の情報が1つのチャート上に並び、タイマーによって更新されます。 ペアを独自にランク付けすることは誤解を招きます。単一の通貨が変動すると、その通貨を含むすべての通貨ペアも変動するため、ペアのランキングのトップは同じ通貨が 7 回繰り返されることがよくあります。このパネルは、マトリックス全体を個別の通貨強さに分解することで、ドライバーを重複から分離します。 分解の仕組み 8 つの通貨はそれぞれ、28 ペアのうち 7 つのペアに表示されます。その強さはこれら 7 つの測定値の平均であり、相場通貨である場合は符号が反転されています。つまり、AUDJPY の下落は円安を意味するのではなく、円高を意味します。 すべてのペアは正確に 2 つの通貨に寄与しており、ベースにプラ
FREE

Dark Dione is a fully automatic Expert Advisor for Medium term Trading. This Expert Advisor needs attention, in fact presents highly customizable. Dark Dione is based on Dark Breakout indicator, these trades can be manage with some strategies. (Write a review at market to receive 1 paid indicator for free!) Optimization experience is required to Download the robot. My tests are indicative, for best results it is necessary to study the user manual and create your settings. All the s
FREE

This is a multi timeframe version of the Supply and Demand indicator . It allows you to analyze a chart using the law of supply and demand on three different timeframes at a time. You will see zones of sales and purchases and determine the most profitable points to open positions. The indicator is based on the principle of market fractality. Supply and demand zones show places where a strong buyer or seller has made the price reverse and change its direction. The indicator has several types of
FREE

Indicator designed for both beginners and professionals. RECOMMEHDATION Trade with this indicator for 2-3 weeks and you will feel significant progress in your trading. This indicator is developed based on the use of HMA, Laguerre, CCI . The indicator is clear and does not require any setting. Does not redraw and works by opening bar. It works on timeframes M1-D1. I use timeframe M5 to enter the market.
FREE

Asesor Experto "Sniper FX": Precisión Milimétrica para Tus Operaciones El asesor experto "Sniper FX" redefine la precisión en el trading automatizado al ofrecer un enfoque estratégico centrado en pocas, pero extraordinariamente precisas, entradas en el mercado. Inspirado por la agudeza de un francotirador, este asesor experto utiliza algoritmos avanzados para identificar oportunidades óptimas de compra y venta, maximizando el potencial de beneficios mientras minimiza la exposición al mercado.
FREE

EAPADPRO Library for MetaTrader 4 は、Expert Advisor に現代的な情報パネルを追加できる無料のプロフェッショナルなインターフェースライブラリです。 このライブラリは、MetaTrader 4 のチャート上で自分の取引プログラムをより分かりやすく、視覚的に完成度が高く、よりプロフェッショナルに見せたい MQL4 開発者向けに作られています。 取引アルゴリズムはもちろん重要ですが、製品の第一印象も非常に大切です。整理された情報パネルがあることで、ユーザーは Expert Advisor が現在何をしているのか、どの設定が有効なのか、どのシンボルと Magic number が処理されているのか、そして戦略上どの値が重要なのかを素早く理解できます。 EAPADPRO for MT4 は無料ライブラリです。 Expert Advisor のインターフェース、情報表示、視覚的な品質を向上させるために使用できます。 完全なステップ別統合ガイド: LIB - EAPADPRO ステップ別手順 EAPADPRO パネルの詳しい説明: EAPADPRO 情報
FREE

Modified oscillator MACD. A classic indicator that combines a trend indicator with an oscillator to detect entry points. Has a multi-timeframe panel and 3 types of notifications
Benefits:
Works on all instruments and timeseries Trend indicator with oscillator for inputs Multi-period panel on all timeframes Pluggable arrows when signals appear Three types of notifications: push, email, alert
MT5 version -> HERE / Our news -> HERE
How the indicator works:
AW Classic MACD - Indicator of
FREE
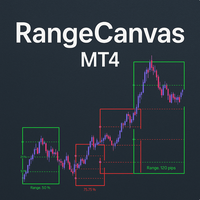
Daily Range Boxes : The indicator draws rectangular boxes around each day's high and low prices, creating a clear visual boundary for the daily trading range. Color-Coded Logic : Green boxes when the current price (or close) is above the daily open Red boxes when the current price is below the daily open Percentage Level Lines : Inside each box, it draws three horizontal lines at: 25% of the daily range 50% of the daily range (midpoint) 75% of the daily range Range Information : Each box displa
FREE

SnR Fresh Unfresh Level MT4 by RWBTradeLab
A clean, non-repainting Support & Resistance level tracker for MetaTrader 4 that shows you the ONE thing most level indicators hide: which levels are still FRESH (untested) and which are already UNFRESH (rejected). Every level is tracked live, state by state, from CLOSED candles only.
What This Indicator Does
The indicator creates SnR levels from 2-candle sequences and then tracks each level's state continuously:
Level Creation (Level = 1st candle
FREE

Session Atlas — MetaTrader 4向けプロフェッショナル取引セッションマップ Session Atlasは、通常のチャートを分かりやすい取引時間帯マップへ変えるMT4用ビジュアルインジケーターです。主要な取引セッションの開始、終了、稼働状況をチャート上に直接表示し、現在の市場がアジア、ヨーロッパ、アメリカのどの時間帯にあるのかを素早く把握できます。 多くのトレーダーは価格水準、モメンタム、ブレイクアウト、ボラティリティを分析しますが、重要な要素である「時間」を見落としがちです。同じシグナルでも、アジア、ヨーロッパ、アメリカの各セッションでは、まったく異なる動きをすることがあります。 Session Atlasを使用すれば、手動でチャートに印を付けたり、常に時刻を確認したり、不要な表示でチャートを複雑にしたりすることなく、市場の時間的な状況をすぐに確認できます。 インジケーターは、取引セッションを色付きのゾーンとしてチャート上に自動表示します。各ゾーンには、特定のセッションの時間帯と値動きの範囲が表示され、異なる取引段階が視覚的に区別されます。 これにより、市場が落
FREE
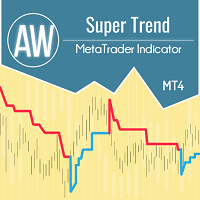
AW スーパー トレンド - これは、最も人気のある古典的なトレンド インジケーターの 1 つです。シンプルな設定で、トレンドだけでなく、このインジケーターによって計算されるストップ ロス レベルも表示できます。 利点:
楽器: 通貨ペア 、株、商品、指数、暗号通貨。 時間枠: М15 以上。 取引時間:24時間。 現在のトレンドの方向を示します。 ストップロスを計算します。 取引を行うときに使用できます。 3 種類の通知: プッシュ、メール、アラート。 MT5版→ こちら / お知らせ -> こちら 機能:
- インジケーターは、現在のトレンド方向を対応する色で表示します。
- 青色は、現在の時間枠で使用されているシンボルの上昇トレンドを示します。
- 線の赤い色は、選択したシンボルで使用された時間枠の下降トレンドを示します。
インディケータはストップロスを設定するために使用できます。
指標線はバーの上ではなく、バーに対していくらかシフトして表示されます。トレンド ラインが表示されるこの場所は、トレーダーがストップ ロスを設定するために使用できます。 トレ
FREE

"Candlesticks MTF 4" is an informational indicator that displays "Japanese Candlesticks" . The indicator analyzes and determines the opening and closing times of candles from higher time frames.
An algorithm has been developed for the "Candlesticks MTF 4" indicator that corrects the discrepancy between the opening and closing times of candles from higher time frames. For example, if the opening time of a candle on a weekly time frame is the 1st of the month, and on the smaller time frame this
FREE

JA — 日本語 TulipS 2.0 — ゴールド H1 マルチ戦略 Expert Advisor TulipS 2.0 は、当社のゴールド取引エンジンの全面アップグレード版です。 「5つのエリート戦略をワンクリック選択」というコンセプトで再構築しました。 機能概要 XAUUSD / XAUUSDc の H1 時間足 を取引します。シグナルの核は 4本連続ローソク足 (4本連続の陽線/陰線、乖離条件なし)。5つの固定エリート戦略はそれぞれ、このシグナルを独自のトレンドフィルターと組み合わせています。 5つのエリート戦略(1つを選択) 同時に有効なのは 1つの戦略のみ (ドロップダウンで選択)。内部パラメータ(パターン、フィルター、K長、乖離)はすべてコードに固定され非表示です。数十のパラメータを調整するのではなく、番号で選ぶだけです: Streak4 + H1 EMA20/50 クロス方向 — 最も安定 Streak4 + H4・D1 レゾナンス Streak4 + RSI(21) 15/85 Streak4 + EMA200 ゲート Streak4 + H4 EMA50
FREE

Most killzone indicators draw boxes. This one also checks whether the boxes work. ICT Killzones Honest Stats for MetaTrader 4 draws the four ICT killzones (Asia, London open, New York open, London close) and measures on your own chart how often the day's high or low really formed inside each one, next to what pure chance would give, and how often the London Judas swing really reverses. Free, part of the Honest Stats series. MT5 version | ICT FVG Honest Stats MT4 (free) | ICT Liquidity Levels Hon
FREE

The indicator has combined 5 popular strategies. Draws an arrow after confirming a signal for the selected strategy. There are signal alerts. Doesn't redraw its values. I recommend watching my advisor - Night Zen EA
5 strategies. The main line crosses the signal line. The main line crosses the signal line in the oversold (for buy) / overbought (for sell) zones. The main line enters the oversold (for sell) / overbought (for buy) zones . The main line comes out of the oversold (for buy ) / over
FREE

The Supertrend Indicator is a popular technical analysis tool designed to assist traders in identifying market trends. The indicator combines the average true range (ATR) with a multiplier to calculate its value. This value is then added to or subtracted from the asset’s closing price to plot the supertrend line. The Supertrend Indicator can help identify trends, manage risk, and confirm market tendencies. The indicator is limited by its lagging nature, is not very flexible, and can send up fal
FREE

This EA will make it Entry setup based on first FVG formed, and if the price come back it will open the Order You can set silver bullet time A.M or P.M based on your broker server time
Silver bullet time ( EST NY Time +4 ) London : 3 A.M. to 4 A.M. NewYork AM : 10 A.M. to 11 A.M. NewYork PM : 2 P.M. to 3 P.M.
Set the time for beginning setup.
For increace Accuracy you can set DAILY BIAS with BUY = True / False SELL = True / False You can learn from TTrades video daily bias
https://www.yout
FREE

Free. Set your risk, click Buy or Sell, done. TrueRisk Trade Panel works out the lot size for you. Type how much of your account you want to risk (for example 1%), set the stop loss in points or drag it on the chart, and the BUY and SELL buttons already show the right lot. No lot calculator, no guessing, no trade that risks ten times more than you meant. TrueRisk Account Dashboard MT4 (free) | TrueRisk Symbol Changer MT4 (free) | MT5 version | All TrueRisk tools Lot size from your risk: % of bal
FREE
インジケーターは、任意の時間枠からの任意のシンボルの最小化されたチャートを表示します。表示されるチャートの最大数は28です。チャートはメインウィンドウと下部ウィンドウの両方に配置できます。 2つの表示モード:キャンドルとバー。表示されるデータ(バーとキャンドル)の量とチャートのサイズは調整可能です。 パラメーター: Corner-開始コーナーを表示します(リストから選択) CandleMode-表示モード:true-キャンドル、false-バー ShowLastBid-最終価格表示を有効/無効にします LastBidShiftX-X軸による最終価格ラインシフト(すべてのシフトはより正確な表示のために使用されます) LastBidShiftY-Y軸による最後の価格ラインシフト ColorLB-最終価格ラインの色 BarsToDisplay-現在のものなしで表示されたバー/キャンドルの量 LineColor-線の色(同事キャンドル) BullColor-強気のバー/キャンドルの色 BearColor-弱気のバー/キャンドルの色 ScaleColor-スケールカラー WindowNumber
FREE

Automatic fibonacci with alerts is an indicator that automatically plots a fibonacci retracement based on the number of bars you select on the BarsToScan setting in the indicator. The fibonacci is automatically updated in real time as new highest and lowest values appear amongst the selected bars. You can select which level values to be displayed in the indicator settings. You can also select the color of the levels thus enabling the trader to be able to attach the indicator several times with d
FREE

RSI Turn Finder インジケーターは、MetaTrader 4 向けの 非リペイント型モメンタム転換検出システム です。14 期間 RSI が、設定可能なポジティブ閾値(デフォルト 65)を上抜けする正確なタイミングを監視し、その動きが 5 期間 EMA(終値)の上昇によって確認されたときにトレンドバイアスをラッチ(固定)します。固定されたバイアスは、チャート上で 10 期間 EMA(安値)を追従する 2 色のトレンドラインとして表示されます。状態が切り替わるたびに「Positive」または「Negative」ラベルが描画され、4 種類のアラートがリアルタイムで発報されます。MT4 / MT5 いずれのビルドも、同じデータに対して視覚的・論理的に同一の結果を出力します。 MT5 版はこちら: RSI Turn Finder MT5 その他の製品はこちら: すべての商 品 リアル口座での使用例や新ツールをチェックしたい方は、プロフィールを訪問してフレンドリクエストを送り、最新アップデートを見逃さないようにしてください。 動作概要 RSI クロス + モメンタム確認 ポジテ
FREE
「GA Moving Average」(「GA 移動平均線」)は、移動平均線クロスオーバー戦略を用いたエキスパートアドバイザー(EA)であり、完璧なトレード戦略を実現するための多くの設定が可能です。
「GA Moving Average」の中心コンセプトは、移動平均線インジケーターを利用して潜在的なトレード機会を特定することです。異なる移動平均線の相互作用を分析することで、このEAは市場での買いシグナルと売りシグナルを生成することを目指しています。
主な特徴とカスタマイズオプション: 1. 移動平均線のパラメーター:トレーダーは、短期と長期の移動平均線の特定の期間を設定できます。これにより、トレーディングスタイルや好みに合わせて柔軟に適応することができます。さまざまな市場条件や時間枠に対応することが可能です。
2. クロスシグナルの生成:EAは、短期移動平均線が長期移動平均線を上回ると買いシグナルが生成され、短期移動平均線が長期移動平均線を下回ると売りシグナルが生成されるよう監視します。これにより、潜在的な買いチャンスや売りチャンスを示します。
3. リスク管理:EAにはリス
FREE
MetaTraderマーケットは、他に類のない自動売買ロボットやテクニカル指標の販売場所です。
MQL5.community ユーザーメモを読んで、取引シグナルのコピー、フリーランサーによるカスタムアプリの開発、支払いシステムを経由した自動支払い、MQL5Cloud Networkなど、当社がトレーダーに対して提供するユニークなサービスについて詳しくご覧ください。

取引の機会を逃しています。
- 無料取引アプリ
- 8千を超えるシグナルをコピー
- 金融ニュースで金融マーケットを探索