YouTubeにあるマーケットチュートリアルビデオをご覧ください
ロボットや指標を購入する
仮想ホスティングで
EAを実行
EAを実行
ロボットや指標を購入前にテストする
マーケットで収入を得る
販売のためにプロダクトをプレゼンテーションする方法
MetaTrader 4のための無料のエキスパートアドバイザーとインディケータ - 7
!!! New faeture sending Signals as VIP EMAILS
MT4 Telegram Signal is tool, which sends selected trades via magic number to telegram channel, sms and email to user. Tool sends trades when open and close with chart to telegram chanel. It also sends every modification from trades to telegram. Tool can send multiple charts and magic numbers and pairs from a single chart. For this you have to fill in on the chart corresponding magic number to be sent by the chart. Send information of all type of or
FREE
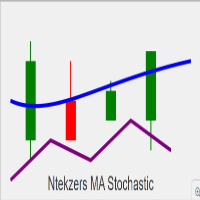
Overview of Key Functionalities: Buy Signal Conditions : The Stochastic Oscillator's main line crosses above the signal line. The closing price of the current candle is higher than the previous candle's close. The current closing price is above the EMA (Exponential Moving Average). The Stochastic value is below 50. When these conditions are met, a buy arrow is plotted, and alerts (audible or push notifications) are triggered. Sell Signal Conditions : The Stochastic Oscillator's main line crosses
FREE

GodSend is an Expert Advisor that uses an innovative and unique grid of its kind.
Through an advanced algorithm it intercepts the best conditions to enter the market with stop / limit orders in favor of the trends.
Some indicators that can be selected in the options such as CCI / MACD / BOLLINGER / RSI offer the possibility to customize each single item according to your trading style, you can choose to enter the market directly or to place orders.
The use of the grid is so advanced that
FREE

このインジケータは、チャート上に任意のテキストと画像を表示し、マクロによって要求された情報を表示することもできます。 3つのテキストブロックと1つの画像ブロックがあります。フォントの選択、サイズ、色、インデント、配置が可能です。 スクリーンショットをブランド化したり、チャート上に必要な情報を表示したい場合、 UPD1 Watermark は非常に便利なツールとなるでしょう。
設定の説明 。
テキスト設定(3ブロック)。 Text 1, 2, 3 – テキストとマクロを入力します。 Font Name – フォント名を入力します。エラーの場合は、デフォルトのフォントが使用されます。 Font Size – フォント・サイズを指定します。 Font Color – フォント・カラーを指定します。 Corner – オブジェクトのスナップ角度を選択します。 Visual Position – オブジェクトをチャートの前または後ろに配置します。 X – 水平方向のインデント(単位:ピクセル Y – ピクセル単位の垂直方向のインデント。
画像設定(1ブロック)。 Image – 画
FREE

A combined indicator of two famous indicators: RSI , Bollinger Bands Can be used in all currency pairs Can be used in all time frames with many signals Very simple and fast to use
Description:
This indicator is made from the combination of RSI and Bollinger Bands indicators
As you can see, it shows good signals and is worth using and testing
We hope you are satisfied with this indicator
Settings: show past show candle: Displays the number of candles that the indicator calculates.
For
FREE
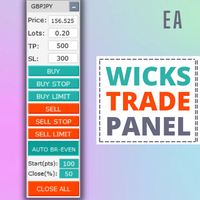
Wicks Trade Panel It's a Trade Panel include Order Management & Risk Management for serious trader. Especially for those traders who pay attention to important events like the CPI, NFP, and ADP. A one-of-a-kind faster technique to fix the Entry Price by simply pointing the mouse pointer at it. This is what I enjoy about it. Automatically closing 50% order size lots when setting TRUE on Breakeven Status. It's especially useful when trading on significant economic events like the CPI, NFP, and A
FREE

Break It Down is based on the Directional Movement Index and tells the trader when a market trend probably maxed out and ready to fall back. This pattern is more predictable when we apply this system only when the market is rallying but within a trading range. Because traders Sell off in fear the market often moves faster when declining! When this happens, good moves can occur. As traders are no longer interested in the trend, the volume will decline and the price will usually fall back on itsel
FREE

The Indicator show Daily Pivot Points. It is possible to specify the number of days to display. For forex it doesn't consider the sunday session data. It is possibile to modify the color, style and width for every level.It is better to use this indicator with timeframe not higher than Н1. 4 Levels of support and resistance with also Intermediate Levels that is possible to hide.
FREE

The Supertrend draws a line following the current trend.. Green Line under the candle means a likely bullish trend Red Line above the candle means a likely bearish trend
How to trade with SuperTrend indicator Buy when the Supertrend Green line is below the price, Sell when the Supertrend Red line is above the price. It is strongly suggested to use this indicator in a trending market.
Parameters Multiplier - the lower it is and the more sensitive is the line, meaning it will follow the price
FREE

Introducing Dumangan MT5 - The Philippine God Of Harvest
( MT5 Version - https://www.mql5.com/en/market/product/98640 ) Experience the abundance of successful trades with Dumangan MT5, our new Expert Advisor available on MQL5.com. Named after the revered Philippine God of Harvest, Dumangan, this tool embodies the essence of reaping profits from the fertile ground of the markets, just like Dumangan blessed the fields with bountiful crops. A Focused Strategy with Customizable Settings Dumangan
FREE
MTF Fair Value Gaps Alerts indicator is based on Fair Value Gaps (FVG), Volume imbalance (VI) and Gaps. This indicator will create 2 arrows pointing to the left showing the area of the FVG, VI and Gaps and will never repaint after the candle has been closed .
Inputs: TF (Timeframe of the Alert For Current timeframe use CURRENT)
barshilft : the barshift needs to be the same timeframe as the above TF. barshift format (CURRENT, M1, M5, M15, M30, H1, H4, D1, W1, MN) Send Email: Audible Alert Push
FREE

The Supreme HmaSignal indicator is an indicator for trend trading , its main character is the hull moving average colored line , and secondary is buy and sell arrows , arrows are fair but the main focus is on the colored hma , this indicator does not repaint or back paint or delay its signals. if you like this indicator please check my Supreme Trendhisto: here , and my Supreme Diamond indicator : here
Parameters: HMA Period HMA Smoothing HMA Price (close/open) Signal Period (Arrows)
FREE

A Moving Average (MA) Trading Expert Advisor (EA) for MetaTrader 4 (MT4) is an automated trading system designed to execute trades based on signals generated by one or multiple moving averages. Moving averages are a popular technical analysis tool used to smooth out price data and identify trends. Here's a description of how a Moving Average Trading EA typically operates: Moving Averages Used : The EA utilizes one or more moving averages to generate buy or sell signals. Common choices include t
FREE

The indicator displays overbought and oversold levels, calculating them using the Fibonacci golden ratio formula.
It enables both trend-following and counter-trend trading, accommodating breakouts and rebounds from these levels.
It operates on all timeframes, across various currency pairs, metals, and cryptocurrencies.
Suitable for binary options trading.
Key Features: Based on the Fibonacci golden ratio Shows overbought and oversold levels Suitable for market and pending orders Sim
FREE

Torakiki takes advantage from the only sure thing about Forex: price will move. It works 24/7 opening at any time two baskets, one in buy and one in sell. While the one that happened to be in the right direction keeps collecting profits, the other basket opens a grid with a clever recovery mechanism which closes positions one after the other as they reach their individual take profit in those usual bounces back you have even in the strongest trend formation, keeping track of the total profit
FREE

A less risky alrorithm compared with the other version. 1. Make sure you trade only with GBP/USD on an 1h chart as this model is built specifically for hourly Cable trading. 2. If you are backtesting the EA during weekends, make sure to specify a reasonable spread (such as 30 or 50) instead of using current spread because the market is not trading and the current spread may be some awkward number. During weekdays, feel free to use current spread as it is the correct current spread value.
O
FREE
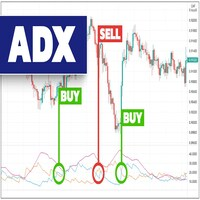
The indicator provides buy and sell signals on the charts every time ADX DI- and DI+ crosses each other. Blue arrow for uptrend (DI+>DI-). Red arrow for downtrend (DI->DI+). This technical analysis tool can be applied to various trading strategies. The ADX Crosses Signals Indicator is based on the Average Directional Index Metatrader Indicator. The ADX is a lagging indicator, meaning that a trend must already be established before the index can generate its signal.
Inputs PERIOD; AlertOn
FREE

This indicator is an original view on volumes. It is known that volumes show the amount of buyers and sellers for a certain period of time. A candle is used a period of time. Volumes at a candle High show the buyers. Volumes at a candle Low show the sellers. A candle Open shows the Delta. Delta indicates who was dominant on a given candle, buyers or sellers.
Input parameters Distance - distance of the volumes text from High and Low. Font size - text font size. The indicator provides levels tha
FREE

Multi Divergence Indicator for MT4 - User Guide Introduction Overview of the Multi Divergence Indicator and its capabilities in identifying divergences across multiple indicators.
Importance of divergence detection in enhancing trading strategies and decision-making.
List of Indicators RSI
CCI
MACD
STOCHASTIC
AWSOME
MFI
ACCELERATOR
OSMA
MOMENTUM
WPR( Williams %R)
RVI Indicator Features
Indicator Selection: How to enable/disable specific indicators (RSI, CCI, MACD, etc.) for diverg
FREE

The VWAP Level indicator is a technical analysis tool that calculates the weighted average price for the traded volumes of a specific asset. The VWAP provides traders and investors with the average price of an asset over a specific time frame.
It is commonly used by investors to compare data on "passive" trading operations, such as pension funds and mutual funds, but also by traders who want to check if an asset has been bought or sold at a good market price.
To calculate the VWAP level we
FREE
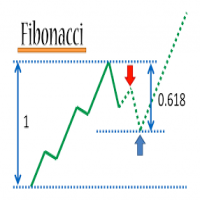
Lot_Type : Dynamic or Fixed Lot IF fix Lot: 0.01 IF Dynamic RISK: 0.1% Slippage: 30 Bar: 3 ----> number of bars on which fibonacci works TP_FIBO : Target 23 or 38 or 50 or 61 or 100 or 161 or 261 or 423 Stop Lose MaxTrades: Number of Open Trades
Fibonacci Ea, is an expert advisor with which at the number of bars chosen by the user, he finds the minimum price (Fibo 0) and the maximum price (Fibo 100); On these two levels, it calculates the remaining Fibo prices (23,38,50,61,161,261,423). If Ask
FREE
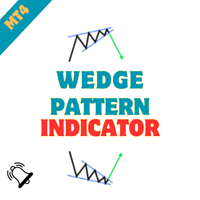
Wedge Chart Pattern Indicator - Unleash the Power of Wedge Patterns in Your Trading Embark on a journey of precision trading with the "Wedge Chart Pattern Indicator." Crafted for MetaTrader, this advanced tool is your ultimate companion for identifying wedge chart patterns, empowering you to make informed and strategic trading decisions. Whether you're a seasoned trader or just starting, this indicator simplifies the process of spotting wedge patterns, providing you with a valuable edge in the m
FREE

Χ15 indicator is a MetaTrader 4 tool that allows you to BUILD & BACKTEST ON REAL TIME your own strategies quickly, easily and efficiently. It contains 15 of the most popular technical analysis indicators that you can use, each one in a different way. Choose the indicators that you want to use, select how you will use them and you will see on the chart BUY (green) and SELL (red) arrows implementing your strategy. Choose Take Profit and Stop Loss and you will see the results of your strategy with
FREE
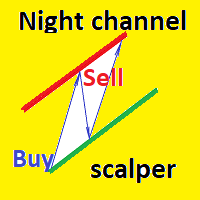
Night channel scalper is a fully automatic trading advisor. The strategy of night scalping in the channel, working hours 2-3 hours. Advisor does not use martingale. does not use a grid, does not use hedging. All trading orders are protected by stop loss, the recommended timeframe for working M5 is M15. It has a setting of dynamic take profit and stop loss. The minimum deposit for work is 10 -15 dollars for one currency pair, leverage 1: 500
Settings
Take Profit - Fixed Take Profit Dynamic Ta
FREE

This indicator scans multiple pairs on multiple timeframes for RSI values and draws green up arrows for RSI overbought values and red down arrows for oversold RSI values in realtime.
Features •Animated rows plotting •Resizable •Repositionable •Minimisable •Multiple dashboard themes •Multiple timeframes •You can open a pair by clicking it •Current chart pair marked by a different color •Use market watch pairs or your own list of pairs •Choose the timeframes to display
FREE

[ Thank reviewers by September 20, 2024 = 30 downloads ]
この製品は通常 30 ドルで販売されていますが、メイン製品の発売をサポートするために無料でダウンロードできるようにしています。 素晴らしいのは、メイン製品と一緒に実行しなくてもチャートで使用できることです。ただし、この製品はメイン製品にリンクされていないため、アラートが表示される場合があります。 さらに、次のメイン製品の無料トライアルをダウンロードして実験することができます。| これにより、この発売フェーズで多くの人が製品を楽しんで体験できるため、ユーザーからの肯定的なレビューにつながり、より楽しめるものになります。| 肯定的なレビューが 10 件以上ある場合、良いニュースは、このコンテンツの賢明な友人およびレビュー担当者になることで、役立つ重要な 情報と新しいコンテンツを無料でできるだけ多く アップグレードする動機付けになるということです...乾杯! CyberBot プロジェクト用の FX タイミング MT4 オシレーター | 無料でダウンロード
FREE

速度の抵抗ラインは傾向および抵抗ラインを定めるための強力な用具である。 この指標は、チャートの極値と特別な数式を使用して線を構築します。 指標は、トレンドの方向とピボットポイントを決定するために使用することができます。
<---------------------------->
指標パラメータ:
"Depth of search" -チャートの極端な検索の深さ(バー単位) "Back step of search" -極端な間の最小距離(バー単位) "Deviation of price" -同じタイプの両極端間の許容価格差 "Line color" -対応するインデックスを持つ線の色 "Line style"-対応するインデックスを持つラインスタイル "Line width"-対応するインデックスを持つ線幅 <---------------------------->
あなたは本の中でより多くの情報を見つけることができます"エドソン*グールドによる希少な著作のコレクション"またはプライベートメッセージで私
<------------------
FREE

インディケータはチャート上にラウンドレベルを示します。 それらは、心理的、銀行的、または主要なプレーヤーレベルとも呼ばれます。 これらのレベルでは、強気と弱気の間に真の戦いがあり、多くの注文が蓄積され、ボラティリティの増加につながります。 インジケーターは、任意の楽器と時間枠に自動的に調整されます。 レベル80を突破してテストすると、購入します。レベル20を突破してテストすると、販売されます。ターゲットは00です。 注意。強力なサポートとレジスタンスレベルのため、価格は00レベルをわずかに下回る可能性があります。
入力パラメータ 。
Bars Count - 線の長さ 。 Show 00 Levels - 00レベルを表示するかしないか 。 Show 10, 90 Levels 。 Show 20, 80 Levels 。 Show 30, 70 Levels 。 Show 40, 60 Levels 。 Show 50 Levels 。 N Lines - チャートのレベル数を制限するパラメーター 。 Distance 00 Levels -
FREE

Just another plain Super Trend indicator.
On this one i have added another buffer (on index 2) which can be used on EA; the values is -1 to identify a bearish trend while for bullish trend the value is 1.
Here a code snippet:
int trend = ( int ) iCustom ( NULL , Timeframe, "SuperTrend" , Period , Multiplier, 2 , 1 ); It work on every timeframe.
If you need help to integrate it on your EA, don't hesitate to contact me.
FREE
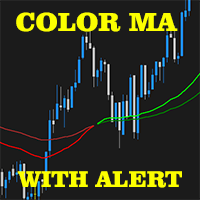
2 EMA Color Alerts Indicator is a powerful tool for any trader looking to stay on top of market movements. By using exponential moving averages (EMAs), this indicator can provide early warning signals for potential market reversals and trend changes. One of the key features of the 2 EMA Color Alerts Indicator is its customizable alerts. With this feature, traders can set their own parameters for receiving alerts, such as the EMA periods and the type of alert (e.g. sound, pop-up, email). This al
FREE

Multi Time Frame Indicator acts as a Scanner based on the Ichimoku Trading System. The outcome is displayed on a board. This helps you to make "at a glance" a mental picture of the System without having to open the chart. Up to 10 Currencies can be watched. Scanned elements And Legend "KUMO Futur" - Green : The Kumo Futur is Bullish. "KUMO Futur" - Red : The Kumo Futur is Bearish. "PRICE Cross KJ" - Green : The Price is Above the Kijun Sen. "PRICE Cross KJ" - Red : The Price is Below the Kijun
FREE
「GA Moving Average」(「GA 移動平均線」)は、移動平均線クロスオーバー戦略を用いたエキスパートアドバイザー(EA)であり、完璧なトレード戦略を実現するための多くの設定が可能です。
「GA Moving Average」の中心コンセプトは、移動平均線インジケーターを利用して潜在的なトレード機会を特定することです。異なる移動平均線の相互作用を分析することで、このEAは市場での買いシグナルと売りシグナルを生成することを目指しています。
主な特徴とカスタマイズオプション: 1. 移動平均線のパラメーター:トレーダーは、短期と長期の移動平均線の特定の期間を設定できます。これにより、トレーディングスタイルや好みに合わせて柔軟に適応することができます。さまざまな市場条件や時間枠に対応することが可能です。
2. クロスシグナルの生成:EAは、短期移動平均線が長期移動平均線を上回ると買いシグナルが生成され、短期移動平均線が長期移動平均線を下回ると売りシグナルが生成されるよう監視します。これにより、潜在的な買いチャンスや売りチャンスを示します。
3. リスク管理:EA
FREE

インディケータは指定された数のろうそくを分析し、高値-安値に基づいてフィボナッチレベルをプロットします。 レベルが再配置されているので、範囲の右側に関心があります。 価格はレベルに固執し、タッチに反応します。 このツールを使用して、修正後のトレンドエントリポイントを見つけます。 左側でレベルが完全に上昇していることがわかる場合は、極値で移動の終わりを見つけたと見なすことができます。 すべての線は、バッファまたはオブジェクトを介して描画されます(オプション)。
入力パラメータ 。
Bars Count - 計算範囲 。
Visual Button - ボタン表示(有効/無効) 。 Corner - ボタンアンカー角度 。 X indent - ピクセル単位の水平パディング 。 Y indent - ピクセル単位の垂直パディング 。
Label Visual - 表示レベルラベル 。 Label Font Size - フォントサイズ 。 Label Shift Bars - バーの碑文のインデント 。 Label Tooltip - レベルの上のカーソルの下に
FREE

False Breakout Stochastic to be used with our Elliott Wave Indicator as part of the overall strategy on trading the 5th wave.
As we cannot upload multiple files, we have listed this separately. False Breakout Stochastic is best used as a confirmation tool rather than the sole signal indicator The Elliott Wave Indicator Suite is designed around a simple but effective Swing Trading Strategy. The Indicator Suite is great for Stocks, Futures and Forex trading on multiple timeframes You can find the
FREE

Adjustable Fractal MT4 is a modification of Bill Williams' Fractals indicator. The fractal consists of a two sets of arrows - up (upper fractals) and down (lower fractals). Each fractal satisfies the following conditions: Upper fractal - maximum (high) of a signal bar exceeds or is equal to maximums of all bars from the range to the left and to the right; Lower fractal - minimum (low) of a signal bar is less or equal to minimums of all bars from the range to the left and to the right. Unlike a s
FREE

"Five Minute Drives" indicator that is designed to be used in the 5 minute timeframe. One of its most important advantages is that it shows the general trend in the upper time frames when looking at the 5-minute timeframe. Therefore, when opening positions in the 5 minute timeframe, when it is in line with the trends in the upper timeframes, you are less likely to be upside down. If you can evaluate breakout/breakdown opportunities between the curves on the graphic screen with your geometric per
FREE

Necessary for traders: tools and indicators Waves automatically calculate indicators, channel trend trading Perfect trend-wave automatic calculation channel calculation , MT4 Perfect trend-wave automatic calculation channel calculation , MT5 Local Trading copying Easy And Fast Copy , MT4 Easy And Fast Copy , MT5 Local Trading copying For DEMO Easy And Fast Copy , MT4 DEMO Easy And Fast Copy , MT5 DEMO 「協力QQ:556024」 「協力wechat:556024」 「協力メール:556024@qq.com」 トレンドインジケーター、 波動標準の自動計算 、 MT5バージョンの波動標準
FREE

Flag Pattern Indicator - Your Guide to Flagging Profitable Trade Setups Welcome to the world of precision trading with the "Flag Pattern Indicator." Designed for MetaTrader, this powerful tool is your go-to solution for identifying one of the most reliable and versatile chart patterns in technical analysis: the flag pattern. Whether you're a seasoned trader or just starting, this indicator simplifies the process of spotting flag patterns, giving you an edge in your trading decisions. Key Feature
FREE

Master Money Maker is a very high yielding Expert Advisor for experienced or professional traders and is not suitable for beginners looking for the miracle.
Master Money Maker represents a sophisticated Expert Advisor tailored for seasoned or professional traders, emphasizing its incompatibility with novice traders seeking quick solutions. Employing a meticulously crafted strategy, MMM operates as a fully automated breakout scalper, meticulously optimized through extensive testing over an
FREE
The Bollinger Scalper EA is a fully automated Expert Advisor that trades based on Bollinger Band and RSI entry signals. The EA trades using market orders and uses averaging to safely turn otherwise negative trades positive. This EA works best on EURUSD using the M5 timeframe. A VPS is advisable when trading this system. Check the comments for back test results and optimized settings. Please note: I have made the decision to give this EA away and many more for free with limited support so that I
FREE
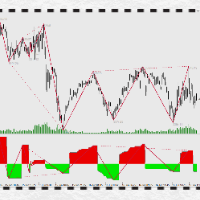
Introduction to PowerTrapezoid:
The application of market Power deviation system is not a secret, such as volume price deviation, MACD deviation, Chanlun deviation and so on. However, how to correctly understand and calculate, and accurately judge the increase or decrease of POWER is a threshold in application, which is difficult to cross with the conventional system. How to avoid reciting? How to implement multi level backflow parallel computing? How to intuitively show the range of backtrac
FREE

The Heikin Ashi indicator is our version of the Heikin Ashi chart. Unlike competitor products, this indicator offers extensive options for calculating Heikin Ashi candles. In addition, it can be displayed as a classic or smoothed version.
The indicator can calculate Heikin Ashi with moving average by four methods: SMA - Simple Moving Average SMMA - Smoothed Moving Average EMA - Exponential Moving Average LWMA - Linear Weighted Moving Average
Main features The indicator shows Heikin
FREE

MA Crossover Arrows is a simple indicator that draws arrows and alerts when two moving averages crossover.
Supported types of moving averages Simple Exponential Smoothed Linear Weighted
Supported Price types Close Open High Low Median Price (HL/2) Typical (HLC/3) Weighted Close (HLCC/4) When the fast moving average crosses above the slow moving average, a green up arrow will appear on the chart. When the fast moving average crosses below the slow moving average, a red down arrow will appear
FREE
「GA Moving Average」(「GA 移動平均線」)は、移動平均線クロスオーバー戦略を用いたエキスパートアドバイザー(EA)であり、完璧なトレード戦略を実現するための多くの設定が可能です。
「GA Moving Average」の中心コンセプトは、移動平均線インジケーターを利用して潜在的なトレード機会を特定することです。異なる移動平均線の相互作用を分析することで、このEAは市場での買いシグナルと売りシグナルを生成することを目指しています。
主な特徴とカスタマイズオプション: 1. 移動平均線のパラメーター:トレーダーは、短期と長期の移動平均線の特定の期間を設定できます。これにより、トレーディングスタイルや好みに合わせて柔軟に適応することができます。さまざまな市場条件や時間枠に対応することが可能です。
2. クロスシグナルの生成:EAは、短期移動平均線が長期移動平均線を上回ると買いシグナルが生成され、短期移動平均線が長期移動平均線を下回ると売りシグナルが生成されるよう監視します。これにより、潜在的な買いチャンスや売りチャンスを示します。
3. リスク管理:EA
FREE

チャネルインジケータはトレンドであり、再描画されません。 反対のボラティリティ境界を持つATR価格チャネルを作成します。 この指標は、インパルスレベルと偽のブレイクアウトで取引する戦略で十分に証明されています。 指標線の修正でエントリポイントを探し、反対側の境界にテイクプロフィットを設定する必要があります。 Blog-Link - Retest and Fake Breakout with UPD1 。
入力パラメータ 。
Bars Count - 表示する履歴 。 ATR - 計算期間 。 Coefficient - 動的価格チャネルの高さに影響を与える係数 。
Visual Channel - 一行または二行表示 。 Simple Line Visual Width - 単純な線の太さ 。 Simple Line Buy Color - シンプルなラインカラー Buy 。 Simple Line Sell Color - シンプルなラインカラー Sell 。
Reverse Channel - 反対のチャンネルを表示するかどうか
FREE

Gold TL MTF - this is a fine stock technical indicator. The indicator algorithm analyzes the movement of the asset price and reflects trend lines along the fractals of a specific timeframe (TF).
Benefits of the indicator: The indicator produces signals with high accuracy. The confirmed signal of the indicator does not disappear and is not redrawn. You can trade on the MetaTrader 4 trading platform of any broker. You can trade any assets (currencies, metals, cryptocurrencies, stocks, indices
FREE

The indicator builds a Renko chart in the sub window for the current symbol. The bars are formed from live data and the desired bar size can be set in the inputs tab. Most importantly, because the Renko chart only uses price to construct bars and ignores time, the indicator can be applied to any time frame and same results can be achieved. Recommended usage
As Renko charts are famous for eliminating noise so traders can use this tool to see clear picture of the trend to help their analysis, ent
FREE

マーチンゲール。 Parabolicumは複数通貨のエキスパートアドバイザーです。 別々にそして同時に9つの通貨ペアでテストされました:
マルチカレンシーテストの結果 (ブローカー:「Roboforex」): 「ParabolicumMT5」 のバージョン 作業記号:EURUSD、GBPUSD、USDCAD、EURCAD、CADCHF、USDCHF、AUDCAD、AUDCHF、EURCHF 時間枠H1 最低保証金:$ 1000(最低ロット0.01) 推奨ロットステップ0.01 ヘッジ口座の種類 エキスパート機能: 「広がり」に敏感。 テストするときは、テスターで「スプレッド」をチェックします(週末ははるかに高くなります)。 必要に応じて、「現在」をこの通貨ペアのより現実的なものに変更します。 Expert Advisorは、任意の時間枠でチャートにインストールされます。 ブローカーのシンボル名に接尾辞または接頭辞がある場合は、それらを入力データに書き込みます。
FREE

This indicator uses Bollinger Bands lines to detect markets trend. It's a very useful tool for manual trading. Furthermore it is possible to use the indicator with ATR as a filter , as well as the option to pop up an alert when a reverse trend occurs. The readings are very simple to use and understand. Indicator works best on H1 timeframe.
You can to get source code from here .
Parameters BarsCount - How many bars used to show the line. BBperiod - Period of Bollinger Bands. BBdeviations - De
FREE

06/22/23 News!
The "news filter" is integrated in the EA.
Remember to insert in this url in Tools->Options->Expert Advisor
You can disable this filter or use it in two way :
Trade only on news No trade on news THANKS ALL!
06/21/23 News! Finally I see the light at the end of tunnel!
Thanks all the contributors, now the EA has and efficient and very configurable Trailing Stop.
In more It has also the extra profit function that move the Take Profit point by point.
I remember you that t
FREE

ルールプロッターを使用して自動取引ロボットを作成する方法 マウスの数回のクリックで取引戦略を自動化できるとどれほど強力であるか考えたことがありますか?複雑なコードに没頭する必要なしに、さまざまな取引戦略を作成してテストできる自由を持つことを想像してください。ルールプロッターを使用すると、このビジョンが現実のものとなります。ここでは、ルールプロッターを使用してカスタム取引ロボットを作成する方法を探ってみましょう。これは、取引システムの作成を簡素化するツールです。 ルールプロッターとは何か、そしてどのように機能するか ルールプロッターは、MetaTraderのインジケータを使用してエキスパートアドバイザ(EA)を作成するためのプログラムです。このツールを使用すると、複雑なプログラミングの詳細を理解する必要なく、取引戦略を自動化できます。プロセスは簡単で、必要なインジケータをチャートに追加し、入出力条件を定義し、あとはルールプロッターにお任せください。 プログラミングの知識なしに戦略を自動化 ルールプロッターの主な利点の1つは、そのアクセシビリティです。プログラミングの経験がなくても、Met
FREE

Lord Auto Fibonnaci is a free indicator for Meta Trader, in order to show the most famous chart in the financial market known as "Fibonnaci".
As we can see in the images below, the fibonnaci table will automatically analyze the graph for you, with trend factors through percentage, almost infallible use, you can always work when the percentage is low or high, start shopping and sales on time, great for analyzing entries!
In the images below we can see an example in gold in H4, where we are a
FREE

このプロジェクトが好きなら、5つ星レビューを残してください。 インスタグラムでフォロー:borelatech 機関が大きなボリュームを取引するので、それらが試してみることは珍しくありません
特定のパーセンテージレベルでポジションを守る これらのレベルは、あなたが使用できる自然なサポートと抵抗として役立ちます
取引を入力するか、ポジションに対する危険性を認識する。 一般的に使用されるパーセンテージの例は、EURUSDの0.25%と0.50%です。
毎週、スクリーンショットでこの例を見ることができます。 このインジケータを使用すると、以下の割合の変動を描画することができます。 日。 週。 月 日 クォーター。 生年月日
FREE

The indicator displays volume profiles based on the nesting principle. Profiles periods are pre-set so that each subsequent profile has a length twice as long as the length of the previous profile. In addition to profiles, the indicator displays volume clusters sorted by color, depending on the volume they contain.
Indicator operation features The indicator works on typical timeframes from M5 to MN, but for calculations uses historical data from smaller timeframes: M1 - for timeframes from M5
FREE
Algorithm EA,or double hedge EA is your tool by using a double hedging mechanism. The EA open a trade in a trending market - no matter which direction.You can set also Tp and SL, but it is not needed,because of basket profit and amounth of opened position,which you can preselect and fit to your deposit.Min deposit is about 1000 $,0.01 Lot recomended.
This EA uses a hedging technology In case the market moves in the unfavorable direction, the EA starts hedging your trade by placing an opposite
FREE

ゴールドエンジェルのEAへようこそ
とても安定した利益が見込めるEAです。
おすすめです。
ロジックは簡単です。
BANDインジケータを使用しています。バンドを価格がハズレた場合に、フラグがONになります。まだエントリーはしません。
そして価格の動きを注意深くモニターします。
価格がバンドの中に戻り、センターラインにタッチしたときに、順張りでエントリーします。シンプルですが、トレントが安定しているときは利益が大きいです。
特にXAUUSDにベストマッチします。
ただし、タイムフィルターを使うことが条件です。
ヨーロッパ時間や、ニューヨーク時間帯は、大きなボラティリティのため、利益がでません、タイムフィルターを使ってボラティリティの小さい時間帯を設定してください。
ストップロスは、逆のシグナルを使います。
またTPはトレーリングストップでクローズします。
また利益がマイナスでクローズした場合は、次のロットをあげます。設定で変更可能です。
FREE
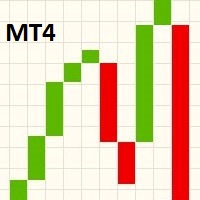
This indicator displays a Line Break chart in the main chart window. To view the line break chart on its own, change the main chart window to display a Line Chart and then change the "Line chart" color to "None" in the F8 properties dialog. When scrolling, zooming in/out or changing the chart pair/timeframe, the indicator will resize the blocks on the next tick to fit the main chart viewing area. Line Break charts were invented in Japan and are similar to Point & Figure and Renko charts. A Japan
FREE
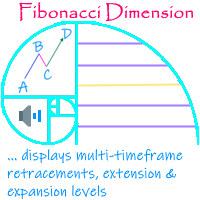
'Fibonacci Dimension' indicator allows display of preset or user-defined multi-timeframe Fibonacci levels. It automatically takes the previous high and low for two user-defined timeframes and calculates their Fibonacci retracement levels. It also considers the retraced level to draw the expansions on every change of price. A complete visual dimension in multiple timeframes allows deriving profitable strategies for execution. The functionalities included are: Provides an option to consider a pres
FREE
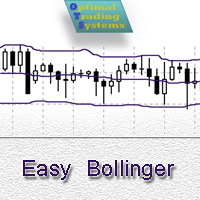
This Expert Advisor trades based on the Bollinger Bands indicator. It performs trades after a price rebound from the borderlines of the indicator. It is simple to use, contains only a few settings, which are easy to understand. This is the simplified version of the Master Bollinger Bands Expert Advisor. For better trading results, it is recommended to use the full version of the EA: https://www.mql5.com/en/market/product/21788 The free version does not provide the ability to use multiple indicat
FREE

Tipu Trend is a non-lag, non-repaint, smart indicator, that shows the trend of selected time frames.
Features Customizable Buy/Sell alerts, push alerts, email alerts, or visual on-screen alerts. As easy to trade indicator that smooths the noise in the price action. Highlights ranging markets. Add Tipu Panel (found here ) and unlock the following additional features. An easy to use Panel that shows the trend + signal of the selected time frames. Customizable Panel. The panel can be moved to any
FREE

Are you tired of drawing trendlines every time you're analyzing charts? Or perhaps you would like more consistency in your technical analysis. Then this is for you. This indicator will draw trend lines automatically when dropped on a chart. How it works Works similar to standard deviation channel found on mt4 and mt5. It has 2 parameters: 1. Starting Bar 2. Number of bars for calculation The starting bar is the bar which drawing of the trend lines will begin, while the number of bars for c
FREE

This indicator identifies swing highs and swing lows in the price chart by comparing the Highs and lows of each candle to a specified number of candle before and after it. Once it has identified the swing highs and swing lows, it can use them to determine potential support and resistance levels. A support level is formed when the price drops and bounces back up from a swing low, indicating that there is buying pressure at that level. A resistance level is formed when the price rises and reve
FREE

Basic Fibonacci Calculation Indicator
shows Trend, Stoploss, Profit 1,2,3, will show you your daily Highs and your Daily Lows , it will also show you where it expects the price to move to. best time frame is H1 or higher .
For a better system that also includes my Non-repaint Indicator please check out my paid Fibo Indicator https://www.mql5.com/en/market/product/82323
FREE

Current indicator shows the trading sessions for the major financial centres: London New York Tokyo Sydney There are available two types of displaying zones: in sub window below the chart and on the chart. When the subwindow is selected, the sessions are shown in the form of bars. If the sessions are shown on the main chart, they are displayed in the form of lines at the open price of the session that may also act as a support and resistance for further price action during the trading day. The
FREE

Levels インジケータは、前日のデータに基づいています。 数式がエントリーレベルとエグジットレベルを決定します。
取引推奨。 Levelsは、ボラティリティが出現する欧州セッションの開始時に取引する。 ボラティリティが十分でない場合は、利食いの半分でエグジットする。 利益が半分の水準で価格が反転した場合、反転時に利益が半分の水準でターゲットを探します。 価格がエントリーレベルから跳ね返された場合、反対方向に価格が2番目のテイクプロフィットに到達する可能性があります。
常にブレイクアウトでエントリーするべきではありません。再テストを待つことをお勧めします。 再テストは、市場に複数の最小出来高レベルがある場合に有効です。UPD1 Profile Levelsインディケータを参照。
入力パラメータ 。
Start Hour - 1日の始まりの時間から。 00-デフォルト 。
Visual Button - ボタン表示(有効/無効) 。 Corner - ボタンアンカー角度 。 X indent - ピクセル単位の水平パディング 。 Y indent
FREE

Vanda FX USES THE TREND WAVE INDICATOR AND IT CAN IDENTIFY THE BEGINNING AND THE END OF A NEW WAVE TREND MOVEMENT.
AS AN OSCILLATOR, THE INDICATOR IDENTIFIES THE OVERBOUGHT AND OVERSOLD ZONES.
IT WORKS GREAT TO CATCH THE SHORT TERM PRICE REVERSALS AND USES A MARTINGALE STRATEGY TO CLOSE ALL TRADES IN PROFIT.
USE DEFAULT SETTINGS ON H1 OR HIGHER TIME FRAME ON ANY PAIR FOR MORE ACCURATE TRADES
WHY THIS EA :
Smart entries calculated by 4 great strategies The EA can be run on even a $2000
FREE

The FVG MT4 Bot, or Fair Value Gap Trading strategy, is a method used in trading financial instruments, typically in the context of the MetaTrader 4 (MT4) platform. This strategy focuses on exploiting discrepancies between the current market price and its perceived fair value, usually identified through technical indicators and analysis. Here's a description of the Fair Value Gap Trading strategy: Timeframe (H1) : This strategy operates on the one-hour (H1) timeframe, meaning it analyzes price m
FREE

Talleyrand PitchFork EA: Your Ultimate Trading Diplomat Introducing the Talleyrand PitchFork Expert Advisor (EA), a revolutionary trading tool designed to elevate your trading strategy through a masterful blend of technical indicators and advanced trade management features. This sophisticated EA harnesses the precision of Gann Lines, Moving Averages (MA), Bollinger Bands, and the MACD to pinpoint the most advantageous moments for trade entry and exit, ensuring unparalleled accuracy and efficienc
FREE

アカウントダッシュボードの統計
これは、アカウントの損益を把握するために集中的に表示するのに役立つツールであり、それを追跡することができ、また、得られるリスクを知るためのドローダウン分析も提供します。 アカウントにダウンロードしてアクティブ化した後、EURUSD H1 などの任意のシンボルに添付する必要があります。その後、この瞬間からツールが統計の監視を開始します。
パネルは完全に高度になっており、非表示にしたり、好きな場所に移動したりできます アカウント操作に基づく主な特徴は次のとおりです 毎日の期間(毎日の利益と損失は毎日更新されます) 毎週の期間 (毎週更新される週ごとの利益と損失) 毎月の期間(毎月の損益は毎月更新) 年間期間 (年間の損益は毎年更新) 最大ドローダウン(残高に基づいて最大リスクに達するのを毎秒監視して制御) たとえば、残高が 1000 米ドルで、引き出しが 10% をマークしている場合、ある時点でアカウントの合計リスクが 100 米ドルに達したことを意味します。
FREE

Download the free USDJPY version here.
MACD Indicator The Moving Average Convergence and Divergence (MACD) is a trend following momentum indicator which shows the relationship between two moving averages that we chose and configure them on the indicator. The MACD is calculated by subtracting the 26-period exponential moving average and the 12 period D.A.M. These are the default parameters when you put the MACD indicator on the charts, and the period is usually 9 which means the last 9 candle
FREE
MetaTraderプラットフォームのためのアプリのストアであるMetaTraderアプリストアで自動売買ロボットを購入する方法をご覧ください。
MQL5.community支払いシステムでは、PayPalや銀行カードおよび人気の支払いシステムを通してトランザクションをすることができます。ご満足いただけるように購入前に自動売買ロボットをテストすることを強くお勧めします。
取引の機会を逃しています。
- 無料取引アプリ
- 8千を超えるシグナルをコピー
- 金融ニュースで金融マーケットを探索
新規登録
ログイン